

What help desk management actually covers
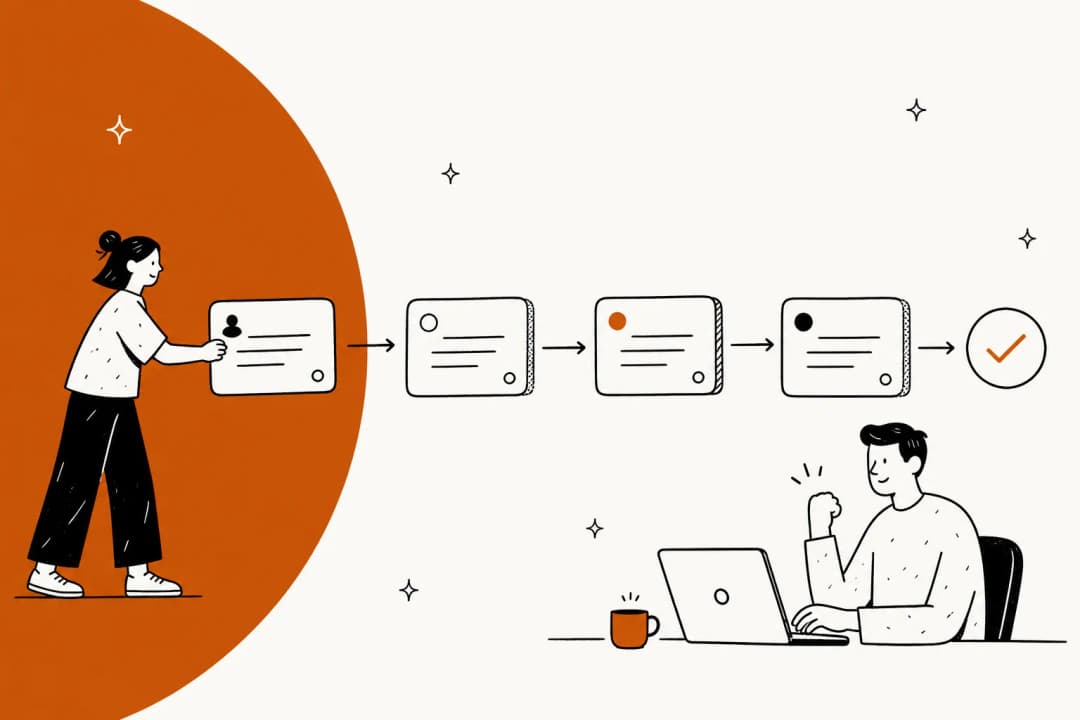
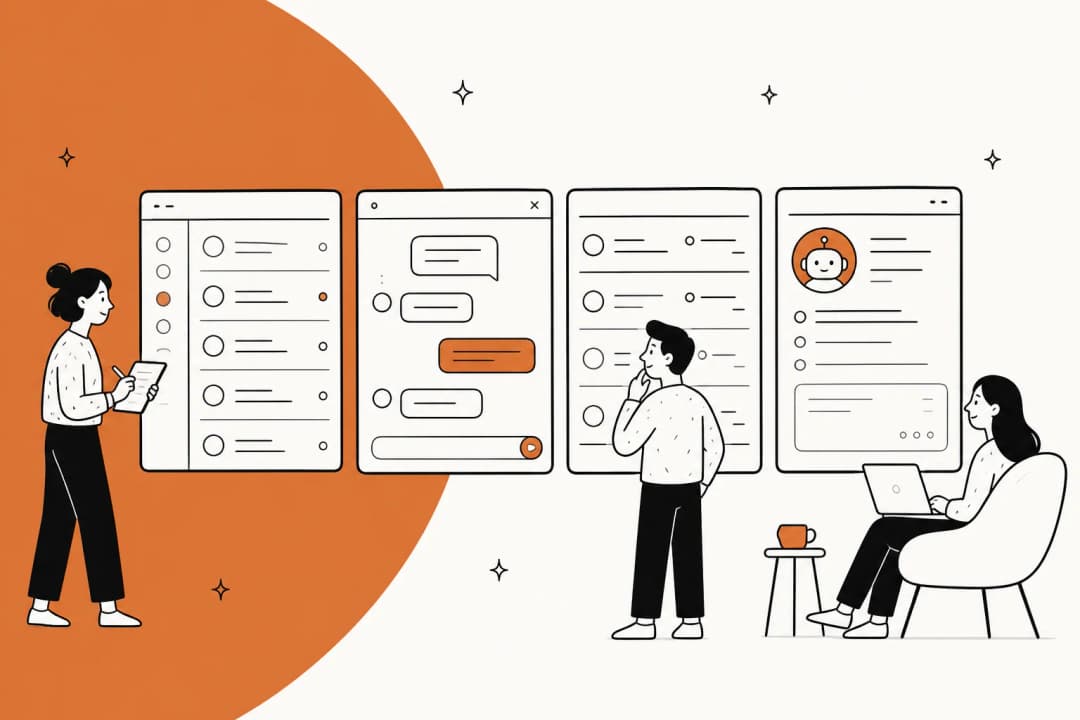
Strip the job description back and you get four control surfaces:
- Intake. Which channels you accept, what a request has to contain, and where a repeat question gets intercepted before it becomes a ticket.
- Flow. Routing, priority, SLA policies, escalation, and who is allowed to say no.
- Knowledge. The articles, macros and tribal know-how that decide whether a ticket takes four minutes or forty.
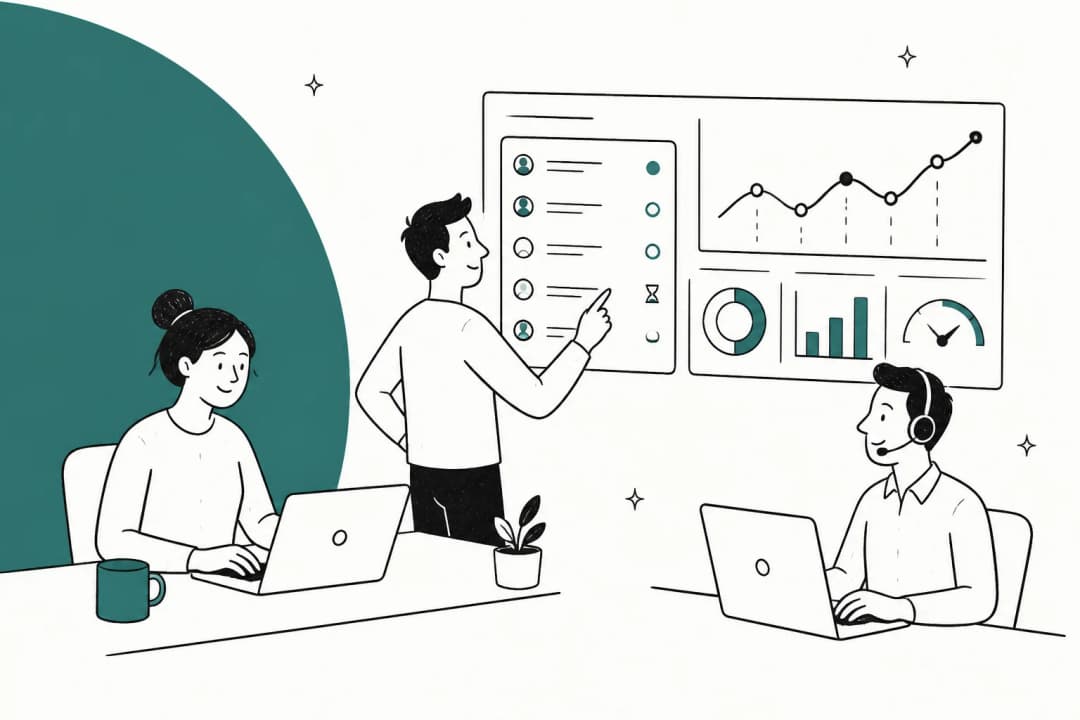
- Measurement. The scoreboard, which quietly rewrites all three above whether you meant it to or not.
Most guides to help desk management spend all their words on the tool. The tool matters, and picking well between Zendesk, Freshdesk, Help Scout or Jira Service Management saves you real pain, as does knowing what each one charges once the AI add-ons land (Zendesk pricing, Freshdesk pricing, Help Scout pricing). But every desk I have watched improve did it by changing what arrives and what gets measured, not by migrating platforms.
The reader expectation side has moved too. In Zendesk's CX Trends 2026, built on two surveys of 6,182 consumers and 5,115 business respondents in June 2025, 74 percent of consumers now expect service to be available around the clock, and 85 percent of CX leaders say customers will drop a brand that cannot resolve an issue on first contact. Those two facts together are the whole argument for automating the overnight tier-1 layer rather than staffing it.
Step 1: find out what is actually in your queue
Before any process change, count the queue. Not the total, the composition. Almost every desk discovers the same thing, and an internal IT manager put it better than any report:
"I'm part of our internal IT team and it feels like we answer the same questions every single day.
Password resets, VPN setup, printer connections you name it. We already have documentation but most people don't seem to read it before opening a support ticket."

An operator on the telecom side gave the sharpest proportion I have seen for consumer volume: "80% of our call volume is still problems solved by 'have you tried turning it off and on again?'", per a Hacker News comment. Your mix will differ, but the shape rarely does.
The reason composition matters more than volume is that a ticket is not one unit of work. MetricNet's benchmark tables, published by HDI, split incidents (something broke) from service requests (something needs provisioning), and the gap is enormous:
| Industry | Incident work time (avg) | Service request work time (avg) | Ratio |
|---|---|---|---|
| Financial services | 18.3 min | 83.4 min | 4.6x |
| High tech | 19.8 min | 95.9 min | 4.8x |
| Equipment manufacturing | 14.7 min | 50.5 min | 3.4x |
| Telecom | 16.1 min | 76.2 min | 4.7x |
| Business services | 21.5 min | 72.8 min | 3.4x |
| Healthcare | 12.3 min | 35.4 min | 2.9x |
| Energy utilities | 14.2 min | 53.4 min | 3.8x |
A service request costs you three to five times the agent minutes of an incident in every industry in that table. If your reporting counts both as "1 ticket", your capacity plan is wrong by a factor you cannot see. The first fix in help desk management is almost always a tagging fix, and AI ticket classification is the cheapest way to get there without asking agents to hand-label everything.
Channel mix is the other half of intake. Voice did not die the way the 2010s predicted: per Zendesk's June 2026 newsroom post, voice still accounts for 40 percent of contact centre volume and is growing, while 75 percent of contact centre leaders say legacy technology stops them delivering a true omnichannel experience. Chat, meanwhile, is smaller than the marketing suggests. MetricNet's chat benchmark has 10.9 percent of contacts originating in chat but only 6.6 percent resolved there, with a 32 percent failover rate to voice.
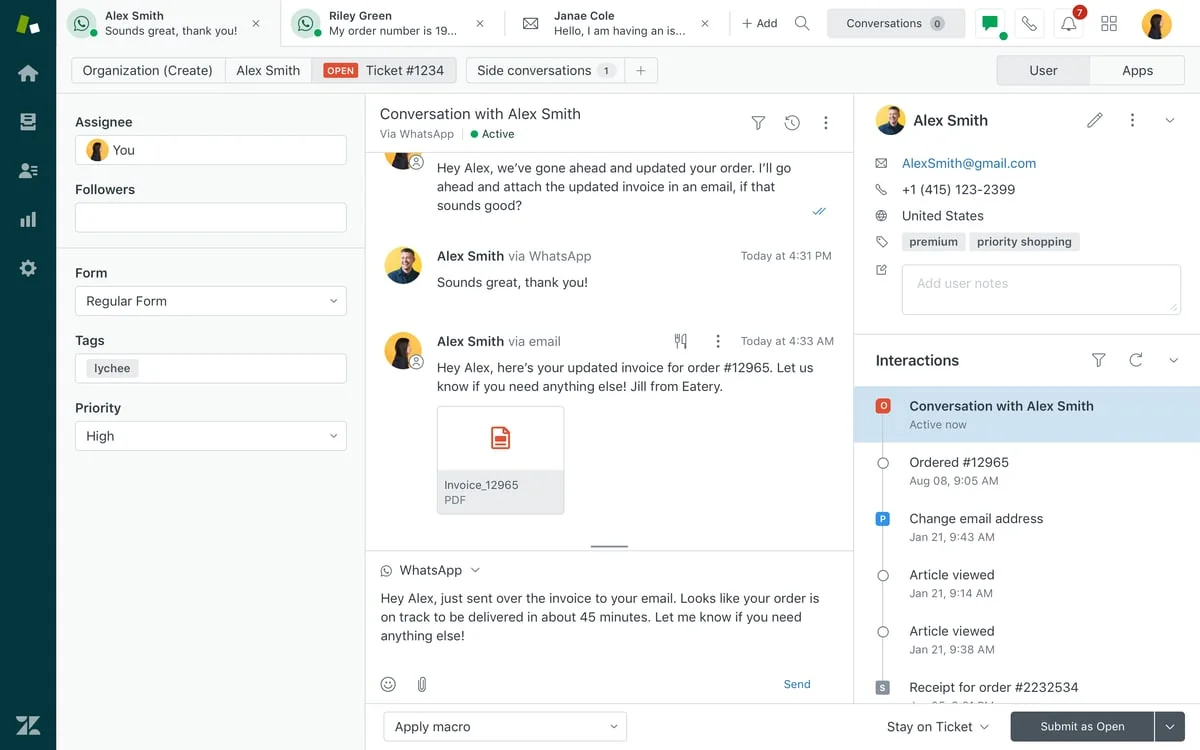
That 32 percent failover number is worth writing on the wall. A third of chats do not finish in chat, so a chat deflection target set without a handoff plan is a plan to annoy people twice.
Step 2: do the staffing math before you set targets
Here is where most help desk management goes wrong: leadership picks a tickets-per-agent-per-day number from somewhere, and the desk spends the next year gaming it.
The honest benchmark range is wide. MetricNet's tickets-per-technician data spans 30 to 198 tickets per technician per month across industries (that dataset carries a 2012 copyright, so treat it as shape rather than a current rate card). The practitioner band is tighter and more useful, from an IT manager answering exactly this question:
"It depends on the industry and the type of company. For an MSP (where you get a large variety of tickets), 10 tickets per day is average. 15 tickets is excellent. 20 tickets is unusually fast, not sustainable."
Then there is the ceiling nobody plans for. MetricNet's agent utilization data puts the worldwide average at about 48 percent, ranging from 22 to 76 percent, and states the burnout threshold plainly: "Whenever agent utilization rates approach 60–70 percent, a service desk will experience relatively high agent turnover because they are pushing the agents too hard, leading to burnout and low morale." Personnel is roughly two-thirds of a service desk's total cost, so this is also your budget line.
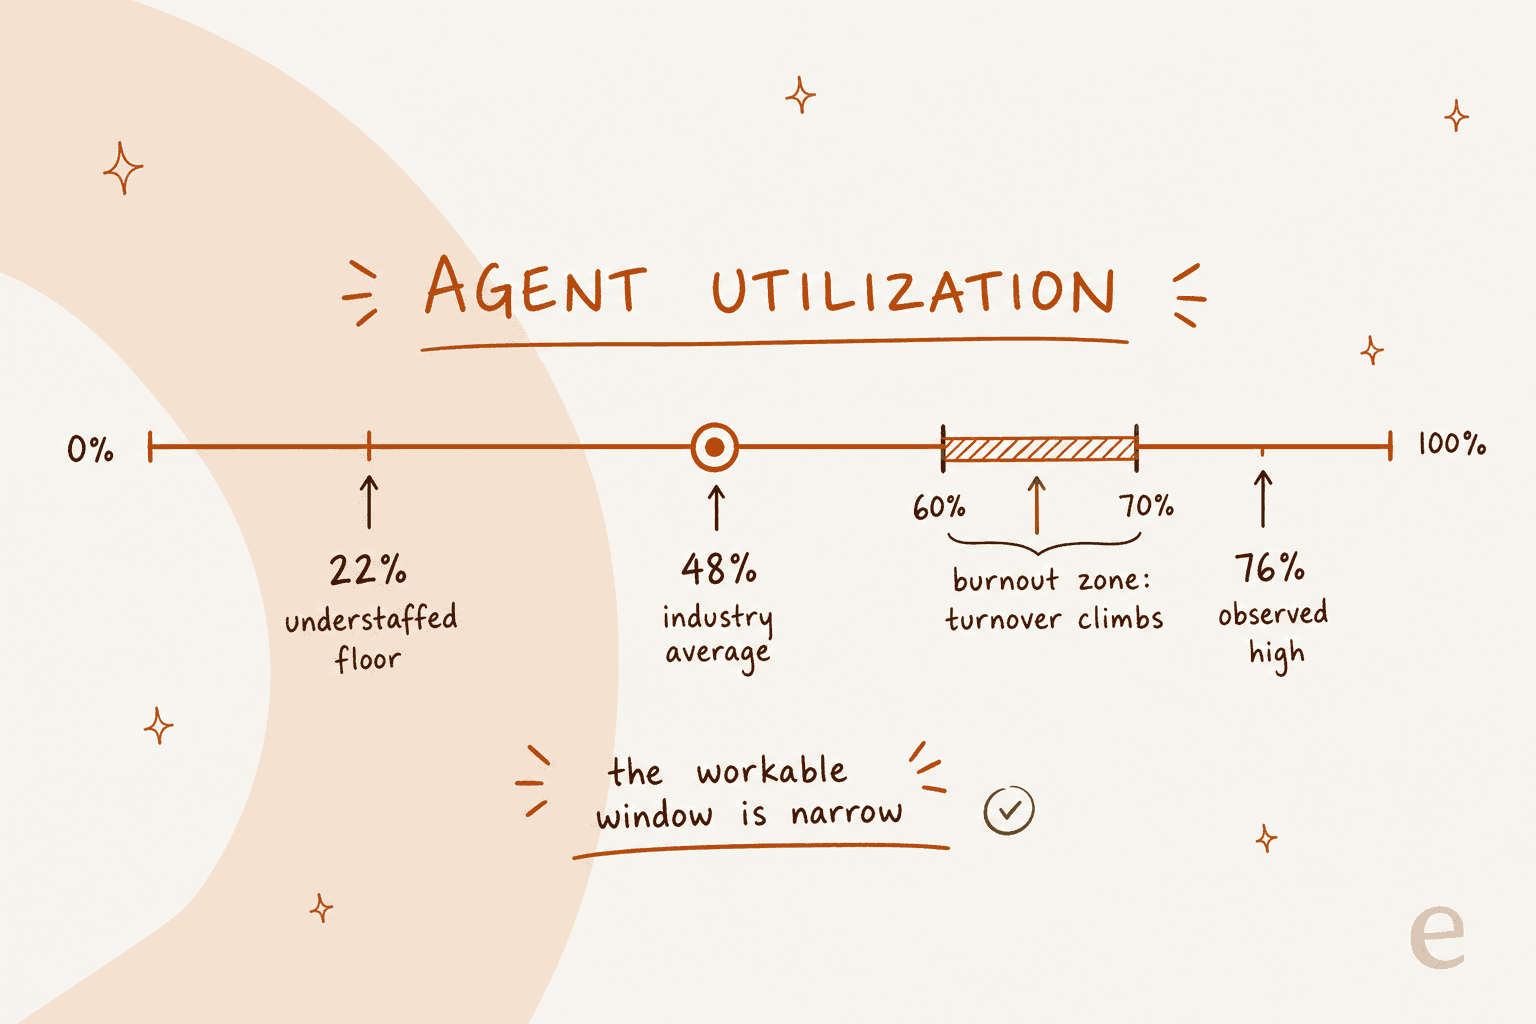
Push past that band and the treadmill starts, which someone with fifteen years in city government IT described with no self-pity at all: "I can close 10 to 20 tickets a day.. and still have more tickets at the end of the day than when the day started", in a thread about aged tickets. Salesforce's State of Service, Seventh Edition puts a corporate number on the same thing: reps spend less than half their time (46 percent) with customers, and 12 percent of service employees left in the past year.
Plug your own numbers in below. It uses the same handle-time arithmetic, so you can see where your team sits against the 48 percent average and the burnout band before you commit to a hiring plan or an automation target.
If the utilization number comes back over 60, the honest options are hire, cut scope, or take work off the queue. Only the third one is fast, which is why the automation conversation usually starts here rather than in a strategy meeting, whether that means an AI ticketing system, tier-1 deflection, or broader customer service automation.
Step 3: make escalation cheap, and first-level resolution the target
Every level a ticket climbs multiplies its cost, and the costs stack rather than replace each other. MetricNet's ladder, published by HDI: $22 at level 1, $62 at desktop support, $85 at level 3, $196 for field support, $471 for vendor support. In Jeff Rumburg's words, the cumulative version is the one that bites: a ticket logged at level 1 then escalated to desktop support costs $62 plus $22, "for a total of $84."
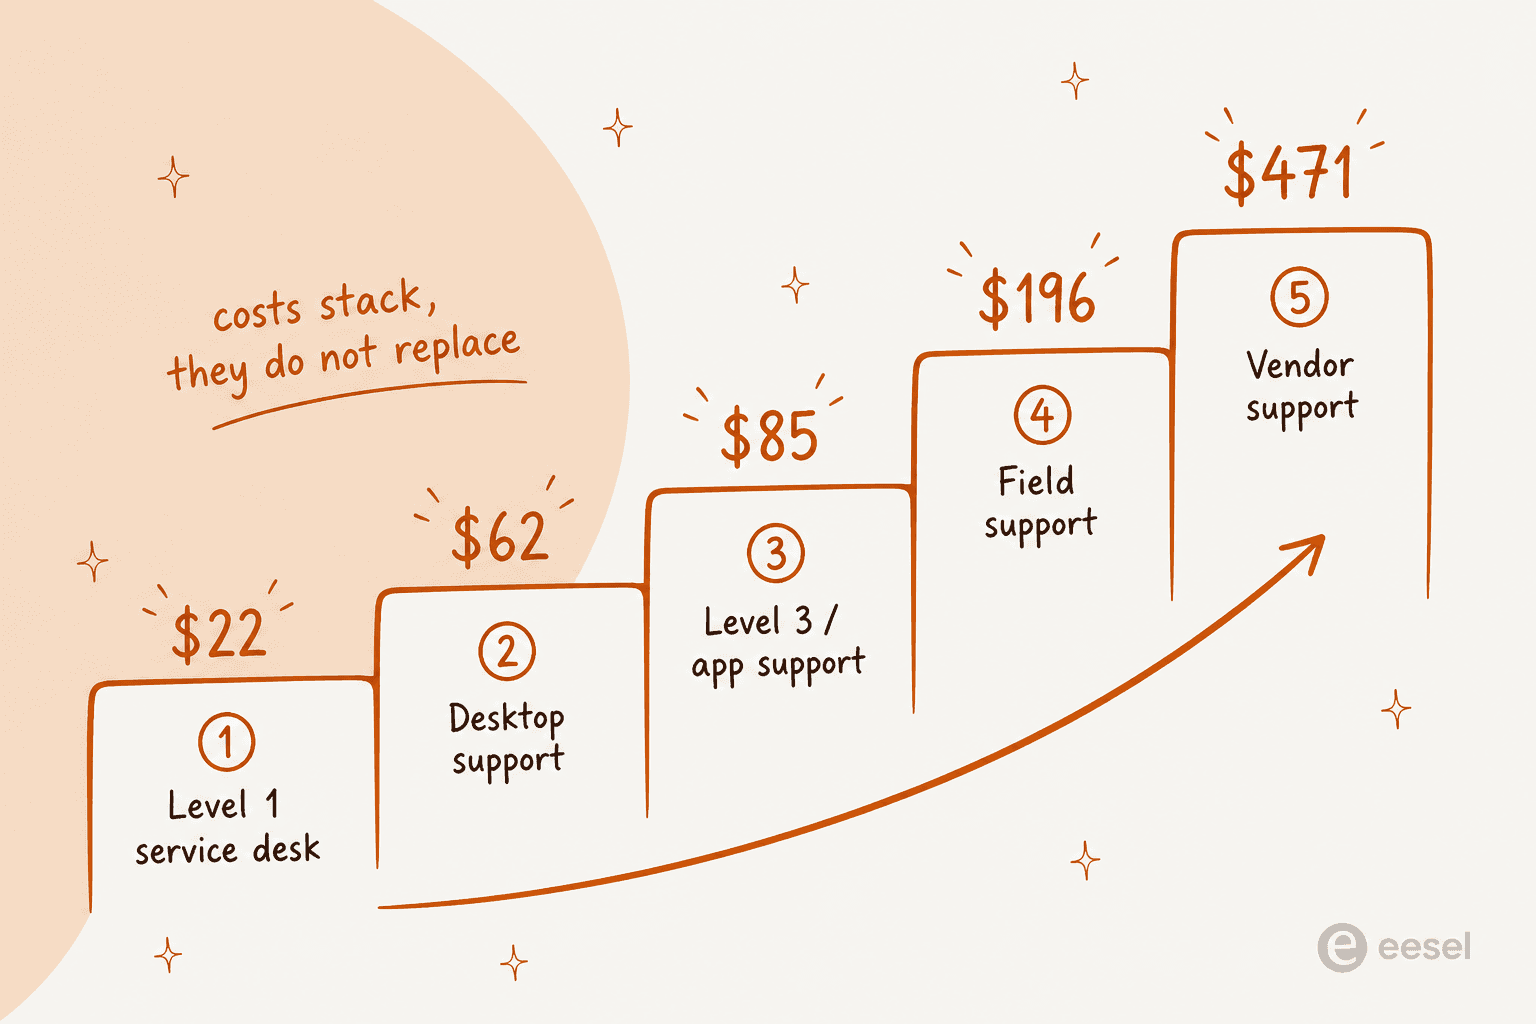
Average net first-level resolution runs about 74.3 percent, with a spread from 38 to 98 percent. So the median desk is escalating roughly a quarter of the tickets it could have closed itself. That is the biggest single line of recoverable cost in most help desk management budgets, and it is a design problem, not an effort problem.
The design failures are consistent. Tier 1 gets hollowed out into a routing layer:
"A lot were very numbers orientated. Job was to ticket the issue and solve if it could be done in like 10 minutes or less. Anything else gets routed to another team. [...] Too many help desk places are just call centers now. Less IT, more reception, ticket routing."
And escalation becomes hot potato rather than handoff. One tech described routing work to level 3 "well knowing it wont be solved just to have it away", in a thread on AI service desks. If your reopen and bounce-back rates are invisible, this is happening on your desk right now and your dashboard says everything is fine.
Three concrete moves that raise first-level resolution without new headcount:
- Give tier 1 permission and tooling to finish work, including refunds, resets and provisioning up to a stated limit. A 10-minute cutoff rule guarantees escalations.
- Make the escalation carry context. The most demoralising pattern in support is a ticket bouncing back with suggestions the agent already tried and documented, which an MSP tech described exactly that way in a thread about escalation friction.
- Decide whether you even want tiers. Atlassian argues against them on its own service request management page: "Typical tiered support teams are highly structured and manage requests via escalations. We recommend a more collaborative approach." Zendesk, Freshdesk and Help Scout all ship routing and skill-based assignment as core primitives, so this is a real split in how the category thinks.
Whichever model you pick, the platform features you lean on are broadly the same. Here is what the four common helpdesks actually give you on the flow layer, from their own feature pages:
| Capability | Zendesk | Freshdesk | Help Scout | Jira Service Management |
|---|---|---|---|---|
| Routing | Omnichannel routing to "the most qualified agents" (source) | Dispatch rules, round-robin, load-balanced, skill-based (source) | Assign automatically or with a click (source) | Queues to "track, triage, and assign", with ML grouping (source) |
| SLA policies | Alerts on unattended tickets, manager escalation (source) | Multiple policies per customer, shift and product (source) | Condition-based views such as "Waiting over 24 hours" (source) | Unlimited policies plus automated escalation rules (source) |
| Canned replies | Macros applied in one click (source) | Ticket templates with pre-filled properties (source) | Saved Replies (source) | Not surfaced as a named macro feature |
| Knowledge base | Unified knowledge graph across help centre, forums, Confluence, Drive (source) | Multilingual KB, versioning, approval workflow (source) | Docs, no-code help centre, access-restricted option (source) | KB that recommends articles during request creation (source) |
| Reporting | Out-of-the-box analytics plus real-time monitoring (source) | Pre-defined reports, custom dashboards, agent availability (source) | Volume, response, handle and wait time, per-agent coaching (source) | CSAT reports, dashboards, post-mortem export (source) |
| Native AI | Zendesk AI agents with built-in QA (source) | Freddy AI Agent, Copilot and Insights (source) | AI Drafts and AI Summarize (source) | Virtual service agent inside Slack (source) |
If you are choosing rather than optimising, our comparisons of Zendesk AI, Freshdesk AI, Zoho Desk AI, Gorgias AI and Help Scout workflows go a level deeper than these feature grids, and the roundups for small businesses, internal teams and high-volume queues sort by situation rather than brand.
Step 4: treat the knowledge base as a discovery problem, not a content problem
Every desk I have looked at has more documentation than its users have ever read. The failure is almost never that the article does not exist. It is that nobody meets the article at the moment they needed it.
The most efficient summary of the whole problem is eleven words from r/sysadmin:
"My internal knowledge base doesn't have information from my internal knowledge base."
And a healthcare help desk agent, four years in, described the customer-facing half without flinching: "our customer-facing KB is useless though as our customers don't even bother to use it despite some good stuff being in there for them (adding printers, self service PW resets, etc)", in a burnout thread. Good content, zero traffic. That is a discovery problem wearing a content problem's clothes.
This is also where the deflection numbers stop matching the pitch. MetricNet's benchmark for self-service completion is 10.4 percent on average, ranging from zero to 55 percent, and the same article notes that "the vast majority of these self-resolved incidents are password resets." Vendor case studies quote 30 to 95 percent: Tesco's self-service share grew "from just 30 percent to 73 percent" over three years and Hello Sugar reports a 66 percent automation rate, both published on Zendesk's knowledge and AI agents pages. Both sets of numbers can be true; they are just measuring different desks.
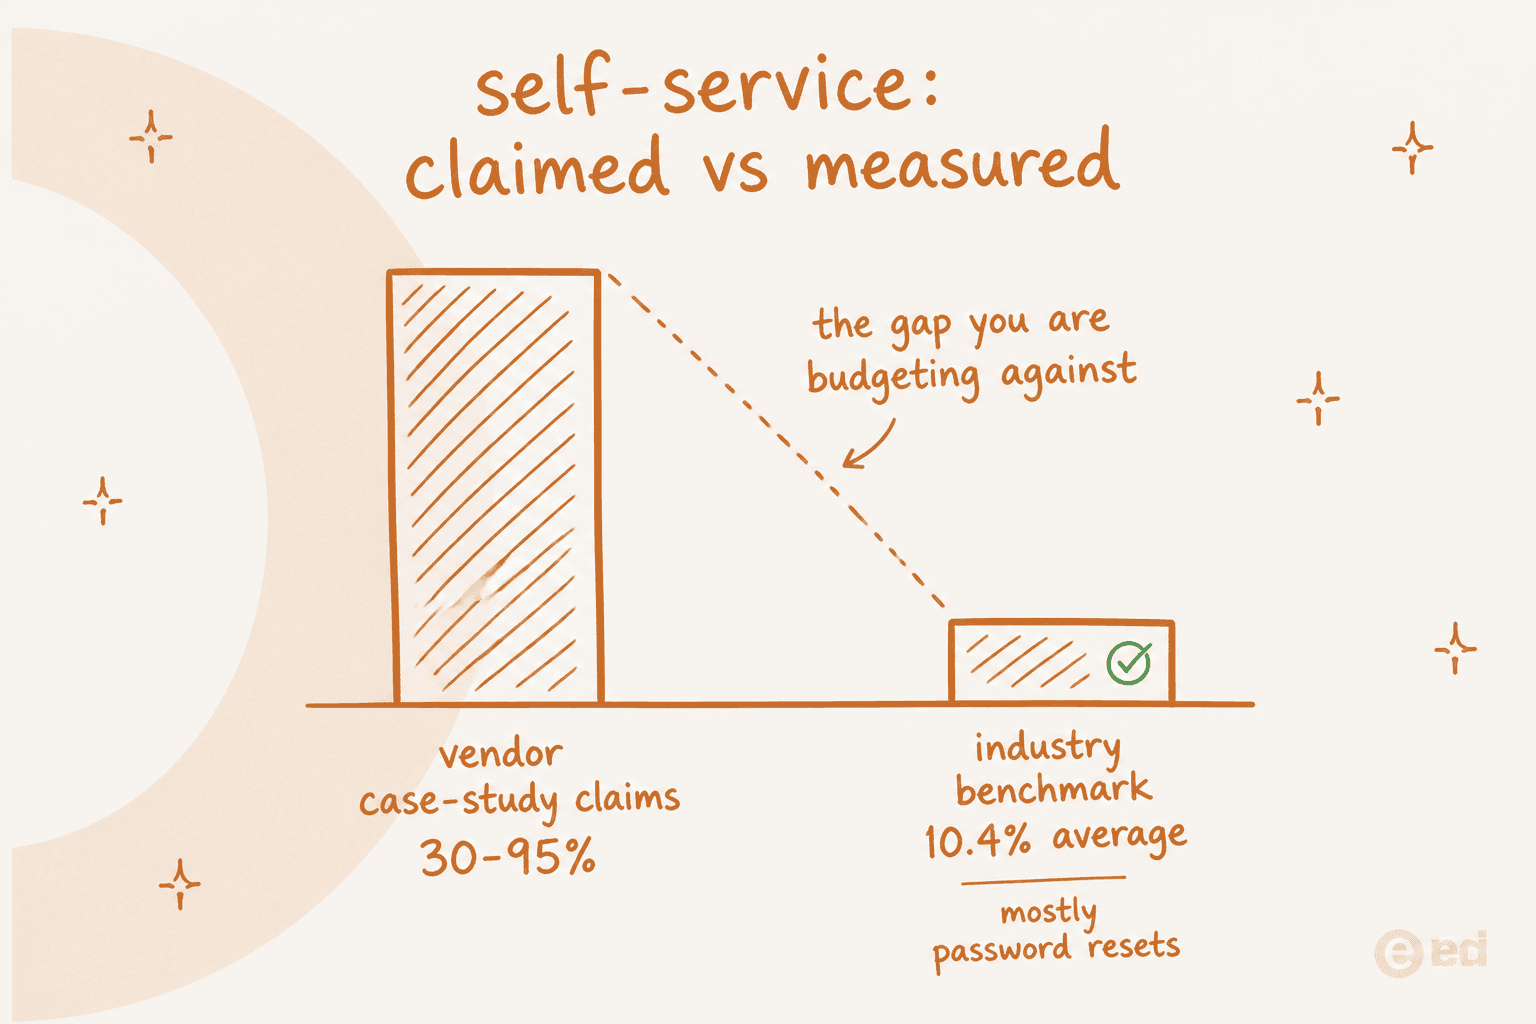
Two mechanics from MetricNet worth designing around. First, deflection raises the cost of everything left: "as these lower-handle-time incidents are deflected into the self-service channel, the average complexity and the average handle time of the incidents that continue to be handled by live agents will increase." Second, there is a time ceiling: a user should not spend more than 10 minutes trying to self-resolve, or the lost productivity outweighs the saving.
The design that actually works is interception at the moment of creation, not a widget on a portal page. Compare these two, same technology, opposite results. The version that works:
"We have a bot connected to an LLM that has indexed our internal documents and it will prompt the user with relevant helpdesk documents while they are creating a ticket. It asks if this solved their problem and if they say yes, the ticket is not created. It actually works reasonably well and has even found me an answer sometimes."
And the version that does not, posted in the same thread: "Instead of ignoring documentation, we now have a little chat window that people ignore on their way to get the help desk phone number!" from u/MagillaGorillasHat. Placement in the user's path beats model quality every time.
Practically, that means: intercept during ticket creation, answer in the channel the person is already in (Slack, Teams, email, chat), and instrument which searches return nothing. Atlassian describes that loop well on its knowledge management page: analytics show "which articles get the most use, which searches return no results, and which content successfully deflects tickets." Our guides to AI knowledge base tools, knowledge base chatbots and the benefits of an AI knowledge base cover the tooling; if your knowledge lives in Confluence or Slack rather than a help centre, Confluence AI and Slack AI are the relevant starting points.
Step 5: pick metrics that cannot be gamed
This is the part of help desk management that changes behaviour whether you intend it to or not. The single best description of what a raw ticket-count target does to a team comes from an IT manager who has run one:
"Perverse incentives:
The incentive is close tickets, not fix problems. [...] The more simple, reoccurring problems that continue to exist, the better your stats are. Permanently fixing problems hurts you."
Grab the easiest ticketsDo not assist colleaguesDo not ask colleagues for helpDo not escalate tickets to more capable staffDo not train staff, educated staff won't create easy ticketsUse quick one-off/temporary fixes
Now put that next to a Freshdesk review where an IT engineer praises the same mechanism as a feature: the system "assigns points for resolving tickets and deducts for overdue ones, making everyone eager to be in first place", per a G2 review from a verified user in computer and network security, flagged by G2 as incentivized. One team's perverse incentive is another vendor's gamification module. Neither is wrong about the mechanics; they just disagree about what it produces.
The counter-move is not fewer metrics, it is paired metrics. Every throughput number gets a quality number attached that moves the opposite way when someone games it:
| What you measure | What it tells you | How it gets gamed | Pair it with |
|---|---|---|---|
| Tickets closed per agent | Raw throughput | Cherry-picking password resets, band-aid fixes | Reopen rate, repeat-contact rate |
| First-level resolution | Where cost lands | Closing without resolving, silent escalation | Reopen rate, customer effort |
| Deflection rate | Self-service reach | Counting abandoned sessions as successes | Tickets created after a bot session |
| CSAT | Felt quality | Survey timing, cherry-picked send lists | Response rate, resolution rate |
| Average handle time | Efficiency | Rushing, premature closure | FCR, reopen rate |
| Backlog size | Capacity gap | Bulk-closing aged tickets | Backlog age distribution |
The reopen-rate question is the whole argument in one story:
"I got chewed out once for being at like 75 while everyone else was at 100, and our 'top closer' was at like 150. I asked for the reopen rate. They said 'Don't worry about that, you just need to get your tickets up.'"
Attribution matters as much as choice of metric. In one widely-read thread, management publicly blamed a help desk for more than 100 week-old tickets, and the desk found that "over 80 of them are actually on hold with the Operations team themselves", yet they counted against the desk because the desk had opened them, per u/DrPeppehr. If your reporting attributes age to whoever created a ticket rather than whoever holds it, your backlog metric is measuring the wrong team. The same care applies to CSAT and support analytics: a score you cannot tie to the right conversation is not data.
And in 2026 there is a new favourite vanity metric. The sharpest warning about it came from a sysadmin watching AI dashboards get presented upward:
"The scary part is how easy it is for these products to bullshit metrics for the executives.
Like, put a chatbot in front of the support portal? Wow, it handled 5000 issues this month! 5000 tickets that didn't hit our EXPENSIVE human help desk staff!
Now, only 1 of those interactions was useful and the other 4999 times people had to circumvent the bot to open a ticket, or just gave up and fucked off, but hard to track that, eh?"
The instrumentation fix is simple and someone in the same week's thread named it: always create the ticket, put the answer in the comments, and mark it resolved by the AI. As u/Material-Water-9610 put it, that "keeps real stats clean and provides real feedback on your ai performance." Do that and your deflection rate becomes a measurement instead of a claim.
Where AI actually fits in help desk management now
The adoption numbers are no longer speculative. Salesforce's AI Agents Edition research, a survey of 3,075 service professionals fielded in March and April 2026, reports 85 percent of service organisations using at least one form of AI and agentic AI adoption jumping from 39 to 66 percent year over year, with 70 percent seeing measurable value within 60 days.
The operator sentiment is much more mixed, and the honest version of this section has to include both sides. The highest-voted comment in the biggest 2026 thread on the subject is blunt: "Nobody actually wants AI service desks. Not us, not the users. The only ones pushing for them are CEOs and IT leads who think they'll save soooooooo much money", from u/8008seven8008.
In the same thread, a sysadmin at a shop where help desk is a side job reported the opposite: "We rolled it out in February of this year and so far according to the dashboard, our need for intervention has declined by 73%. The people know they're being answered by AI but they don't care because the AI responds instantly", per u/jakgal04. Another put a more modest 20 percent ticket cut on a password-reset and account-basics deployment.
What separates those outcomes is not the model. It is three things, and the best one-line statement of the first came from a sysadmin doing AI routing in production: "What they don't want is to be blocked from accessing a human for help [...] It's a service desk, which implies service", per u/jaank80.
- A working handoff. The same bot, before and after its human-escalation option was removed, went from "worked great" to routing people in circles. Design the escalation path first, per our handoff practices.
- Knowledge that can answer. One admin whose CIO bought an AI service desk warned that unless documentation and the service catalogue are dialled in, "more than half the AI answers will be bad or generic", in a production-AI thread.
- Confidence routing. The AI should handle what it is confident about and leave the rest alone. Every serious buyer I speak to raises this before pricing.
That third point is the one I have the most scar tissue on. In eesel's earlier days, paying customers' bots fabricated answers to real customers when knowledge retrieval came back empty: one energy company's bot invented subscription claims about solar cells, another answered a customer question with "Oxygen" from the periodic table. An AI that guesses when it does not know is worse than no AI, because it converts a two-minute ticket into a trust incident. That is exactly why simulation against historical tickets comes before go-live now, and why confidence thresholds are a first-class setting rather than an advanced one.
A CX lead at a supplements brand running about 7,000 tickets a month on Gorgias and Shopify said the same thing from the buyer's chair:
"The AI will never be able to answer 100% of the questions, but if it tries and just answers 'sorry I don't know this,' I cannot go and check all my 7,000 tickets to see if the AI actually made a good answer - then the point is a little bit gone. I need an AI who is only handling the tickets that it's confident to handle and all the other ones, leave them alone."
Set up that way, the results are measurable rather than magical. On one real-traffic trial of about 1,000 tickets a month at an e-commerce company, we measured 93 percent triage accuracy, 100 percent spam detection with no false positives on an inbox that was 22 percent spam, and a 7 percent factual error rate on drafts. The failure modes were mostly boring: roughly 65 percent of draft rewrites were length or tone, not fact. That is the kind of number to ask any vendor for, including us.
Two more from named customers. Gridwise, a gig-economy driver analytics app, reported resolving 73 percent of tier-1 requests in its first month after a seven-day trial, and Jason Loyola, Head of IT at InDebted, uses it on an internal Jira desk: "We use it to be the first responder to our Helpdesk tickets in Jira. It essentially acts just like an agent would", with deflection at 15 percent and a 55 percent target. Note the honest gap between those two numbers; internal IT desks with messy service catalogues ramp slower than a clean e-commerce queue, and any vendor quoting you one number for both is selling.
If you want to go deeper on the automation layer specifically, we have separate guides to AI ticket triage, automated ticket resolution, AI-powered ticketing, IT help desk AI, automated IT ticketing, agents versus chatbots, coaching an AI agent and AI escalation strategy.
The operating cadence I would actually run
Help desk management is a weekly habit, not a quarterly project. This is the rhythm I would put in place on day one:
Weekly. Read the top ten repeat questions by volume and ask what would have prevented each. Check reopen rate alongside closure counts. Check backlog age distribution, not backlog size. Look at every AI conversation that ended without resolution, not the ones that went well.
Monthly. Recompute utilization against handle time (the calculator above does it in ten seconds). Review first-level resolution by category and find the one category leaking escalations. Audit the five most-viewed knowledge articles for accuracy, and the top ten zero-result searches for gaps.
If you run an internal desk rather than a customer-facing one, the same cadence applies with a different vocabulary; our AI service desk guide and the roundup of AI helpdesk software map the tooling onto it.
Quarterly. Re-baseline SLAs against what you actually deliver rather than what you promised. Rotate agents through the escalation queue so knowledge does not silo. Re-simulate your automation against the last quarter's real tickets, because your product changed and your AI's answers did not.
One warning from watching a lot of rollouts stall: the most common failure is not a bad model or a bad process document. It is the last mile. Teams configure an agent perfectly and never wire the trigger that lets it see real tickets, so it never runs. Whatever you are rolling out this quarter, book the go-live step in the same calendar entry as the setup.
Try eesel for help desk management
If your queue looks like the one at the top of this post, mostly the same questions, mostly at the wrong level, eesel is the layer that takes the repetitive part. It plugs into the helpdesk you already run (Zendesk, Freshdesk, Jira Service Management, Gorgias, HubSpot, Slack, email), trains on your past tickets and existing docs, and starts as a first responder that drafts or resolves what it is confident about while leaving everything else for your team. Because it is priced per ticket rather than per seat, the cost moves with volume instead of with headcount, which matters when your Black Friday is four times your baseline.
The part I would test first: point it at your last quarter of real tickets in simulation, and read what it would have said before a single customer sees it. That is a fifteen-minute answer to the question everyone actually has, which is not "does AI work" but "does it work on my queue."
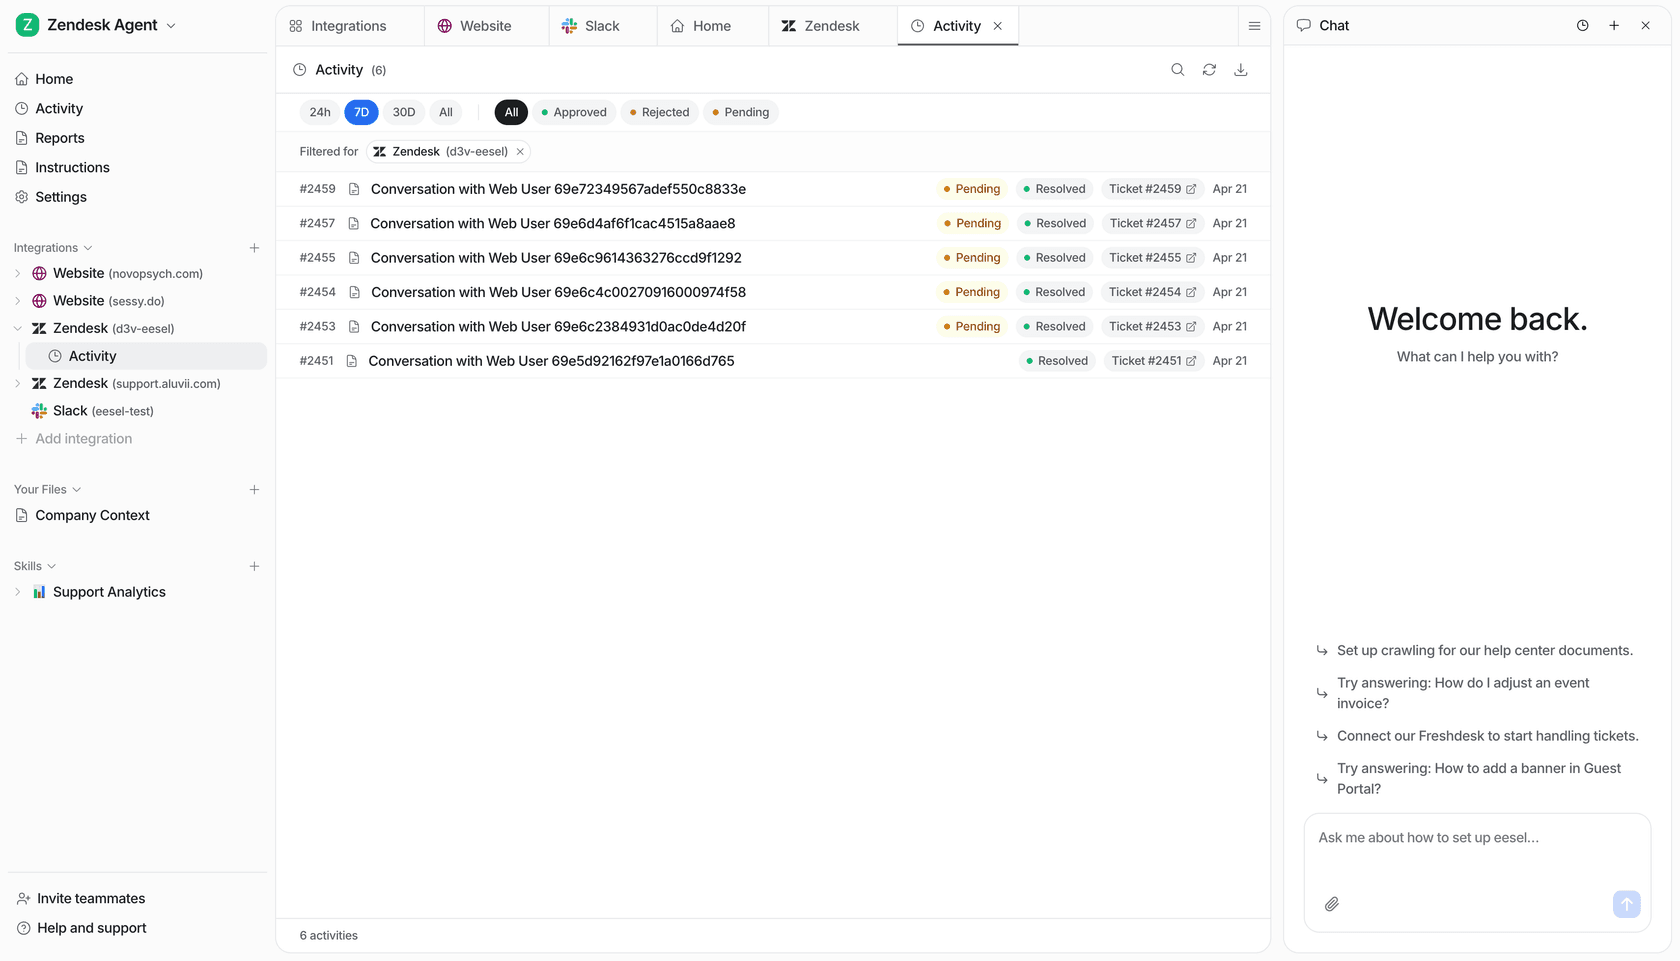
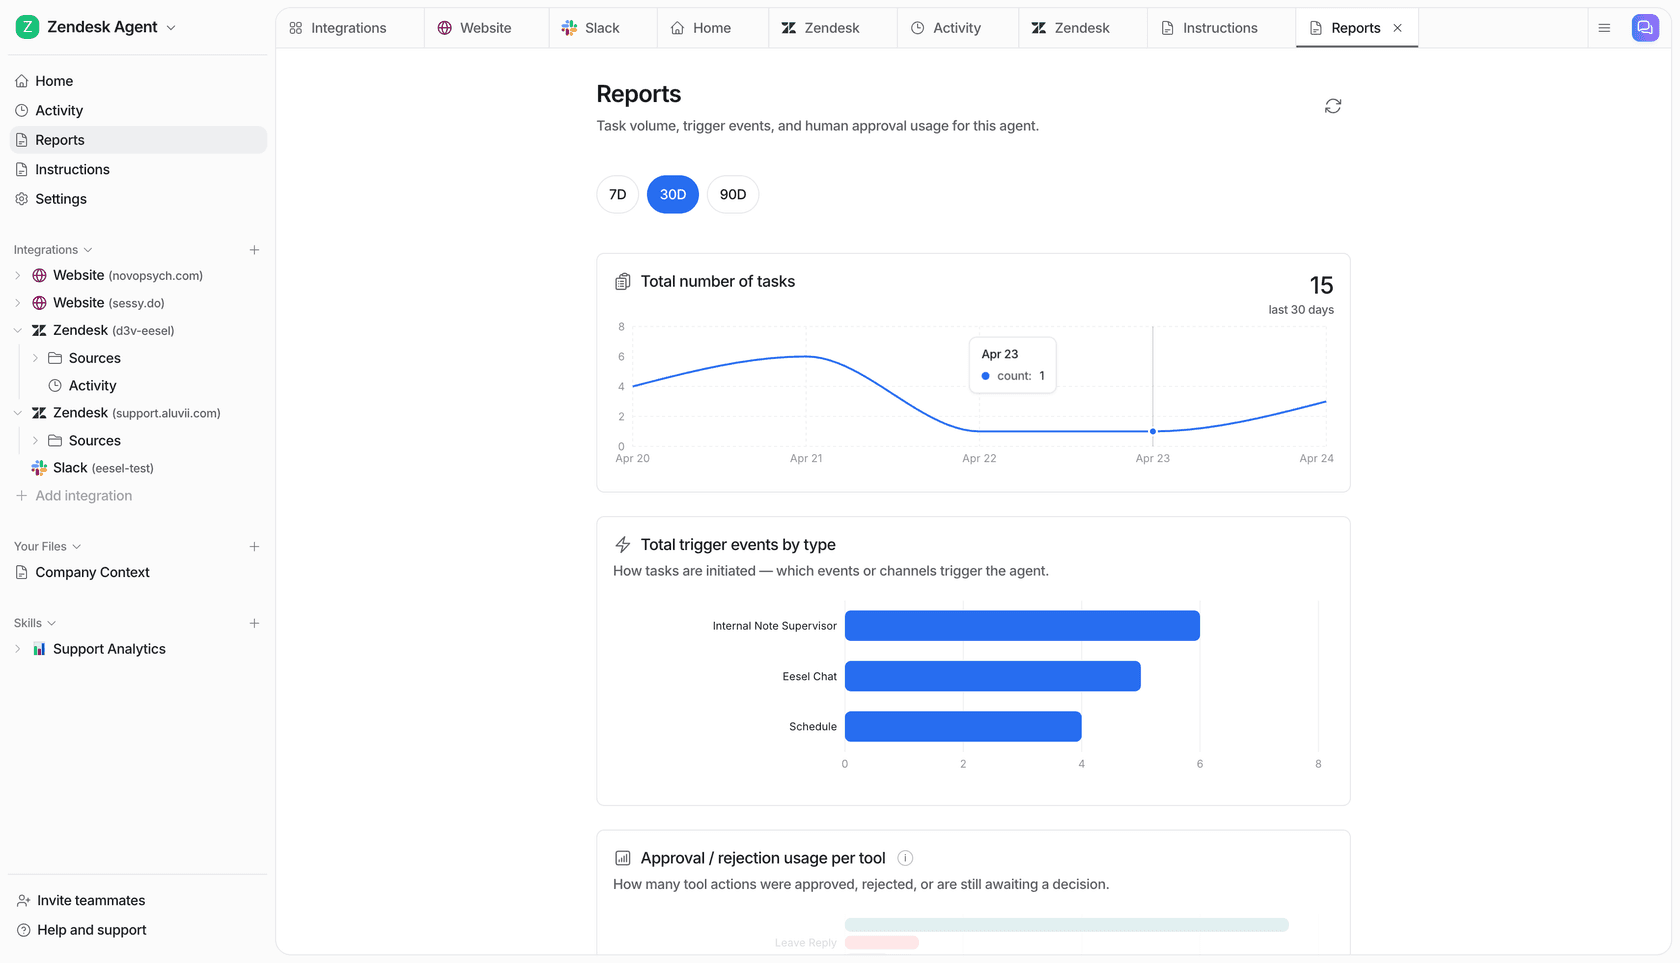
You also get the reporting that most outsourced or bolted-on options do not: a ledger of what was handled, what was escalated, and where the AI declined to answer. Start with eesel free, or read the honest head-to-head with Zendesk AI if you are weighing the native option, and our breakdown of AI versus human agent cost if you are building the business case.
Frequently Asked Questions
What is help desk management?
What does a help desk manager actually do day to day?
Which help desk management metrics actually matter?
How many agents do I need per ticket volume?
How much does help desk management software cost?
Can AI replace a help desk team?
How do I improve help desk management without hiring?
What is the difference between a help desk and a service desk?


Article by
Alicia Kirana Utomo
Kira is a writer at eesel AI with a Computer Science background and over a year of hands-on experience evaluating AI-powered customer service tools. She focuses on breaking down how helpdesk platforms and AI agents actually work so that support teams can make better buying decisions.