


Front's task analytics are three metrics, new tasks, resolved tasks and task resolution time (average), announced on April 30, 2026 and extended in October to teammates, inboxes and tags. They appear in four reports, but resolved tasks and resolution time only count tasks in a shared inbox with ticket statuses on, and the plan you need depends on the report.
eesel helps on the tag side, since Front's by-tag table is only as clean as your tags. With the eesel CLI, an AI coding agent can upload your approved tag guide and test tagging answers on sample conversations before anything goes live. Connecting Front itself still needs someone with admin access.
What are Front task analytics?
They are the reporting layer for Front tasks, the internal action items you create on their own or from a conversation. Since the April 30, 2026 update, Front reports on the tasks themselves, not only on conversations and replies.
Front's own summary says the metrics let you track task volume and resolution efficiency, and "spot bottlenecks and measure how quickly your team closes out work." That is a real gap closed. If your team splits a customer request into a linked task for legal, finance or a manager, the original conversation can look fast while the task sits for days. Now you can see the second number.
I build AI agents at eesel, and the thing I would flag early is scope. These are volume and time metrics. They tell you how many tasks arrived, how many closed and how long closing took. They do not tell you whether the work was good.
Which task metrics does Front track?
Three. Each has its own page in Front's analytics glossary, and the definitions are short.
| Metric | What Front says it counts | Shared inbox with ticket statuses needed? |
|---|---|---|
| New tasks | Total new tasks created in the selected time period | Glossary FAQ says n/a |
| Resolved tasks | Total tasks resolved in the selected time period | Yes, per the glossary FAQ |
| Task resolution time (avg) | Time from a task's creation to its last resolution, with business hours and shifts taken into account | Yes, per the glossary FAQ |
Front's report articles also list a fourth name, Task time in ticket status, marked "coming soon" in the Team performance and Resolution reports. Its glossary link returned a "page not found" when I checked, so treat it as unreleased.
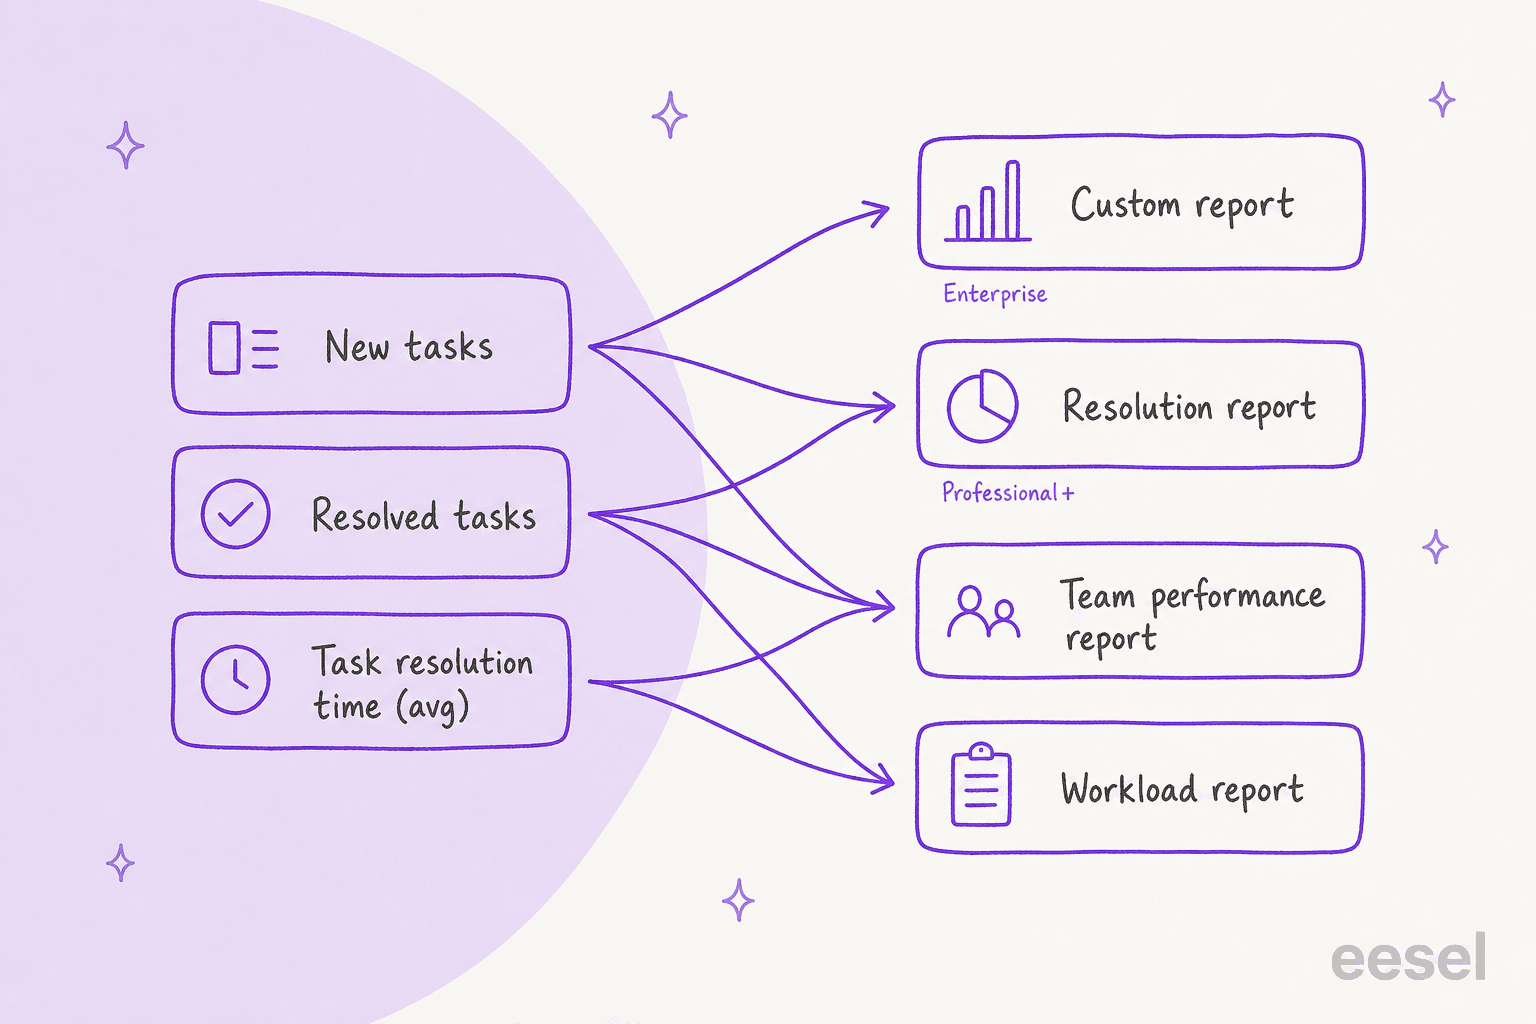
Where do I see task metrics in Front?
In four places. The glossary pages list the exact chart or table for each, which is more detail than the reports' own overviews give.
| Report | Where the task metrics sit | Plan, per Front's help center |
|---|---|---|
| Workload report | Key metrics chart, Workload over time graph, Workload by inbox table | All latest plans |
| Team performance report | Key metrics chart, Team performance table | All latest plans |
| Resolution report | Resolution by tag table | Professional or above |
| Custom report | Line chart, Key metrics chart | Enterprise only |
The Workload report is the one I would open first. Its Workload over time graph lets you click Compare and choose Group by inbox (top 5) or Group by tag (top 5), which is the quickest way to see whether one inbox or one tag is hoarding tasks. The Workload by inbox table puts new and resolved tasks next to conversation counts, which is where you spot an inbox whose tasks pile up faster than they close.
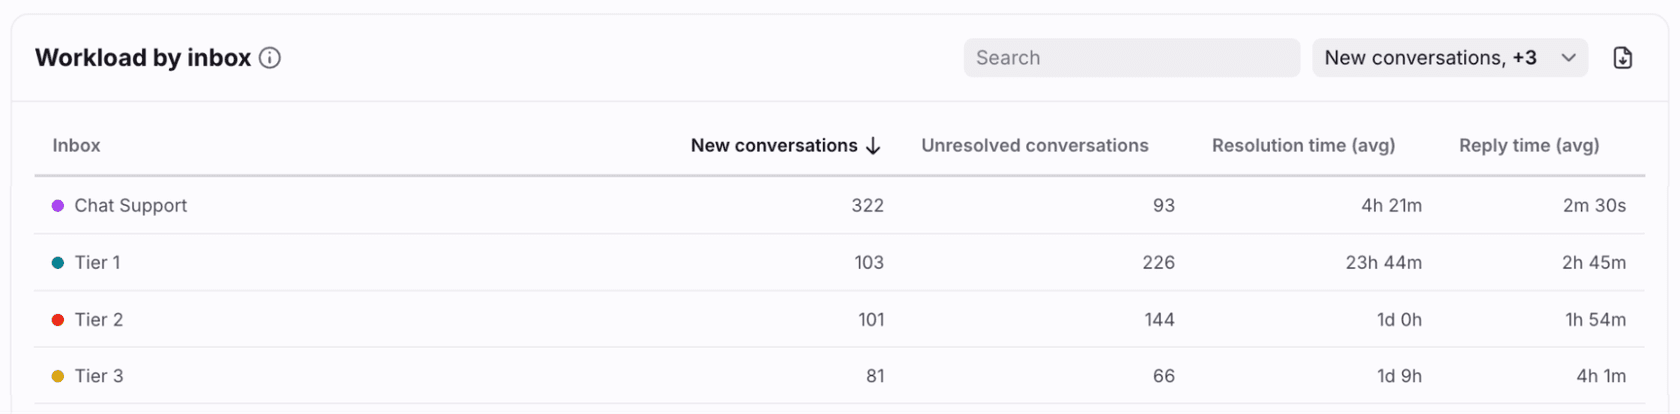
That screenshot is Front's own example data and shows conversation metrics. Per the Workload article, the same table's metric dropdown includes new tasks, resolved tasks and task resolution time.
Which plan do I need?
It depends on the report, and Front's own pages do not line up perfectly, so here is how I read them. The Workload article and the Team performance article say the feature is on all latest plans. The Resolution report article says Professional or above. The custom report article says Enterprise only.
Front's analytics FAQ adds two limits that matter for task trends. Starter has limited analytics access, and history is capped: Starter 6 months, Professional 24 months, Enterprise and some legacy plans all historical data. Front's pricing page lists Starter at $25, Professional at $65 and Enterprise at $105 per seat per month billed annually, which I last checked on November 4, 2026. My Front pricing guide has the full tier breakdown.
If you want the by-tag task table, that is a Professional purchase. If you want a personal dashboard that mixes task charts with other metrics, it is Enterprise.
Why is a task missing from my numbers?
Almost always the inbox. Front's glossary FAQ for resolved tasks and task resolution time says the task must be in a shared inbox with ticket statuses enabled. A standalone task in your personal Tasks section is not in a shared inbox, so by that rule it is not counted, a task outside a shared inbox does not meet it.
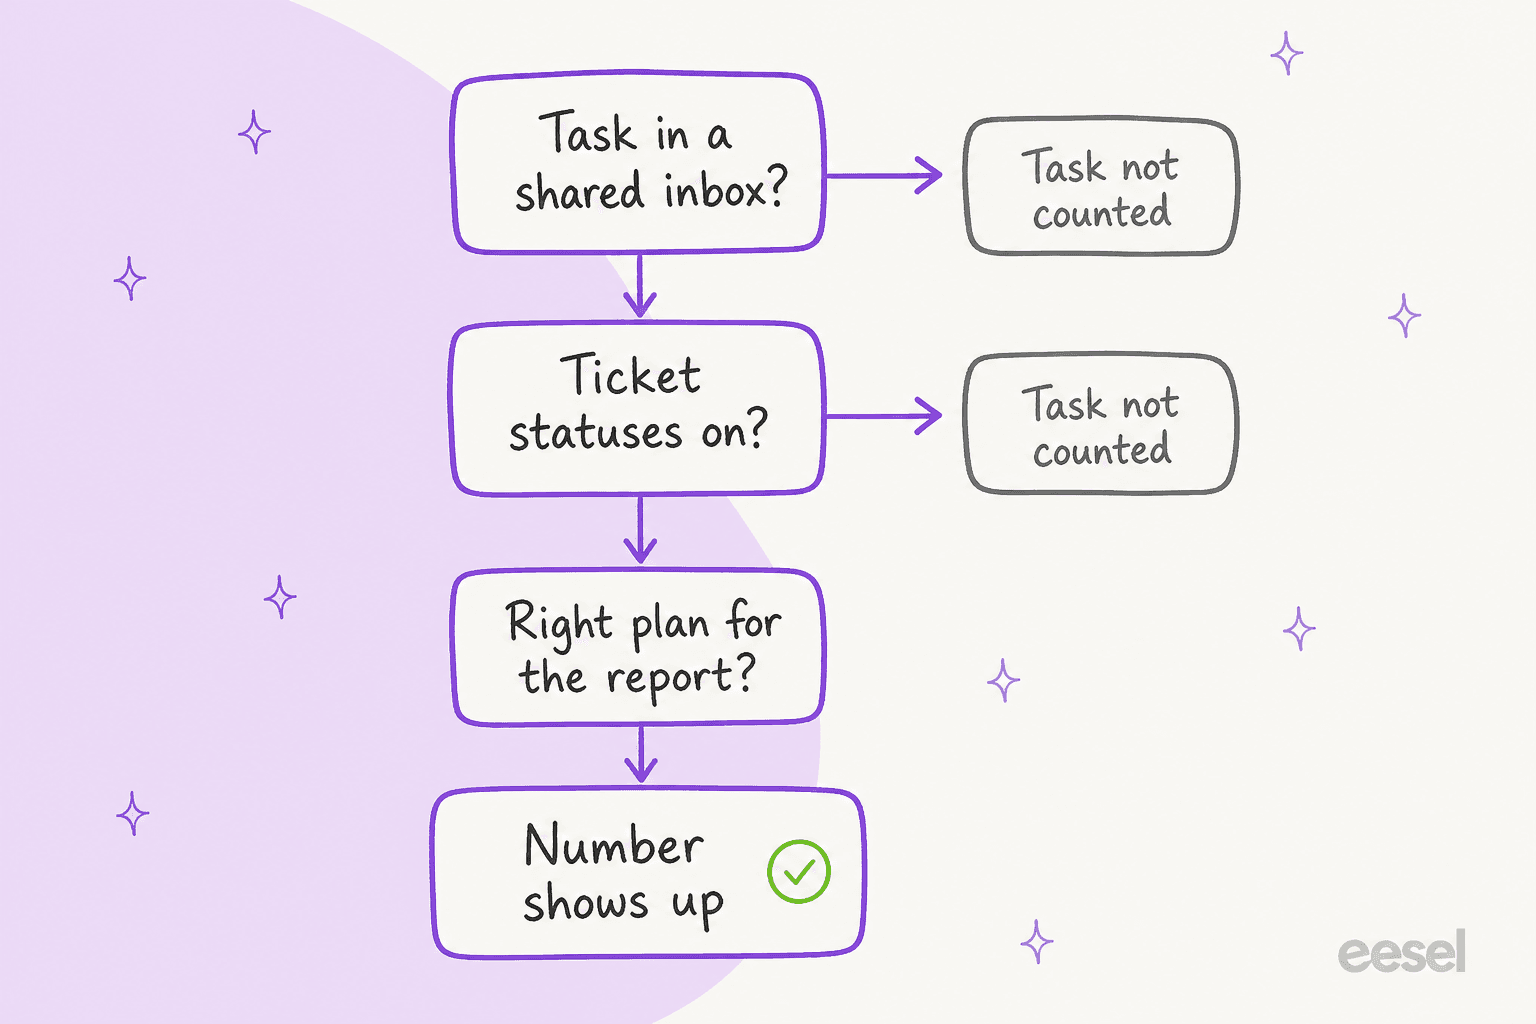
Run through the three questions in that order. If your inbox does not have ticket statuses on, Front ticket status rules walks through turning them on. Two other things trip people up. Front's Navigating Analytics article says reports show "Data from up to 2 hours ago", so a task you closed a minute ago will not be in the chart yet. And workspace analytics need an admin: non-admins see only their individual analytics.
How is task resolution time measured?
From the moment the task is created to its last resolution, in business hours and shifts. That "last" matters. The definition reads as if a task closed more than once is measured to its final close, though Front does not spell out a reopen case. I would test it on a throwaway task before relying on it.
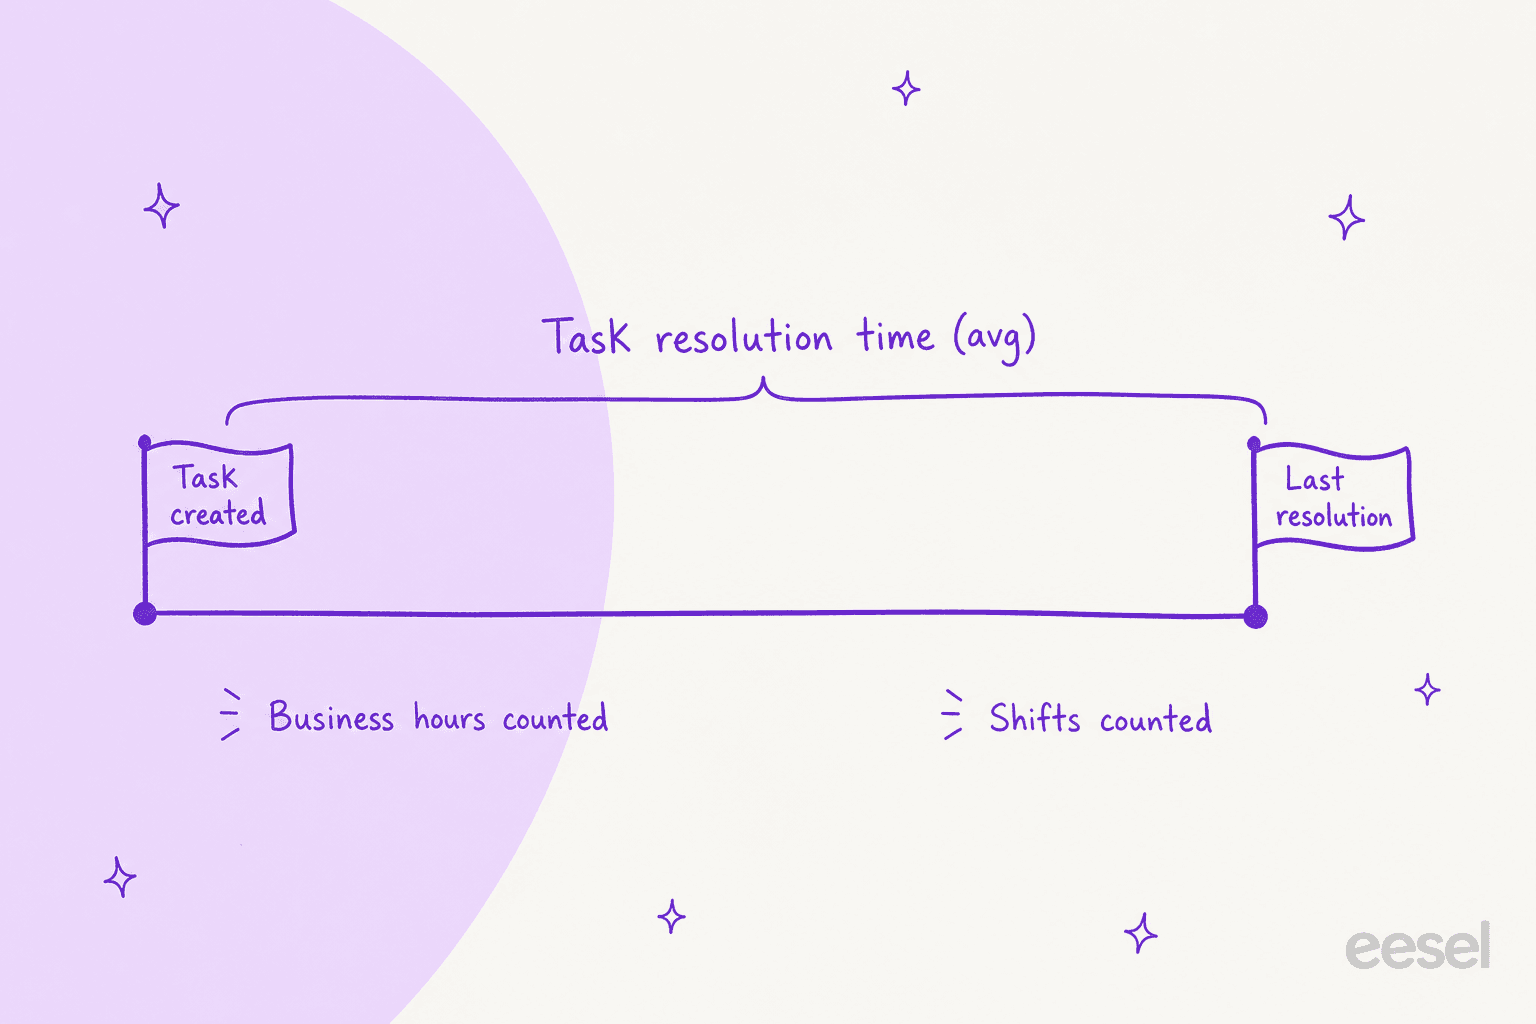
The business-hours part is easy to miss. A task created Friday at 5pm and closed Monday at 9am does not log a 64-hour wait if your schedule is weekdays only. It is the same logic as Front's conversation resolution time, so compare the two with care. A task time that looks short next to a long first response time usually means customers wait on a reply while internal work moves fine, and the reverse means the reply is quick but the follow-up task is the drag.
How do I slice task metrics by tag, inbox and teammate?
Front's October 2026 update says task metrics can now be seen across teammates, inboxes and tags. The help center maps each cut to a table:
- By teammate: the Team performance table in the Team performance report.
- By inbox: the Workload by inbox table in the Workload report.
- By tag: the Resolution by tag table in the Resolution report.
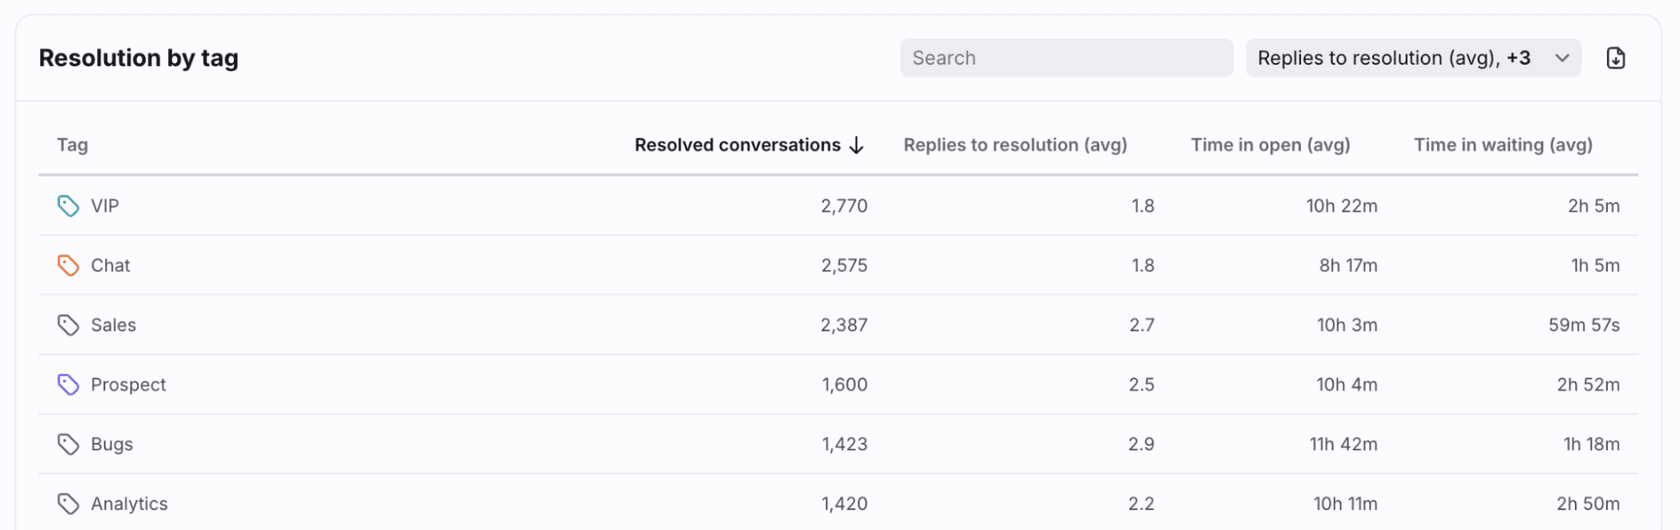
The tag cut is the most useful and the most fragile. Front's example shows conversation metrics by tag such as VIP and Bugs; add the task metrics from the dropdown and you can see which kind of work produces slow tasks. But a by-tag table only answers questions if tags are applied the same way every time. Front's tag filter also behaves in ways that surprise people: by default it shows conversations that currently include a selected tag, and you can switch it to tags a conversation ever had.
smava shows what consistent tagging looks like in practice, on Zendesk rather than Front. Its eesel categorisation agent runs on every new ticket and comment, and between 8 August and 8 September 2026 eesel handled about 27,000 tickets and categorised about 14,600 of them. Front has no customer story I can cite, so read that as the same job on another helpdesk, not proof for Front. For the method, see AI ticket classification and automating ticket triage.
How would I run a weekly task review?
Here is the routine I would try, built only from features in Front's docs. It takes about 15 minutes once the views are saved.
- Open the Workload report and compare new against resolved tasks. Group by inbox (top 5). If new tasks beat resolved tasks for several weeks in one inbox, its task queue is growing, which is the task version of a ticket backlog.
- Open the Resolution by tag table. Add task resolution time and sort. The slowest tag is where tasks stall, such as refunds waiting on finance.
- Check Team performance. Use the table to see whether tasks spread across people or collect on one teammate. Pair it with Front load balancing if assignment is the cause.
- Click into a metric. Front says each metric opens its details and the list counted in it, so you can read the actual tasks behind a bad average.
Averages hide outliers, so I would read step 4 before acting on step 2. For wider benchmarks on what to track, see my customer service KPIs guide. My AI for support reporting post goes further, and a dashboard template gives a starting layout.
What do Front's task analytics not tell you?
Quite a bit, and some of it is what a manager would ask first.
- No overdue-task metric. In the metric lists of the Workload, Team performance, Resolution and custom report articles I found none. Overdue appears only for reply time goals, which Front time goal rules covers.
- No quality signal. Three counts and an average say nothing about whether a task was done well or the customer was satisfied. Pair them with CSAT.
- No rollup to the parent request. Front does not document a view that sets a task's time against the original conversation's total. Linked-task basics are in my Front linked conversations post.
- Averages only for time. The time metric is an average, and Front does not document a median or percentile for tasks.
- Latency. Data is up to two hours old, so this is for weekly review, not live queue control.
What do Front's docs disagree on?
Four things I would confirm in your own workspace before building a process on them.
- Ticket statuses for new tasks. The resolved-tasks and resolution-time glossary pages say a shared inbox with ticket statuses is required. The new-tasks page lists FAQ "n/a". The reports' ticket-status footnote does not name task metrics at all.
- Plan for the by-tag table. The Workload and Team performance articles say all latest plans; the Resolution report says Professional or above. The analytics FAQ says all latest plans with Starter limited. Front's pricing page lists "advanced analytics" under Professional and custom reports under Enterprise.
- Custom reports. The help center article still carries an open beta banner, while listing the three task metrics and an Enterprise-only plan note.
- Scope. The April announcement says "in shared inboxes". The October update says teammates, inboxes and tags. I read these as one feature widening, not two.
How does eesel fit with Front reporting?
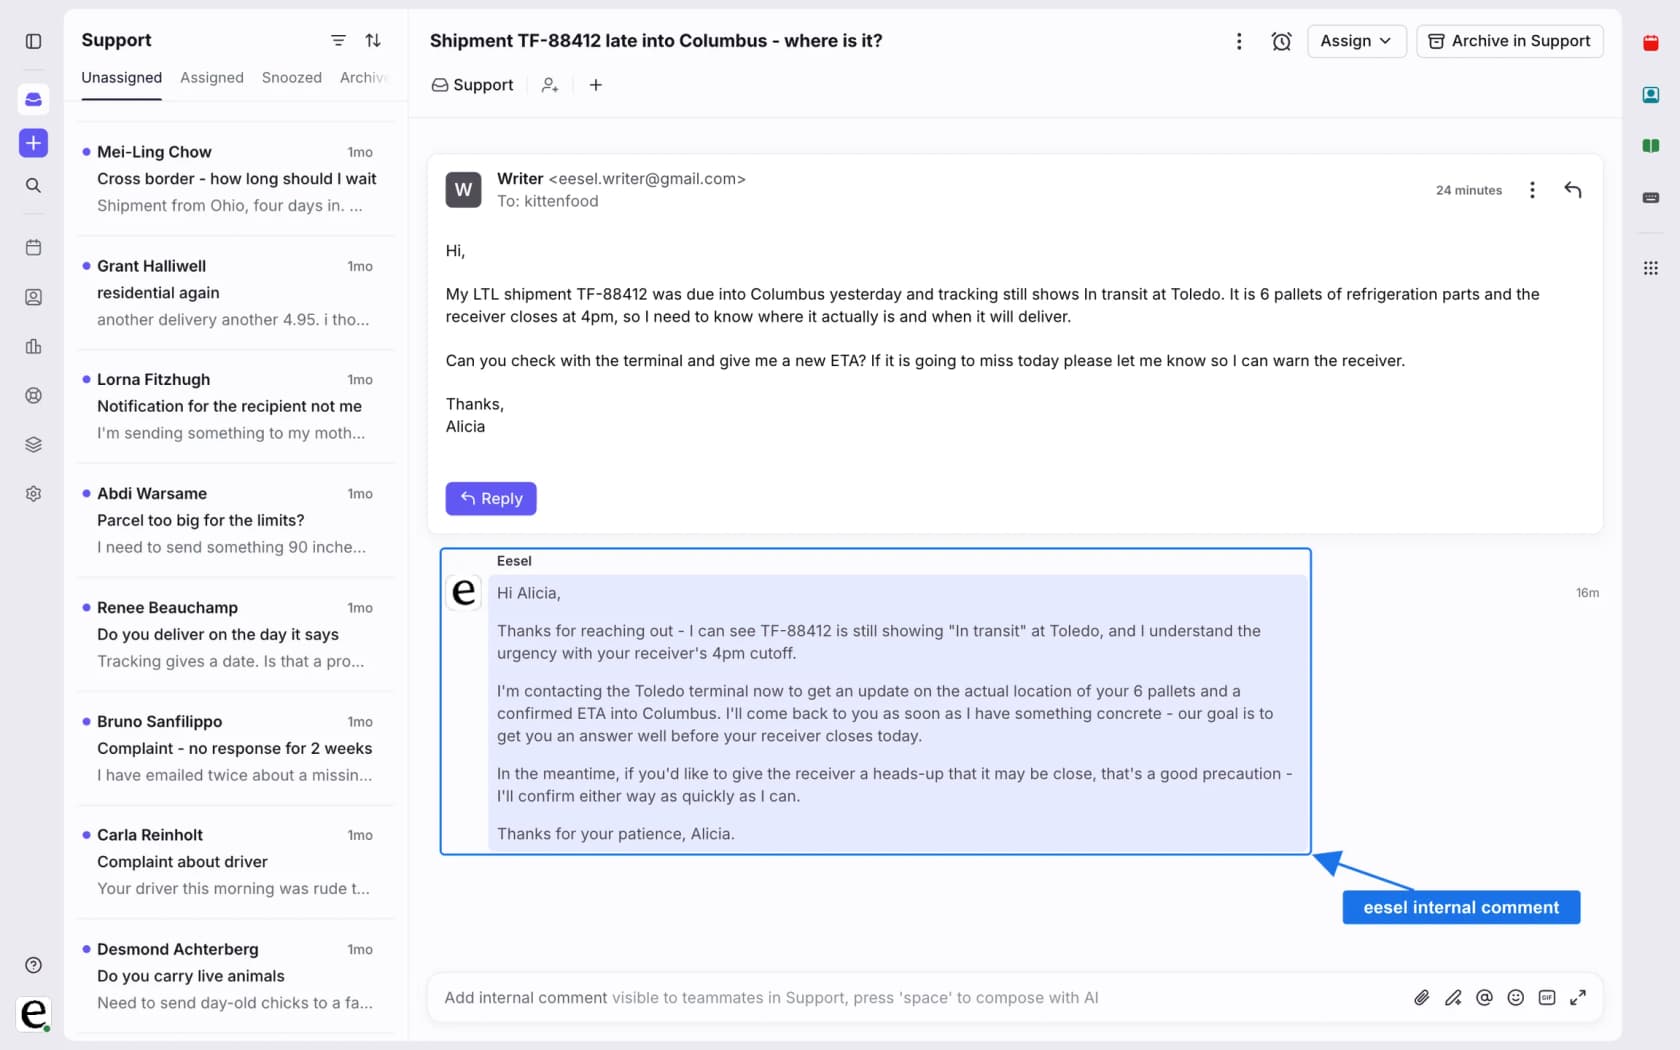
On the input side, not the report side. eesel does not change what Front counts. What it can do is keep the tags that Front groups by consistent. eesel's Front integration lists adding tags, internal comments, assignment and field updates among its actions, and it reads your help center and past conversations to decide. I did not find a task-creation action in those docs, so a Front rule still owns that step.
That makes the Resolution by tag table more honest. If a teammate would tag a conversation Refund and eesel does the same, the task times under Refund mean something. Start in draft mode, check a sample of tags against what a person would pick, and keep a human in the loop until they agree. For a tool-by-tool view, see best AI for Front.
Front has its own route to similar groupings too. My Front AI analyze topics post covers it, and the Front AI overview covers the wider set of AI features. If you are weighing helpdesks on reporting depth, Front alternatives is the comparison.
Try eesel in your Front inbox
If your by-tag task numbers feel noisy, the fix usually starts at the tag, and eesel is built for that step in Front. It reads your help center and past conversations, tags what comes in from the list you already use, and can leave a draft as an internal comment, so the Resolution report groups work the way your team would. Start with comments and tags only, compare a week of its tags with a person's, then widen it.
For setup, see my guide to adding AI to Front and the Front vs eesel comparison. Try eesel on a few real conversations before deciding.