

What customer service tracking software actually means
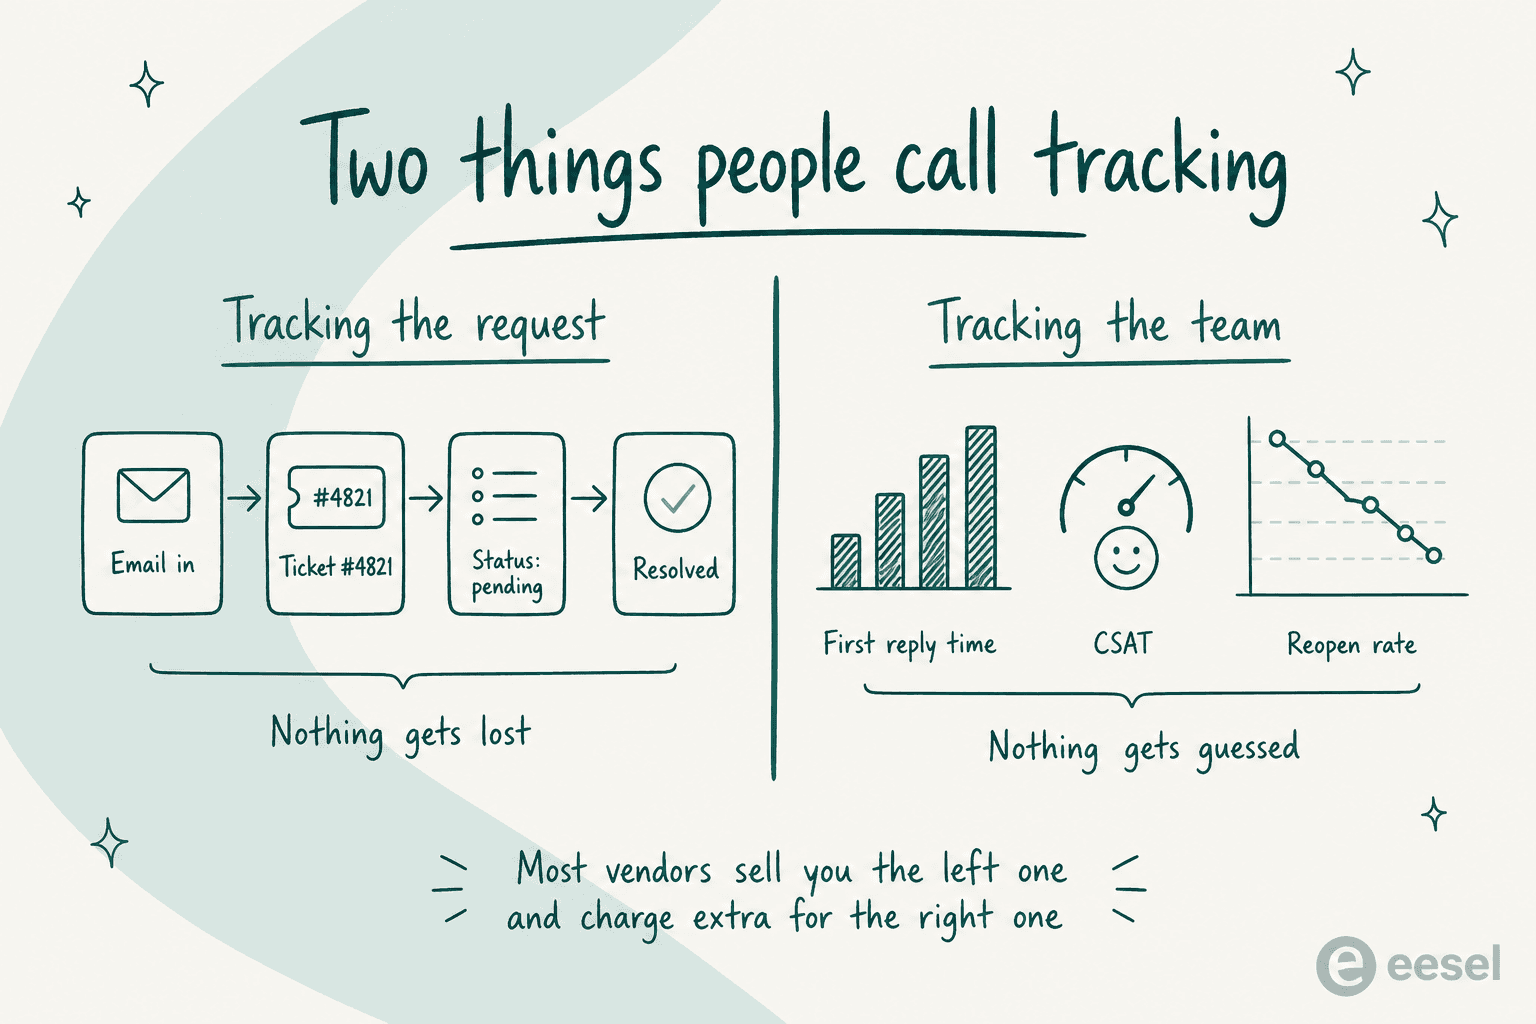
The phrase covers two jobs that get sold as one product, and knowing which one you are shopping for saves a lot of money.
The first job is tracking the request. An email arrives, it becomes a numbered item with an owner and a status, and it stops being possible to lose it in someone's inbox. That is the ticketing system part, and every tool in this roundup does it competently. Nobody has failed at this since about 2012.
The second job is tracking the team. How long the average customer waits for a first reply, whether Tuesdays break you, which agent is quietly carrying the queue, what your satisfaction score did after the pricing change. This is the reporting layer, and it is where the products diverge wildly, both in what they can do and in what they charge for it.
Worth naming what is out of scope. This is not the same list as my roundup of AI customer service tools, which is about automating the work rather than measuring it, and it does not cover internal IT ticketing, where the buying logic runs through asset management and change control instead.
The part nobody prices in: your metrics are a plan gate
Here is the thing I did not expect when I started pulling every vendor's help center for this piece. The gap between tools is not really a feature gap. Almost all of them can produce a first reply time chart. The gap is which plan lets you produce it, and the answer is usually one tier above the one the pricing page nudged you toward.
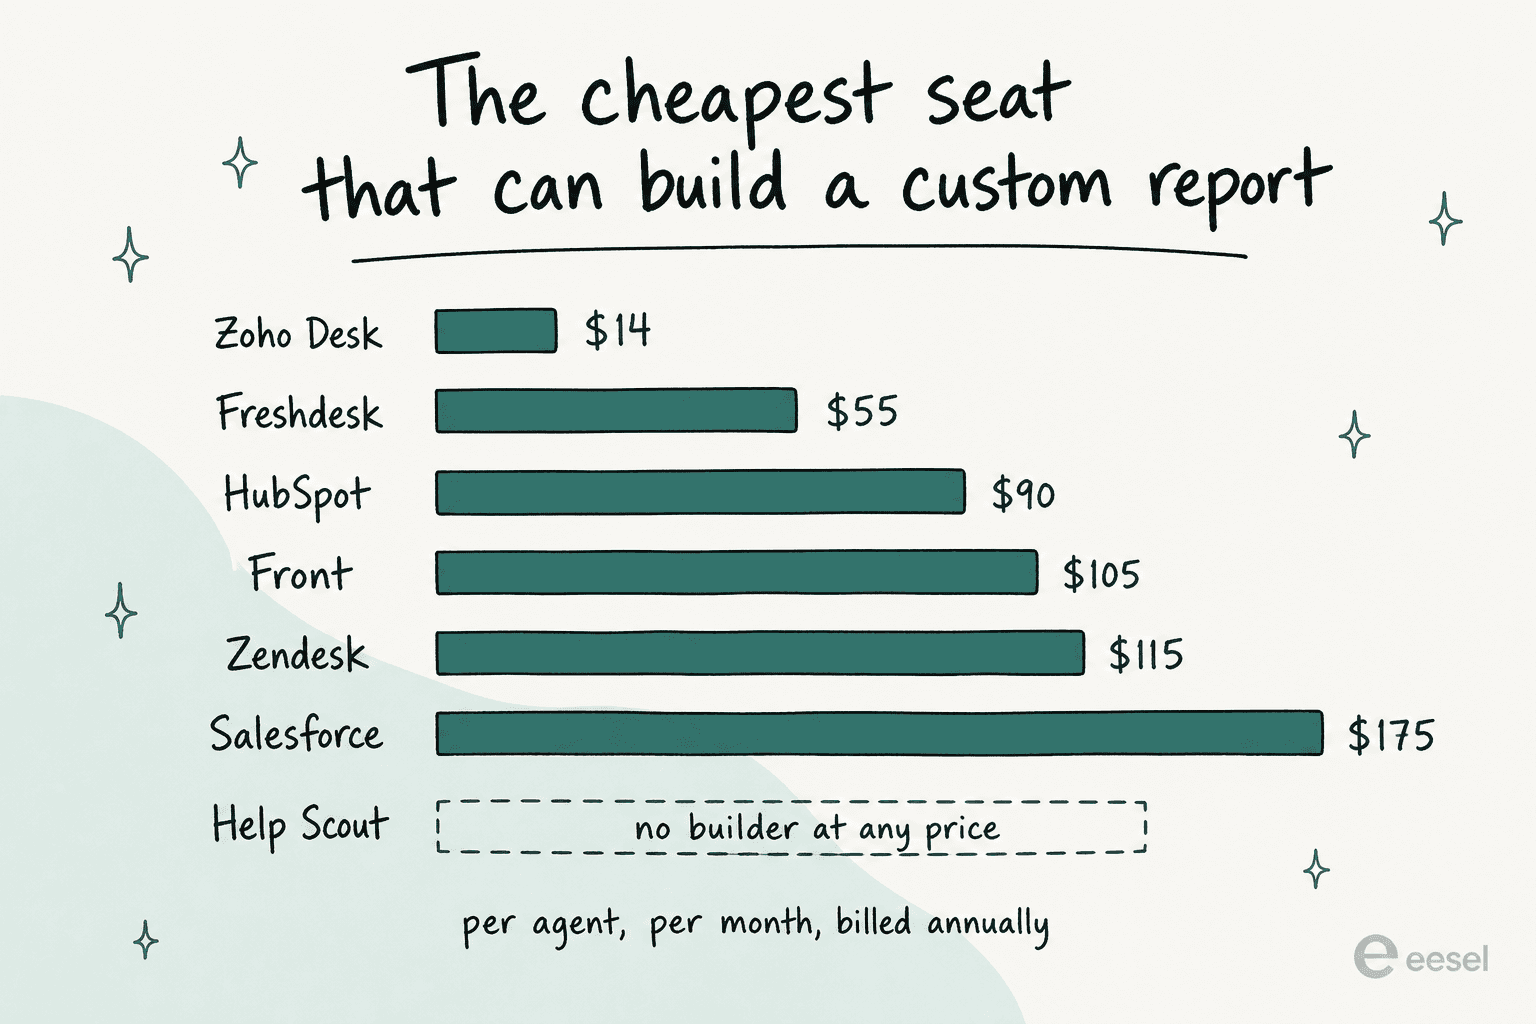
Zendesk is the clearest case. A Suite Team seat at $55 gets you Explore Lite, which is prebuilt dashboards and nothing you can author yourself. Custom reports arrive with Explore Professional, which only ships with Suite Professional at $115. That is a $60 per agent per month step up to build your own report. On a fifteen-person team that is $10,800 a year, spent entirely on the ability to answer your own questions.
Then there is the detail that made me sit up. Zendesk's AI agent reporting dashboard is available on every single plan, Team included, and refreshes hourly. The dashboard that measures your humans is a paid upgrade; the dashboard that meters your AI consumption is free on all of them. That is not a conspiracy, it is just billing: AI agents are charged per automated resolution, so the meter has to be visible. Still, once you see it you cannot unsee it.
Operators feel this even when they cannot name it:
"I dislike that everything is an add-on. You have to purchase everything individually and it can get quite pricy. There are items like real-time reporting that should be included from the get-go but you have to pay to add it one. It feels like they just want to sell you another product rather than putting together plans that make sense for businesses."

And the second wall, once you are past the paywall, is usability. Reporting tools are the least loved software in support:
"I have never found anything as complex as Zendesk explore. I've worked with ThoughtSpot building dashboards, reports and exports but omg Zendesk, you are taking so much of my time!!!!!!!! I have the most basic set up on Zendesk ever but the Explore setup is BREAKING ME."

To be fair to Zendesk, the top comment on that same thread pushes back, and it deserves the airtime: one admin says Explore is "more robust than any other ticketing system reporting tool I've personally ever seen," after taking a couple of weeks to learn it. Both things are true. The tool is powerful, and it costs you a fortnight before it gives anything back.
Which plan unlocks the metric you need
Pick the thing you actually need to measure and see the cheapest plan at each vendor that will let you do it. Prices are per agent per month on annual billing unless the tool bills per ticket.
How I compared these nine
I write about search and buying intent for a living, which mostly means I read a lot of pricing pages and notice when the answer a buyer wants is not on them. That is exactly what happened here, so the rules were:
- Help center over marketing page. Every pricing page in this category renders its reporting rows as a collapsed accordion. The real gates live in the vendors' own help documentation, dated and versioned, so that is what I quoted.
- Live prices only. Every dollar figure was pulled from the vendor's own pricing page on 29 July 2026.
- The gate gets named. If a report exists but needs a higher tier, I say which tier and what the jump costs.
- Real product UI. Every tool below shows an actual screen, not a marketing render.
- User voice with a permalink. Every quote links to the thread or review so you can read the rest yourself.
What I did not do is score them out of ten. A tool that fits a 400-ticket Shopify store is a bad fit for a 40-agent B2B queue, and the reverse.
Customer service tracking software compared at a glance
Read the third column first. The entry price tells you what it costs to start; the custom-report column tells you what it costs to actually learn something.
| Tool | Entry seat price | Custom reports from | Reporting history | SLA reporting from | Real-time view | Raw export from | Best for |
|---|---|---|---|---|---|---|---|
| eesel AI | No seat fee, $0.40/ticket | Included | 7, 30 and 90 day views | Rides your helpdesk | Activity log | API and dashboard | Measuring AI on your current helpdesk |
| Zendesk | $19 Support Team | $115 Suite Professional | Effectively unlimited | Suite Growth | $115, retires Jan 2027 | Growth, off by default | Deep analysis with an admin to run it |
| Freshdesk | $19 Growth | $55 Pro | 2 years on Growth, unlimited on Pro | Growth (one policy) | None on any plan | $55 Pro | Buyers who want the gates published |
| Gorgias | $40/mo Starter | Every plan | No published cutoff, 365-day queries | Every plan | Every plan | Every plan | Shopify teams who hate paywalls |
| Zoho Desk | $7 Express | $14 Standard | Not published | $23 Professional | Not published | $14 Standard | The cheapest real reporting |
| HubSpot | $7 Starter | $90 Professional | Not published | $90 Professional | Dashboards on all tiers | $90 Professional | Tracking support against revenue |
| Help Scout | Free for 5 users | Not available | 30 days free, 2 years, all-time | $25 Standard | $25 Standard | $45 Plus | Small teams who want simple |
| Front | $25 Starter | $105 Enterprise | 6, 24 months, all history | $65 Professional | $65 Professional | $105 Enterprise | Cross-team work with shared inboxes |
| Salesforce | $25 Starter Suite | $175 Enterprise | Not published | $175 Enterprise | Enterprise | Pro Suite plus $25 | Enterprises already on Salesforce |
1. eesel AI
Best for: measuring what an AI agent actually did, without moving off the helpdesk you already track in.
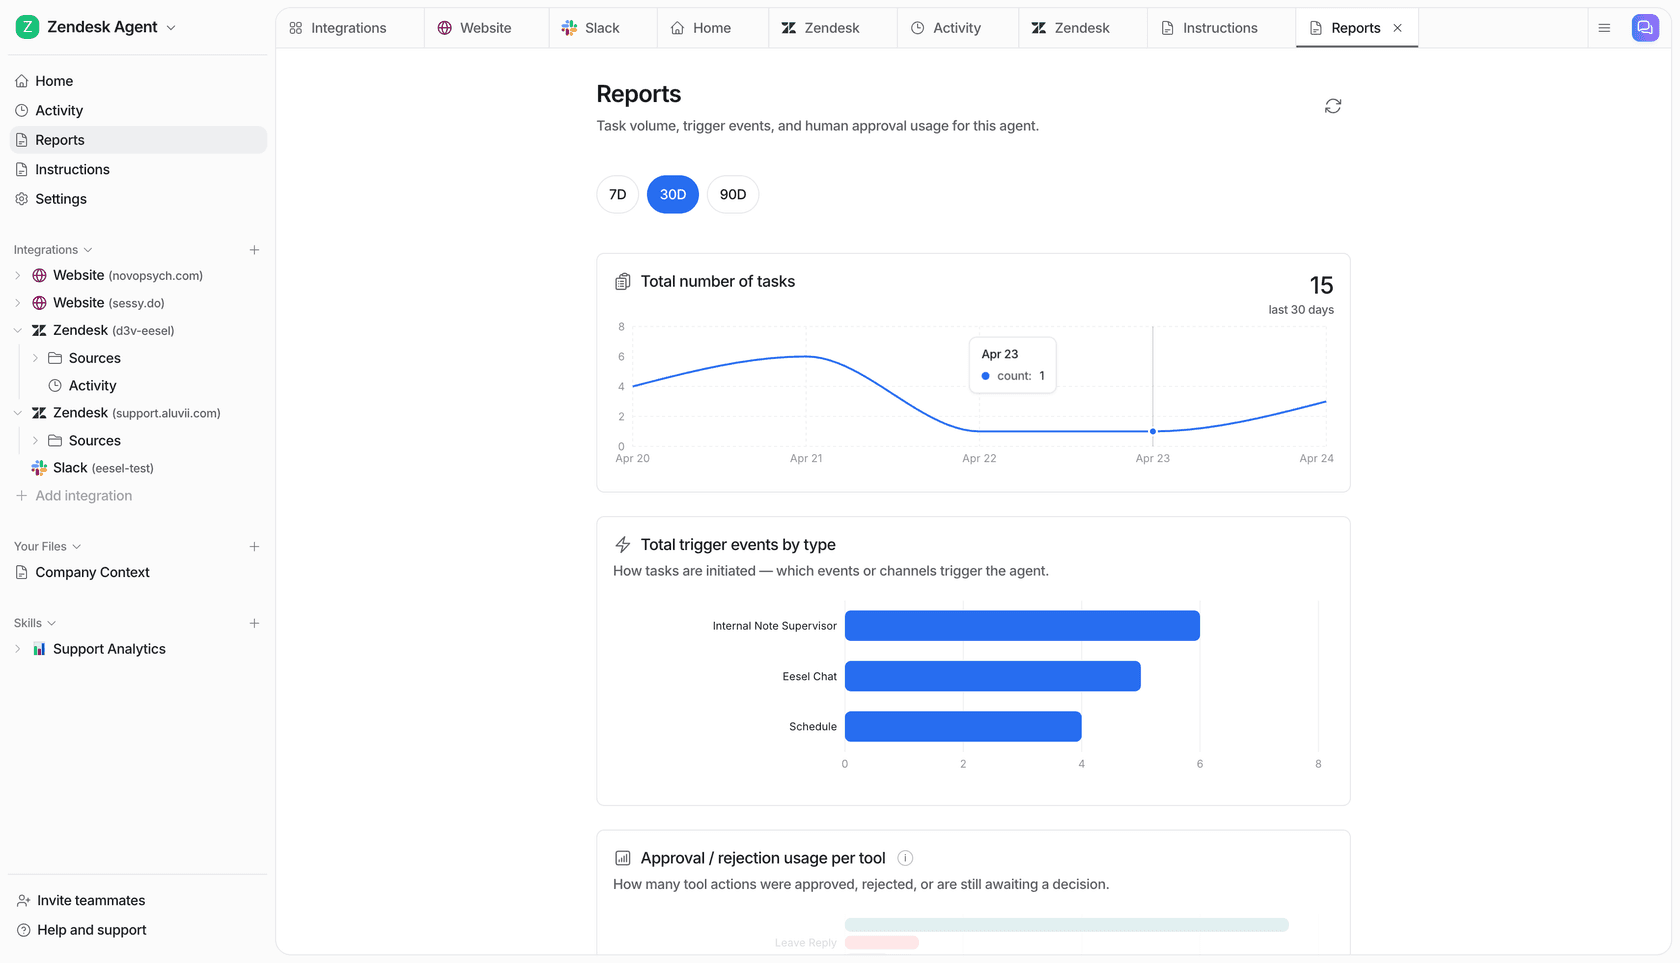
I should be upfront: I work on this one. So here is the honest framing. eesel is not a helpdesk and does not replace the tracking you already have. It sits on top of the helpdesk you already run, Zendesk and Freshdesk included, handles tickets, and keeps its own record of what it touched.
What you can actually track. Task volume over 7, 30 or 90 days, which channel or event triggered each run, and approval versus rejection per tool action, which is the number that tells you whether your team trusts the thing. Because it reads your historical tickets before going live, you also get the pre-launch version: a simulation over past conversations that estimates what it would have resolved, before a single customer sees it.
That last part came from getting it wrong. Early on we watched a confident-sounding bot give answers nobody had checked, which is why every rollout now starts against historical tickets instead of live ones. A CX lead running 7,000 tickets a month put the problem better than we ever did:
"The AI will never be able to answer 100% of the questions, but if it tries and just answers 'sorry I don't know this,' I cannot go and check all my 7,000 tickets to see if the AI actually made a good answer, then the point is a little bit gone."
That is a tracking problem wearing an AI costume. On one real-traffic trial for a jewellery retailer doing about 1,000 tickets a month on Zendesk, the instrumentation is what produced the useful findings: 93% triage accuracy, 100% spam detection across the 22% of the inbox that was spam, and only 12% of drafts sent without edits. That 12% is the number a vendor dashboard would never have shown us, and it turned out to be a length-and-tone problem, not an accuracy one.
Pros
- No seat fee, so giving a manager or a stakeholder read access costs nothing.
- Simulation over past tickets before launch, so you have a forecast rather than a hope.
- Works with your existing helpdesk and its reporting, rather than replacing either.
Cons
- It measures the AI layer, not your agents. You still need your helpdesk's reports for human performance.
- If your problem is purely that Explore is hard, this does not fix Explore.
Pricing
| Plan | Price | What you get |
|---|---|---|
| Free trial | $50 of usage, no card | Full product, simulation included |
| Usage-based | $0.40 per ticket handled | No seat fees, no per-agent reporting tiers |
Verdict: the right pick when your helpdesk tracking is fine and you want an independent record of what automation is doing to your queue. The wrong pick if you were hoping to replace your reporting layer outright, because it complements it instead.
2. Zendesk
Best for: teams with the volume, and the admin, to justify the deepest analytics in the category.
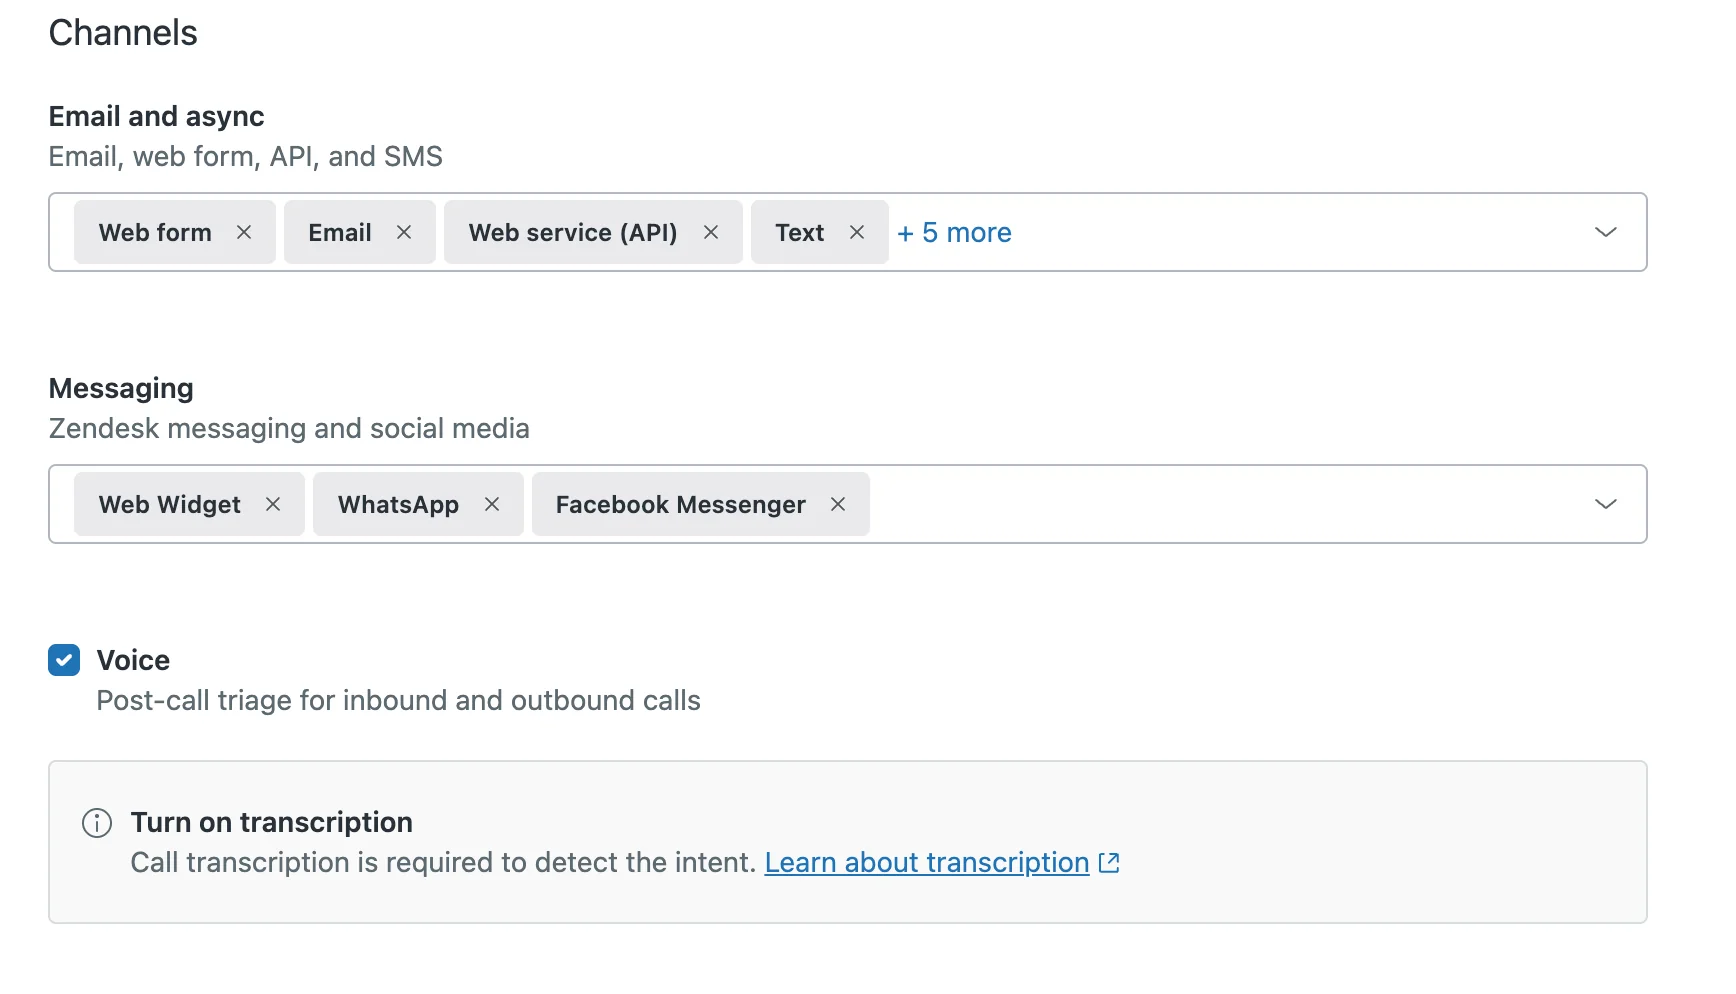
Zendesk Explore can answer questions no other tool here can. It can also take a fortnight and a dedicated admin to get there, and it will charge you for the privilege twice.
What you can actually track. On Suite Team you get prebuilt dashboards, full stop. From Suite Professional you get custom reports, real-time monitoring across incoming tickets, ticket progress and agent productivity with a 30-day lookback, and dataset exports that escape the row cap.
SLA policies cover six measurements including first reply, agent work time and total resolution, from Suite Growth up. One deadline to diary: the live dashboard is being removed from Explore on 25 January 2027, replaced by the real-time dashboards above.
The limits are real and specific. Reports truncate at 50,000 rows, queries cancel after two minutes, and Professional accounts get 10 dashboard restrictions against Enterprise's 500. Data export is not just plan-gated, it is off by default: the account owner has to contact Zendesk to switch it on. There is good news on retention, though, and it is worth knowing because the internet still repeats the old version: the 37-month Explore limit announced in 2025 was cancelled, and most accounts keep everything.
The workarounds people invent tell you where it pinches:
"Right, but you can't schedule exports on a report… but you CAN stick them in a dashboard and schedule exports on that."
Pros
- The most capable reporting engine here, with real drill-downs and dataset exports.
- AI agent analytics on every plan, refreshed hourly.
- Retention is effectively unlimited for most accounts.
Cons
- Custom reports cost a $60 per agent jump from Suite Team.
- Hard to learn, as Explore reporting veterans will tell you at length.
- Raw data export is disabled until you ask support to turn it on.
Pricing
| Plan | Price per agent per month | Reporting you get |
|---|---|---|
| Support Team | $19 | Prebuilt dashboards |
| Suite Team | $55 | Explore Lite, prebuilt only |
| Suite Professional | $115 | Explore Professional, custom reports, real-time |
| Suite Enterprise | Quote | Explore Enterprise, 500 dashboard restrictions |
Verdict: worth it if you have someone whose job includes reporting, and painful if you do not. Budget for Suite Professional from day one, because Team will not answer the questions you are buying a helpdesk to answer. If the cost is the sticking point, my roundup of Zendesk AI alternatives covers the cheaper routes.
3. Freshdesk
Best for: buyers who want the plan gates written down before they sign.
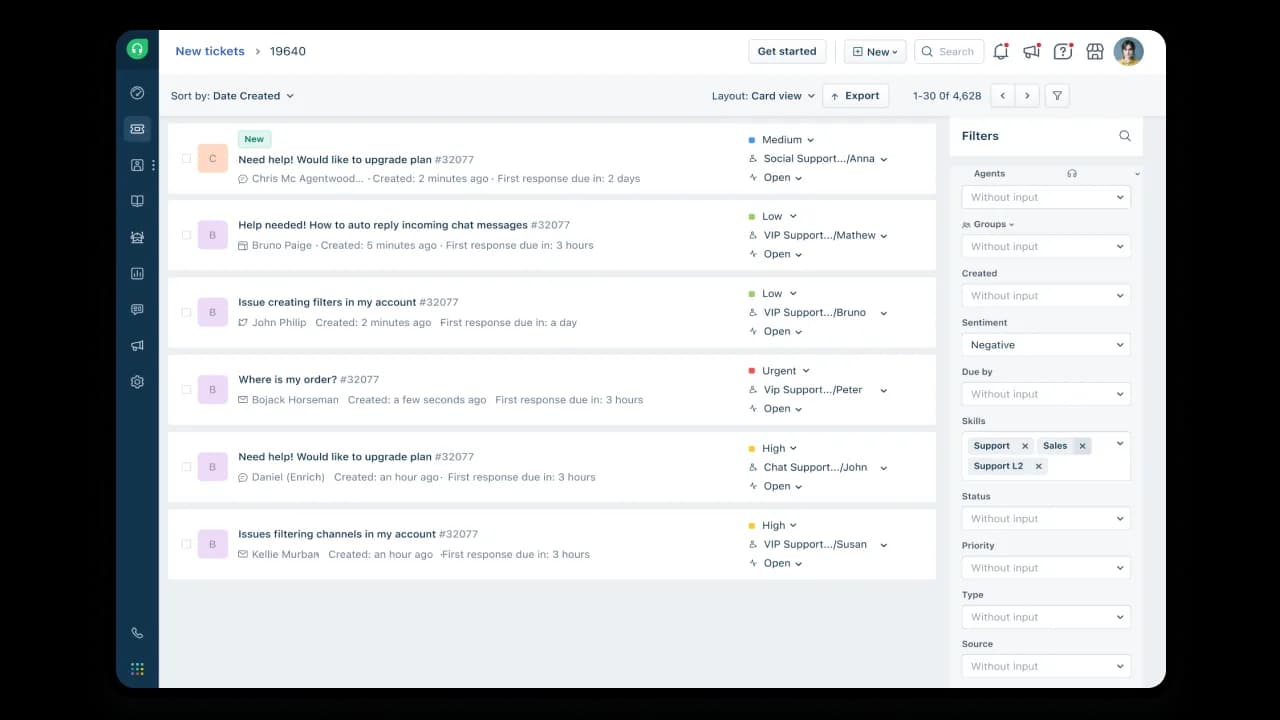
Freshdesk publishes something no other vendor here does: a blunt, row-by-row per-plan analytics matrix. I respect it enormously, and I also think it makes the Growth tier look worse than the marketing does.
What you can actually track. On Growth at $19 you can search, filter, save and present the prebuilt reports. That is it. Building a report, changing a chart type, drilling into underlying data, scheduling anything, exporting anything: all Pro at $55. The Pro wall also catches the reports a support manager runs weekly, including agent performance, group performance, ticket lifecycle and average handling time. Most surprising of all, the satisfaction survey report is blocked on Growth, so a $19 account can collect CSAT ratings and cannot open the report that adds them up.
Retention is plan-tiered too: two years on Growth, unlimited on Pro and Enterprise, and every report now has to carry a date range. Freddy AI Insights, the plain-English analytics layer, is Enterprise only at $89 and, awkwardly, cannot export. It also refreshes weekly or monthly rather than on demand.
The predictable result:
"The reports and automations can be somewhat difficult to navigate. We ended up just exporting all of our tickets every month and creating our own reports through Power query in Excel."

When a director of client care is rebuilding Freshdesk analytics in Excel every month, the tool has told you what it costs.
Pros
- The clearest published per-plan matrix in the category.
- Pro at $55 undercuts Zendesk's equivalent tier by $60 a seat.
- Unlimited reporting history from Pro up.
Cons
- No live or real-time dashboard on any plan.
- CSAT reporting starts at Pro, which catches small teams out.
- Freddy AI Insights is Enterprise only and cannot export.
Pricing
| Plan | Price per agent per month | Reporting you get |
|---|---|---|
| Growth | $19 | Prebuilt reports, 2-year history |
| Pro | $55 | Custom reports, export, scheduling, CSAT report |
| Enterprise | $89 | Adds Freddy AI Insights |
Verdict: the best-value serious reporting tier here at $55, provided you accept there is no real-time view. If you are weighing it against the incumbent, Freshdesk versus Zendesk comes down to exactly this trade.
4. Gorgias
Best for: Shopify stores that want their numbers without a tier upgrade.
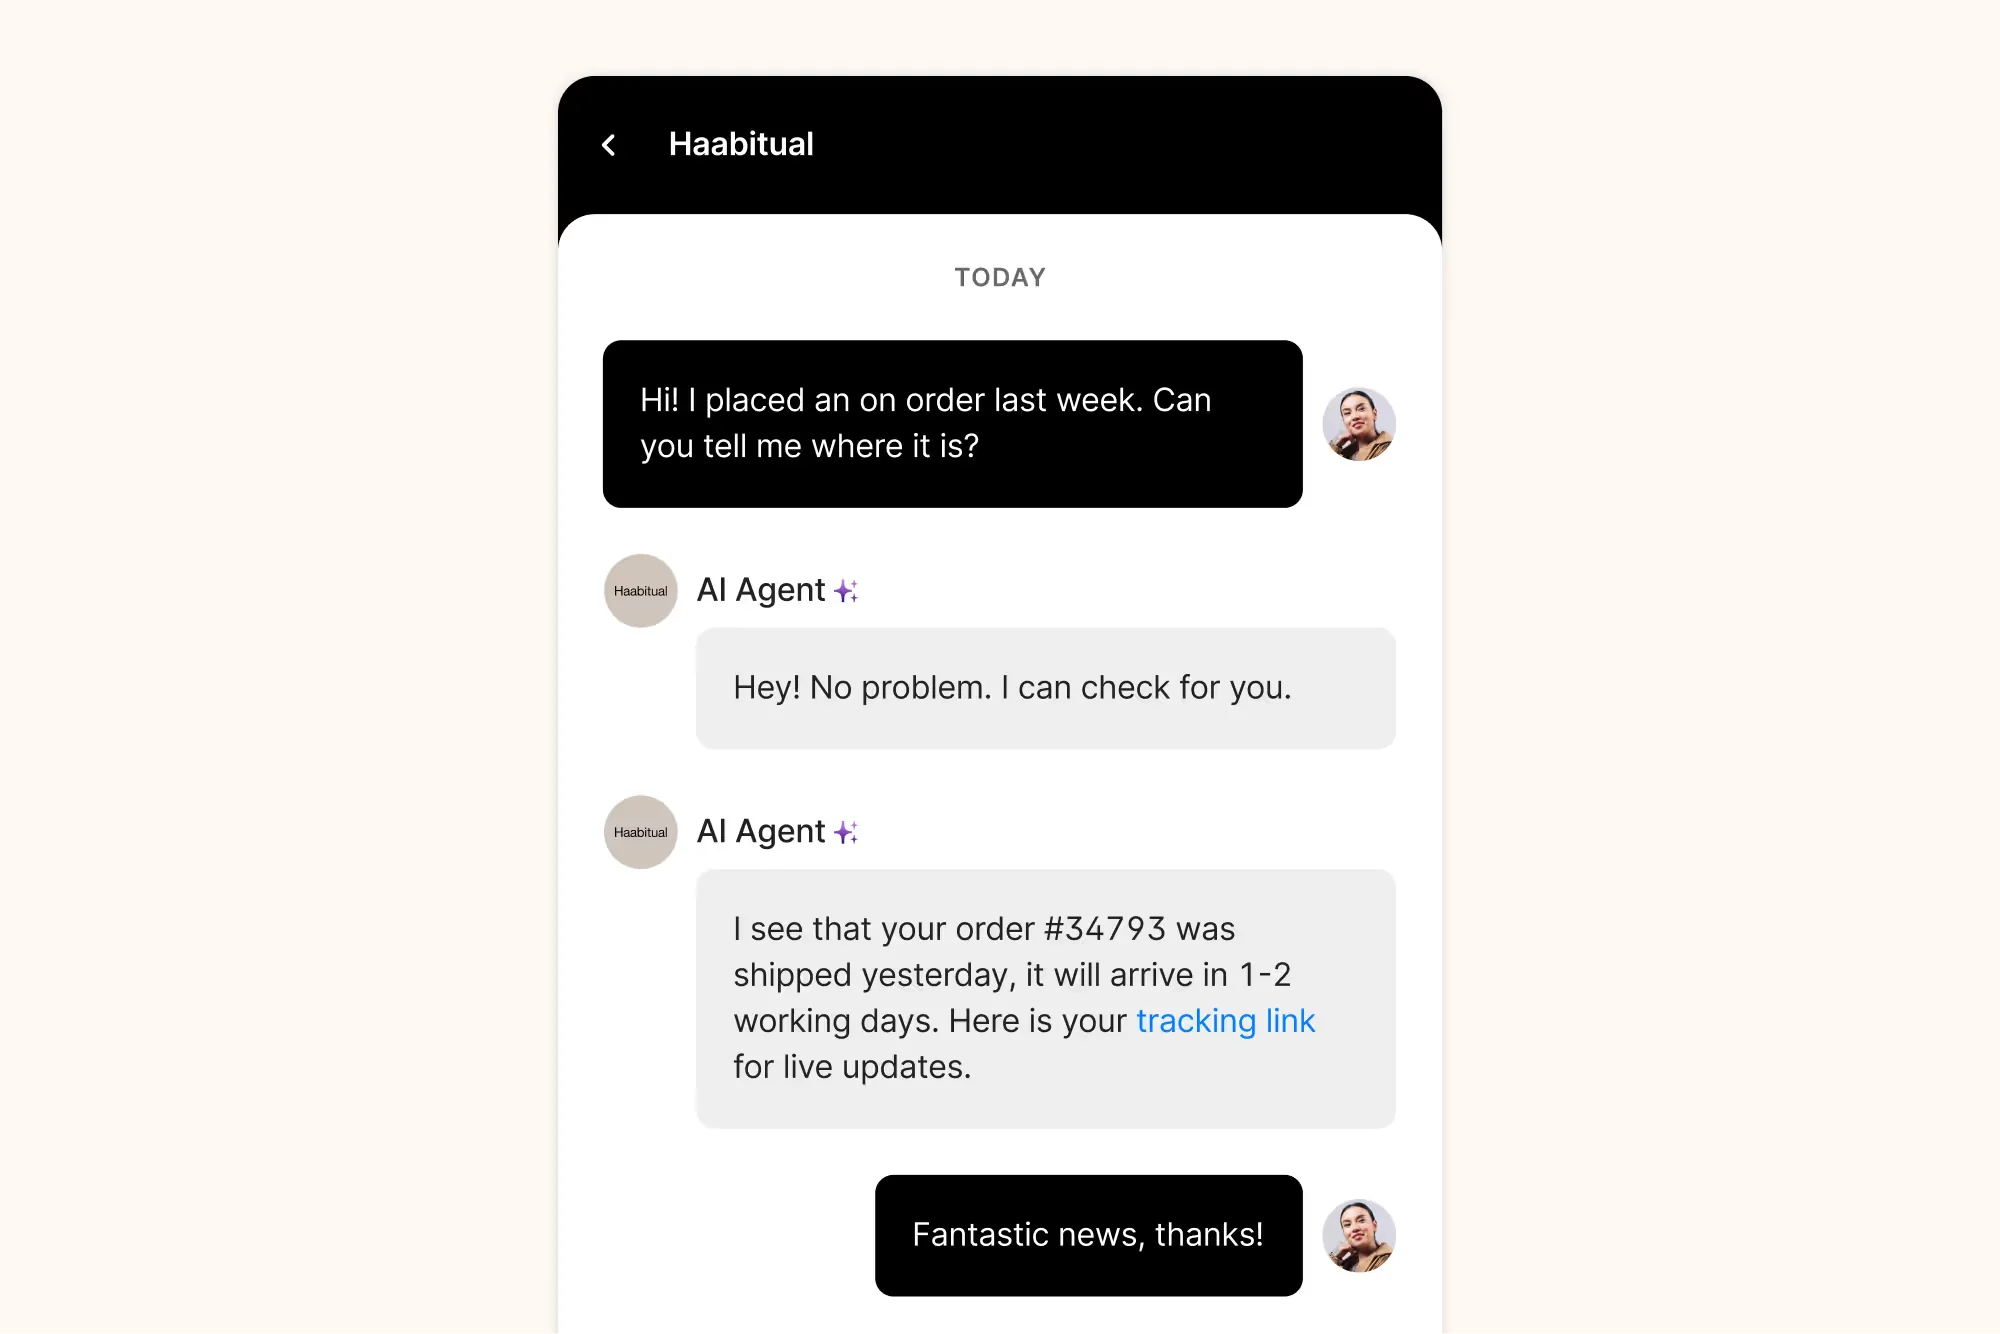
Gorgias is the outlier of this roundup, and I did not expect to write that sentence. Dashboards, the SLA report, satisfaction reporting, real-time monitoring, help center stats and CSV export are all documented as available on every helpdesk plan, Starter included.
What you can actually track. SLA policies on first response and resolution time, set per channel, with achievement rate and breach counts on every plan. Satisfaction scores on every plan. Real-time monitoring on every plan too, with agent status updating every five minutes.
The one genuine gate is the revenue report, which needs Pro at $471 a month and a connected Shopify store, plus the AI and Auto QA analytics, which need the paid AI Agent add-on.
Two caveats. Gorgias publishes no fixed retention number, saying only that each cluster has its own cutoff, and query ranges cap at 365 days. And the billing model matters more than the reporting here: automated interactions cost $1.50 each past your allowance, so a four-message AI thread bills four times. My Gorgias pricing breakdown works that through properly.
Pros
- No reporting paywall at all on dashboards, SLAs, CSAT or export.
- Real-time monitoring on the $40 Starter plan.
- Auto QA scores every closed ticket on seven dimensions, with the AI add-on.
Cons
- Revenue reporting needs Pro, a 6x jump from Basic.
- No published data retention window.
- API stays at 2 requests per second until Enterprise.
Pricing
| Plan | Monthly | Annual per month | Tickets included |
|---|---|---|---|
| Starter | $40 | Monthly only | 50 |
| Basic | $90 | $77 | 300 |
| Pro | $550 | $471 | 2,000 |
| Advanced | $1,430 | $1,227 | 5,000 |
Verdict: if you sell on Shopify, this is the cheapest path to complete tracking, because nothing you need is one tier away. If you run a conversational queue rather than an order-ops queue, the per-interaction AI billing will hurt long before the reporting does.
5. Zoho Desk
Best for: the cheapest place to build a real custom report.
Zoho prints its caps as raw numbers in the edition comparison, which makes it the easiest tool here to plan around. Standard at $14 gets you 50 custom reports, 10 custom dashboards and CSV, XLS and PDF export. Professional at $23 removes both caps.
What you can actually track. Response, resolution and first-contact-resolution dashboards from Standard. Customer happiness ratings and the happiness dashboard from Express at $7, which makes Zoho the cheapest CSAT trendline in this entire comparison. Agent performance, agent availability and cross-department analytics from Professional.
Now the trap, and it is a good one to know before you buy. You can define four SLAs on Standard, but SLA dashboards do not exist below Professional, so you can set targets you cannot measure. Similarly, Zia runs from Professional but its dashboard, where you see the AI's aggregate output in one place, is Enterprise only at $40. Scheduled reports are Enterprise too, capped at 100. And below Enterprise you get exactly one business-hours calendar, so a multi-region team's SLA clock runs on a single timezone.
Pros
- Custom reports at $14 a seat, by some distance the cheapest here.
- CSAT from $7, cheaper than everyone.
- Zoho Analytics integration from Standard is a clean escape hatch when the 50-report cap bites.
Cons
- SLA attainment reporting needs Professional even though SLAs start lower.
- Scheduled reports are Enterprise only.
- Zoho publishes no analytics retention figure, only a 60-day import history.
Pricing
| Edition | Annual per agent per month | Reporting you get |
|---|---|---|
| Free | $0, 3 users | No custom reports |
| Express | $7, 5 users | Prebuilt reports, CSAT dashboard |
| Standard | $14 | 50 custom reports, 10 dashboards, export |
| Professional | $23 | Unlimited reports, SLA and agent dashboards |
| Enterprise | $40 | Scheduled reports, Zia dashboard |
Verdict: the value pick, and the one I would hand a cost-conscious team that still wants real numbers, alongside the other options in my help desk software reviews. Go straight to Professional at $23 if SLAs matter to you, because Standard will measure everything except the promise you made your customers. There is more on the AI side in my Zoho Desk review.
6. HubSpot Service Hub
Best for: tracking support against revenue, in one object model.
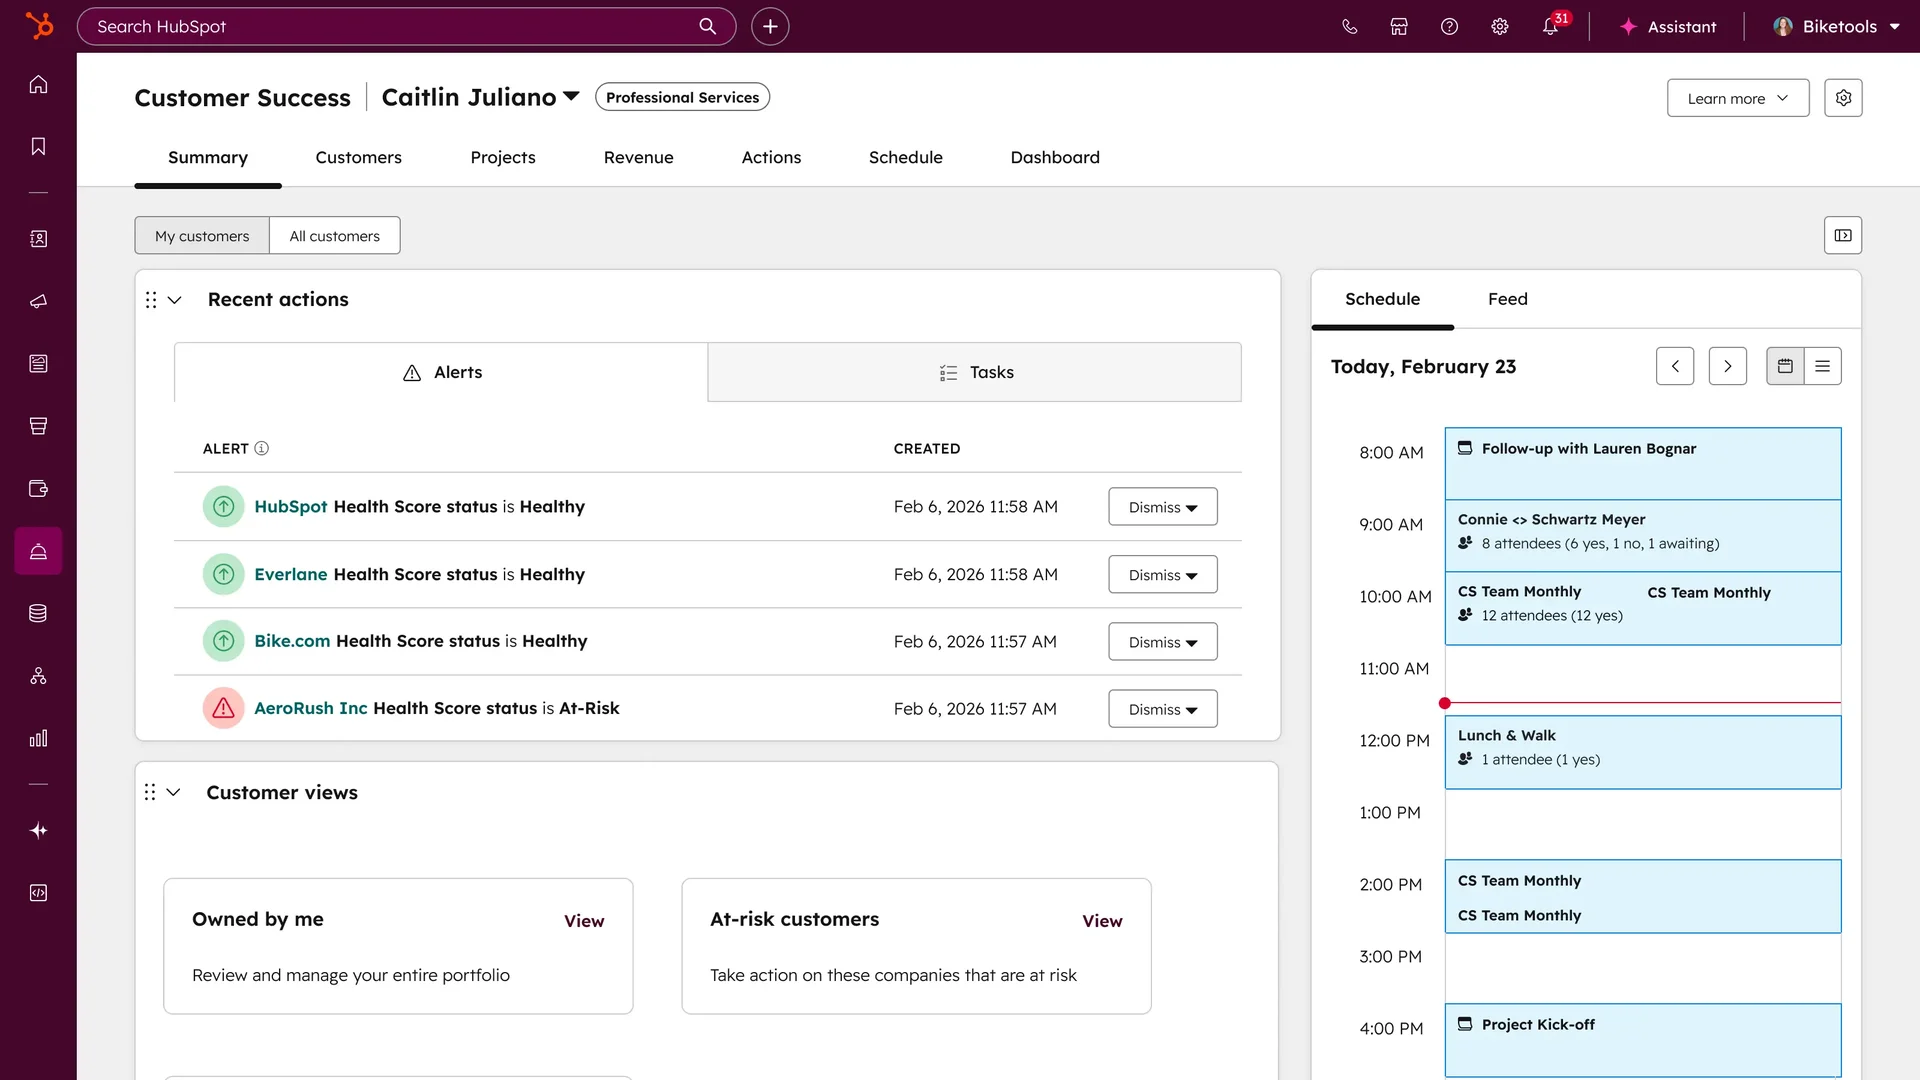
HubSpot's advantage is not the support reporting itself, it is that tickets sit next to deals and companies, so "what did support cost us on accounts over $50k" is a report you can actually build. That is rare, and it is the reason to pay for it.
What you can actually track. Dashboards on every tier, from 10 on the free tools up to 100 on Enterprise, always at 50 reports each. Custom reports start at Professional and are capped at 100, with Enterprise at 500. Customer feedback surveys, covering CSAT, NPS and CES, start at Professional, capped at 100 CSAT surveys on both Professional and Enterprise. SLAs are Professional, and conditional SLAs, the ones that treat VIPs differently, are Enterprise.
Two costs that do not appear in the seat price. Professional carries a one-time $1,500 onboarding fee and Enterprise $3,500. And the caps do not stack: two Professional subscriptions still give you 100 custom reports, not 200, with a $200 per month reporting limit increase as the only way past. On the AI side, Breeze burns 50 credits per resolved conversation against Professional's 3,000 monthly credits, which works out at roughly 60 AI resolutions a month before overage. My HubSpot credits explainer works that maths through.
One practical tip that saves real money: view-only seats are free, so stakeholders who want dashboards do not need a $90 service seat.
Pros
- Support metrics join to CRM data natively, which nothing else here does.
- Dashboards on every tier including the free one.
- Free view-only seats for dashboard consumers.
Cons
- Custom reports need Professional plus a $1,500 one-time fee.
- Survey caps are identical on Professional and Enterprise, which is odd.
- Full functionality needs a service seat, not a cheaper core seat.
Pricing
| Edition | Price per seat per month | Reporting you get |
|---|---|---|
| Free tools | $0, 2 users | 10 dashboards, no custom reports |
| Starter | $7 | 30 dashboards, no custom reports |
| Professional | $90 | 100 custom reports, surveys, SLAs, $1,500 onboarding |
| Enterprise | $150 | 500 custom reports, conditional SLAs, $3,500 onboarding |
Verdict: the right answer when the question you need to answer spans support and revenue, and an expensive answer otherwise. If you are already in HubSpot CRM, the Professional tier pays for itself in reports you cannot build anywhere else. If you are not, the Service Hub AI alternatives are worth a look first.
7. Help Scout
Best for: small teams who want reporting that needs no explanation.
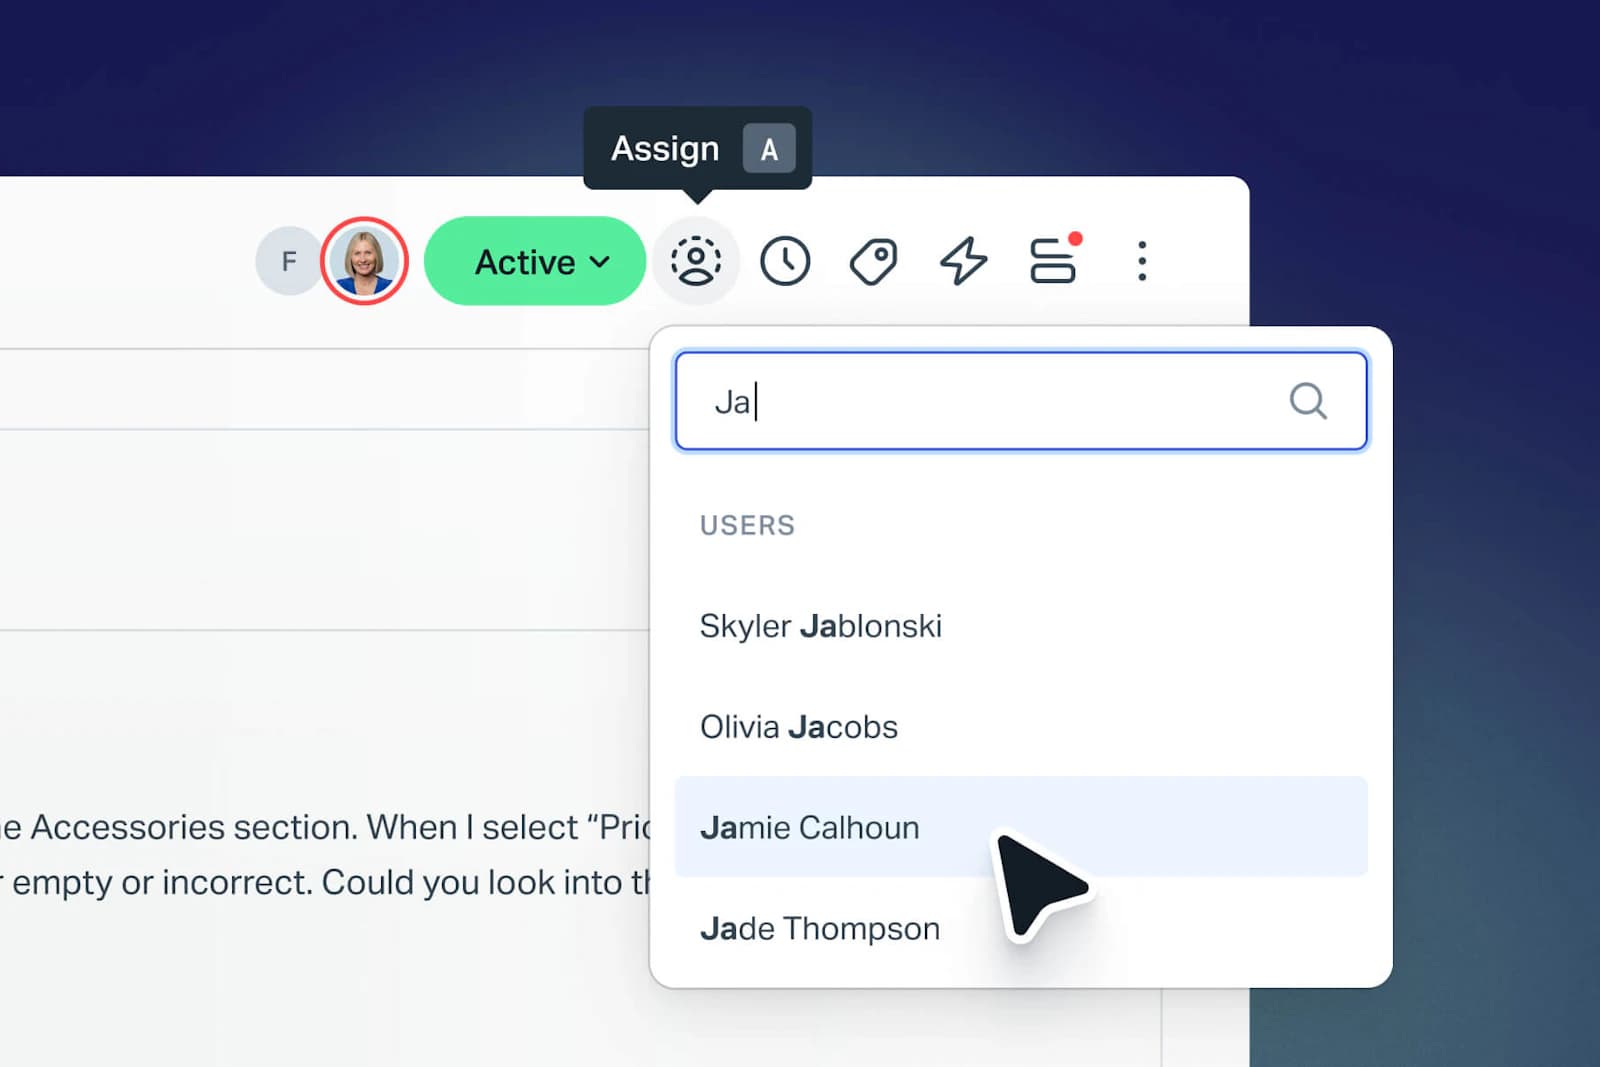
Help Scout is the only vendor here that says the quiet part out loud. Asked whether you can build your own reports, its documentation answers: "Not in the app. While we offer lots of filters, there isn't a way to customize how calculations are performed nor is there an option to build custom reports based on custom data sets." The "custom reports" row on the pricing page means saved filter views.
I have a soft spot for this. Seven prebuilt reports that a new manager understands on day one beats a builder nobody opens. It is also a real ceiling, and you should know where it sits before you hit it.
What you can actually track. All Channels, Email, Chat, Phone, Company and User, Happiness and Docs reports, filtered by inbox, tag, folder or custom field. Up to 10 custom data points per conversation feed those filters. The plan lever is history: 30 days on Free, two years on Standard at $25, all-time on Plus at $45 and Pro at $75.
Two gotchas worth pricing in. SLA policies are rationed by count, so Standard gets one, Plus gets two and only Pro gets unlimited, and Pro has a 10-seat minimum, meaning a $750 monthly floor. And the reporting API is not on Standard at all: "Standard plans do not have access to the reporting endpoints," per the export docs. If your plan is to pipe metrics into a spreadsheet or BI tool, Plus at $45 is your actual entry price.
Pros
- Reports a new manager can read without training.
- CSAT reporting on the free plan.
- All-time history from $45 a seat.
Cons
- No custom report builder at any price.
- Reporting API needs Plus, not Standard.
- Unlimited SLA policies mean Pro and a 10-seat minimum.
Pricing
| Plan | Price per user per month | Reporting history |
|---|---|---|
| Free | $0, up to 5 users | 30 days |
| Standard | $25, up to 25 users | 2 years, no reporting API |
| Plus | $45, up to 50 users | All-time, reporting API, 2 SLAs |
| Pro | $75, 10-seat minimum | All-time, unlimited SLAs |
Verdict: the best simple option, right up until someone asks a question the seven reports do not answer. Buy it knowing you will export to a spreadsheet eventually, and budget Plus rather than Standard so the API is there when you do. More detail in my Help Scout review.
8. Front
Best for: cross-functional queues where support, ops and sales share an inbox.
Front's collaboration model is the best here, and its analytics are the most gated. Both things are worth knowing before you commit.
What you can actually track. Starter at $25 gets basic analytics. Professional at $65 gets advanced analytics, the live dashboard, scheduled reports and, notably, the customer satisfaction report, which Starter does not have at all. Custom reports are Enterprise at $105, which for a 20-person team is $25,200 a year for the ability to define your own report. SLAs exist as time goals, showing overdue conversations and per-rule breach counts, from Professional.
Front is also the only vendor here that publishes hard retention caps binding both the UI and the API: six months on Starter, 24 months on Professional, all history on Enterprise. Two timing details matter day to day: reports only show activity older than two hours, and results are cached for up to an hour. If you wanted a live wallboard, this is not it. The kinder detail is that upgrading restores the history you could not previously see.
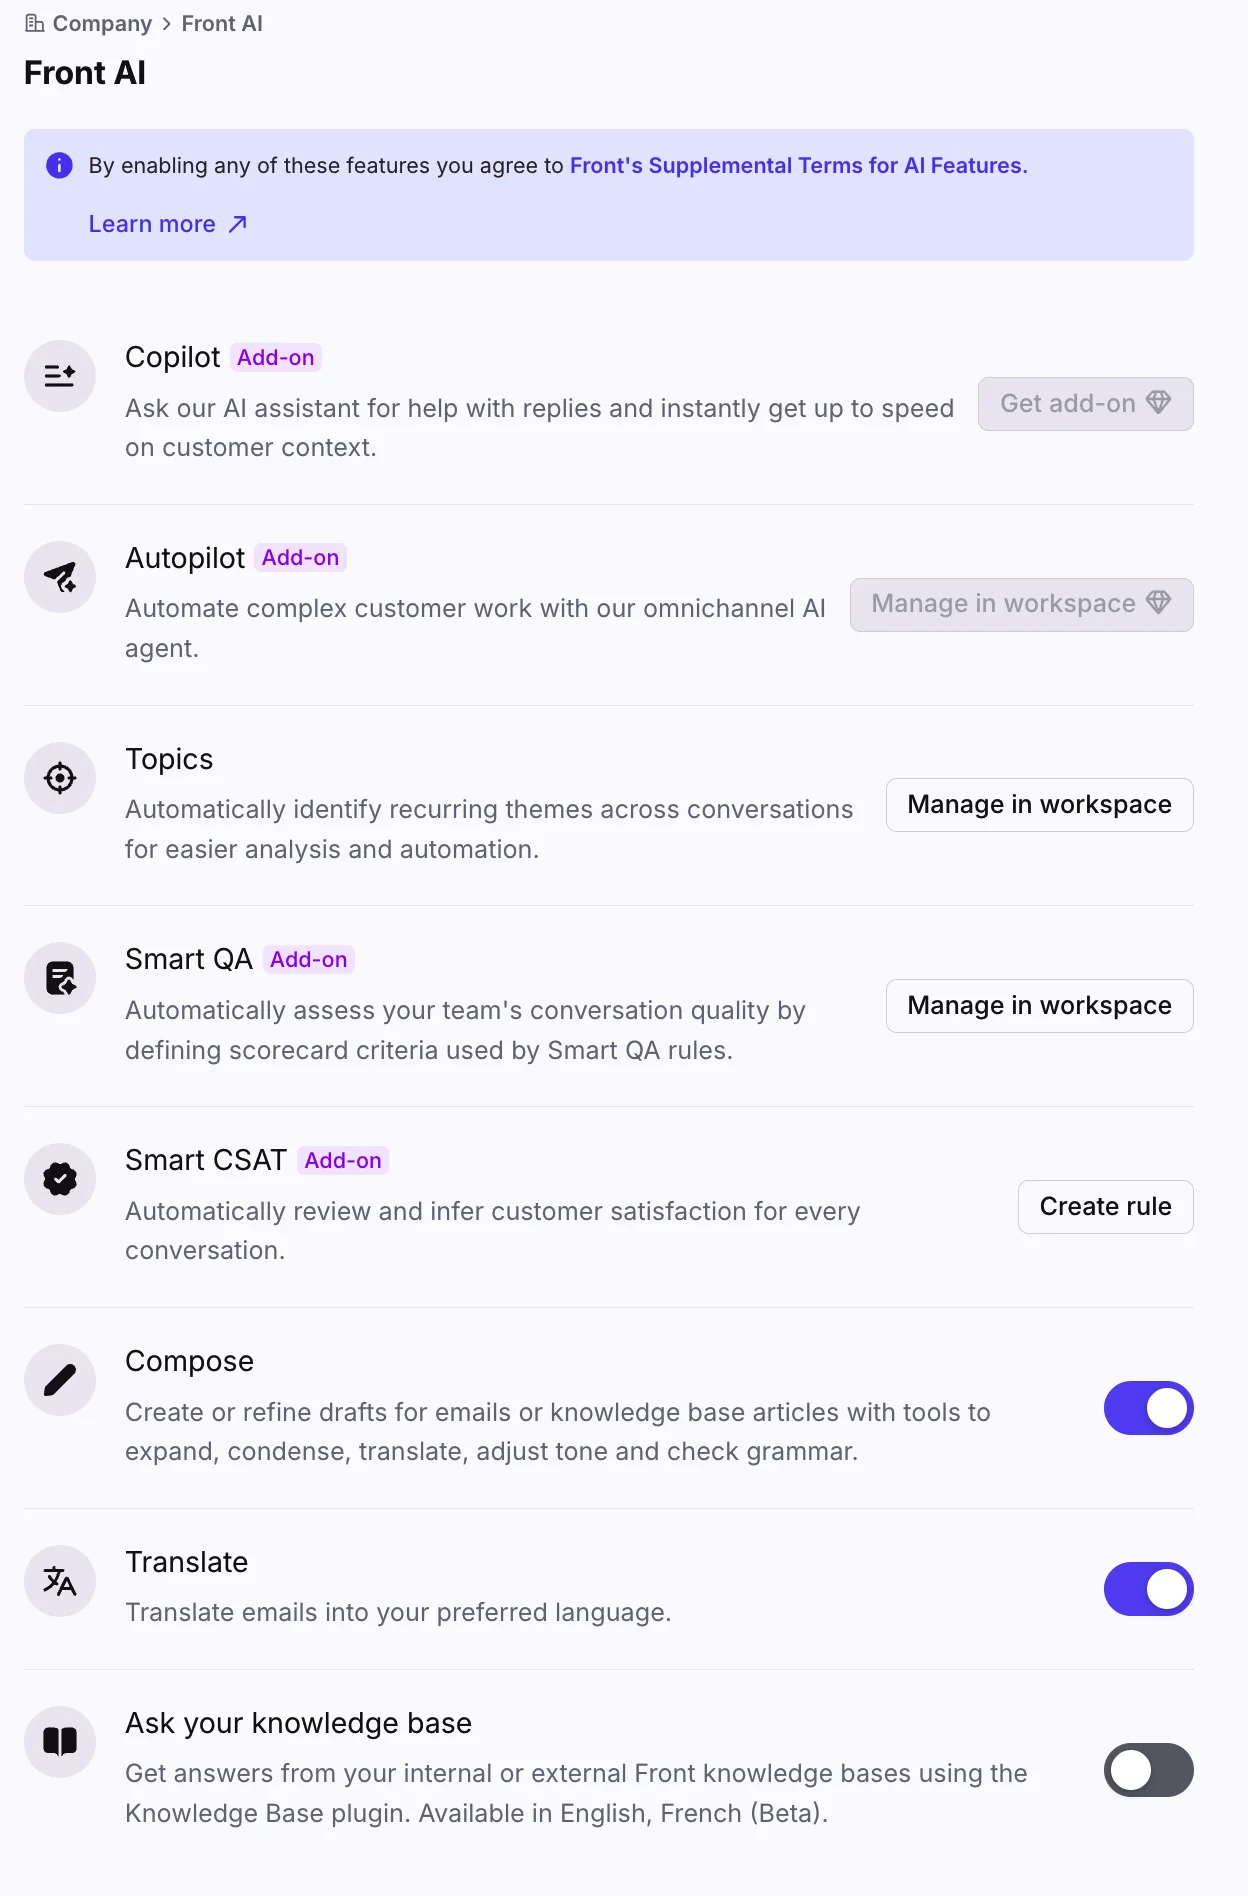
The AI reporting is priced separately, per seat: Smart QA at $20, Smart CSAT at $10, Copilot at $20, all included on Enterprise, with Autopilot an add-on on every plan from $0.05 per conversation.
Pros
- Best shared-inbox model for cross-team work.
- Retention is published clearly per plan, which is rare.
- Smart QA scores conversations automatically, if you buy it.
Cons
- Custom reports are Enterprise only at $105 a seat.
- CSAT reporting starts at $65, not $25.
- Nothing is real time; reports lag two hours.
Pricing
| Plan | Price per seat per month | Reporting you get |
|---|---|---|
| Starter | $25, up to 10 seats | Basic analytics, 6-month history |
| Professional | $65, up to 50 seats | Advanced analytics, CSAT, live dashboard, 24 months |
| Enterprise | $105 | Custom reports, all history, AI features included |
Verdict: pick Front for how it handles work, not for how it measures it, and go in expecting Professional as your floor. If measurement is the priority and the shared inbox is not, Front alternatives will serve you better per dollar.
9. Salesforce Service Cloud
Best for: enterprises already standardised on Salesforce.
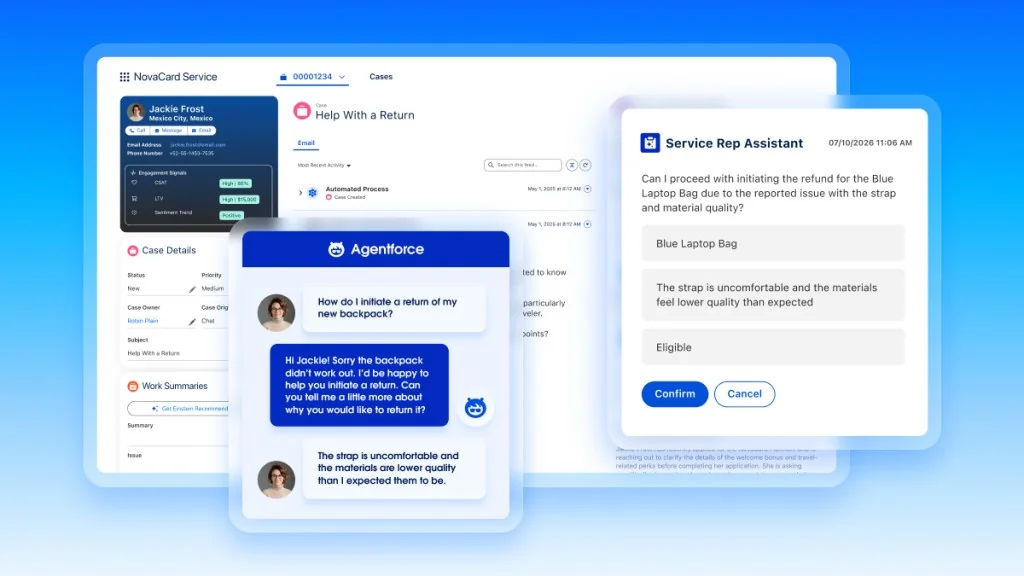
Salesforce inverts the pattern. Customisable reports and dashboards are on every edition including Starter Suite at $25, which sounds generous until you read what "Advanced Reporting Features" means.
What you can actually track. Basic report building everywhere. Then cross filters, joined reports, bucketing and history tracking, all bundled under Advanced Reporting Features, from Enterprise at $175 per user per month. In practice that means any report that joins case data to a second report type, buckets values into custom groups, or trends a field over time is a $175 feature. A ten-person team goes from $12,000 a year on Pro Suite to $21,000 purely to bucket and join their own case data.
Feedback Management, which is how you get CSAT, is available for purchase on Enterprise and Unlimited but only included at Agentforce 1 Service, $550 per user per month. Tableau Next follows the same shape. And the API is not included on Starter Suite at all, costing an extra $25 per user on Pro Suite.
Pros
- Reporting reaches every object in the org, not just cases.
- Basic customisable reports on all five editions.
- The most complete compliance and governance story here.
Cons
- Joins and bucketing need Enterprise at $175.
- CSAT is bundled only at the $550 tier.
- Salesforce publishes no retention window for support analytics anywhere public.
Pricing
| Edition | Price per user per month | Reporting you get |
|---|---|---|
| Starter Suite | $25 | Customisable reports, no API |
| Pro Suite | $100 | Customisable reports, API is $25 extra |
| Enterprise | $175 | Advanced reporting: joins, bucketing, history |
| Unlimited | $350 | Adds sandboxes, Tableau Next purchasable |
| Agentforce 1 Service | $550 | Feedback Management and Tableau Next included |
Verdict: if your company runs on Salesforce, the reporting reach is unmatched and you are paying for it anyway. If it does not, this is the most expensive way to learn your first reply time. My take on Agentforce pricing covers the AI side of the same bill.
The five metrics worth tracking, and the timestamps behind them
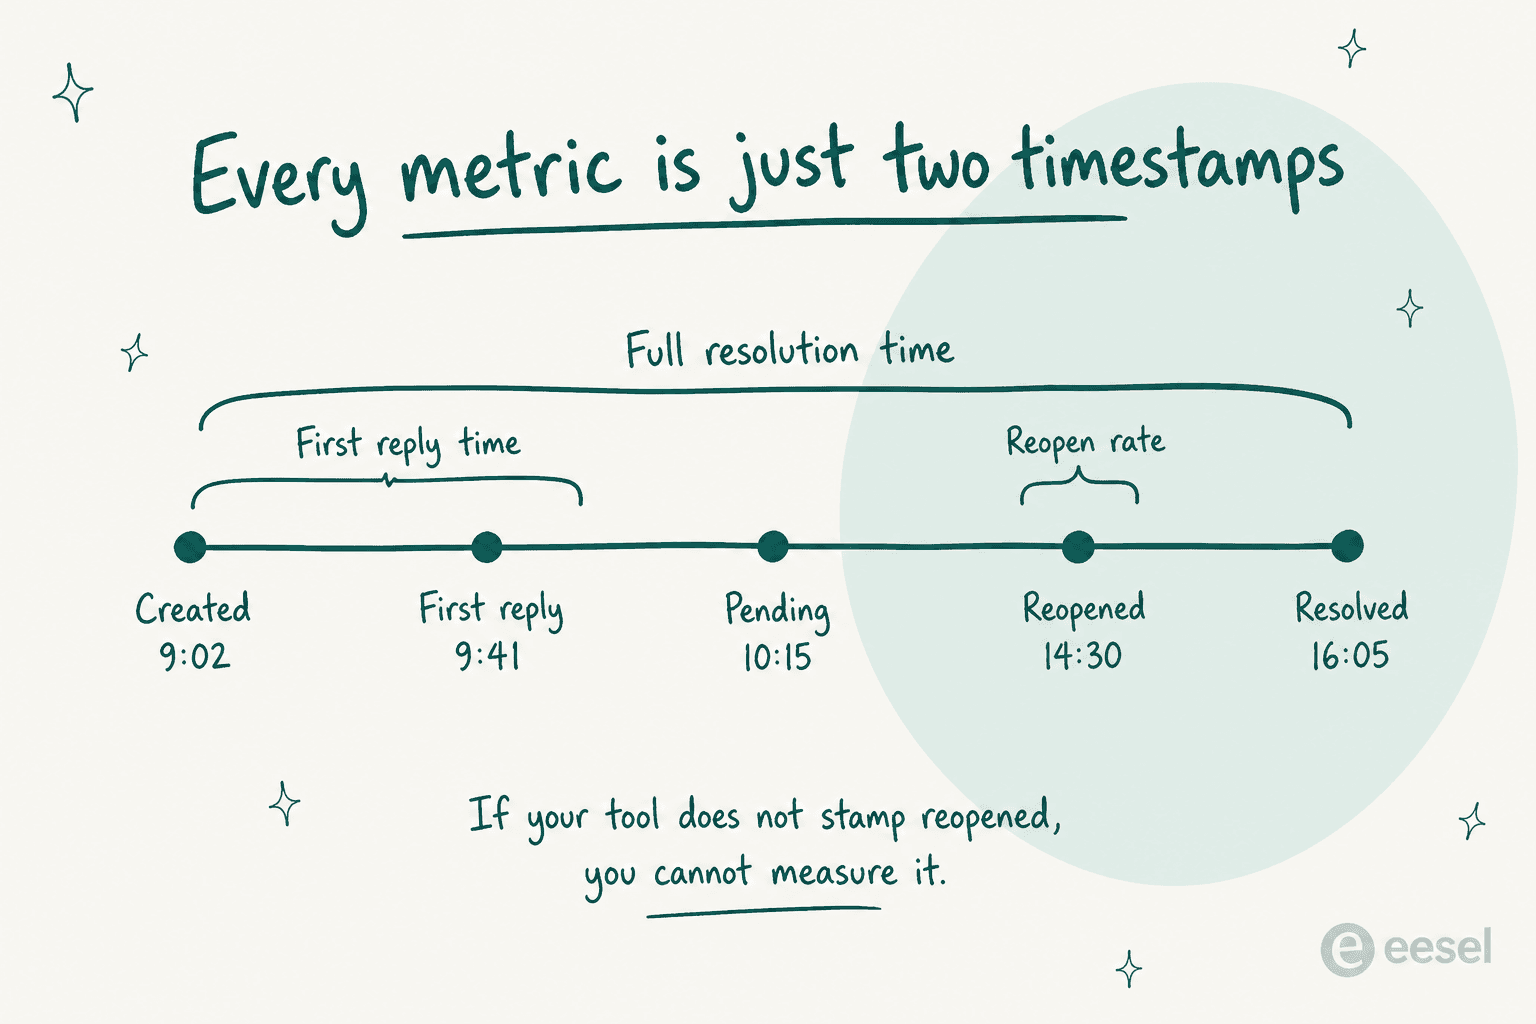
Every support metric is two timestamps and a subtraction. Once you see it that way, evaluating a tool gets much easier: you are not asking whether it has a first reply time report, you are asking whether it stamps the events that report is made of.
The five I would actually watch:
- First reply time. Created to first human or AI response. The one metric customers feel directly. Zendesk lets you set an SLA on it from Suite Growth.
- Full resolution time. Created to resolved. Watch the median, not the mean, because one gnarly ticket open for three weeks will wreck your average.
- Reopen rate. The share of resolved tickets that come back. This is the honest quality metric and the one most teams never configure, because it needs the tool to stamp a reopen event at all. It is also the number that exposes a bad AI to human handoff faster than CSAT does.
- CSAT, read carefully. A Freshdesk reviewer on Capterra flagged a real trap here: if a customer gives a low rating and later converts it to a good one, "the original DSAT still remains, which can affect reporting accuracy." My notes on AI CSAT cover how to keep the survey honest once a bot is answering.
- Deflection or resolution rate once AI is in the loop, split out from human-handled tickets. Blended numbers hide both a great bot and a terrible one.
If you want the fuller list with definitions, my guide to customer service KPIs has it, AI customer service metrics covers the automation-specific ones, and support quality assurance covers the sampling work that keeps the numbers honest.
What no helpdesk dashboard will show you
This is the part I would put on a sticky note, and it comes from someone who has run support at scale rather than from a vendor:
"Most of the metrics that actually make leadership take support seriously don't exist in your support dashboard. Contact rate lives in product analytics. Support-touched revenue sits in your CRM. Cost per ticket depends on finance data. I did this manually at Loom for years. I'll never get all those spreadsheet hours back."

That reframes the whole buying decision. If the numbers that change how your company treats support live in three systems, then the most valuable thing your tracking tool can do is hand you clean data other systems can read. Which puts export and API access, the least glamorous rows on any pricing page, near the top of the list.
It also explains why so many teams end up in a spreadsheet regardless of what they paid. HubSpot is the only tool here that dissolves the problem, because tickets and deals already share an object model. Everyone else needs an export, which is why I would weigh Help Scout's Plus-only reporting API or Zendesk's default-off export more heavily than another dashboard feature.
One more piece of received wisdom worth puncturing. A long-running thread on what support teams actually use daily put SLA tracking and search in the "every single day" bucket, CSAT and reporting in "weekly", and advanced analytics dashboards in what it called the 80% nobody touches. The commenter builds a support tool himself, so read it with that in mind, but it matches what I see. Buy the tier that gets you daily-use tracking done well, not the one with the most report types.
How to trial tracking before you buy
Reporting is the hardest thing to evaluate in a two-week trial, because an empty account has nothing to report on. Four things that actually work:
- Import or forward a month of real tickets first. A demo dataset will make every tool look fine.
- Try to build one specific report on day one. Pick something your team asks for weekly, like reopened tickets by tag. If it takes more than an hour on the plan you intend to buy, that is your answer.
- Export before you commit. Run the CSV or API export on the trial plan. This is where Zendesk's default-off export and Help Scout's Standard-tier API restriction show up, and you want to find them now rather than in month four.
- Check the tier, not the product. Every claim in this post is plan-specific. "Freshdesk has CSAT reporting" is true and useless; "Freshdesk has CSAT reporting on Pro" is the fact you need.
If AI is part of the plan, add a fifth: run it against historical tickets before it touches a live queue. A buyer we spoke with put it best when we offered retrospective analytics as an answer to his concerns about AI quality. He was blunt that a monthly report was no use to him, because his customers needed the right answer in the moment, not a post-mortem. He was right, and it is why simulation before launch beats reporting after it.
Track what your AI actually does on the helpdesk you already run
If you got this far, the odds are your helpdesk tracks tickets fine and the reporting is the sore spot. Before you price a migration, consider the cheaper experiment.
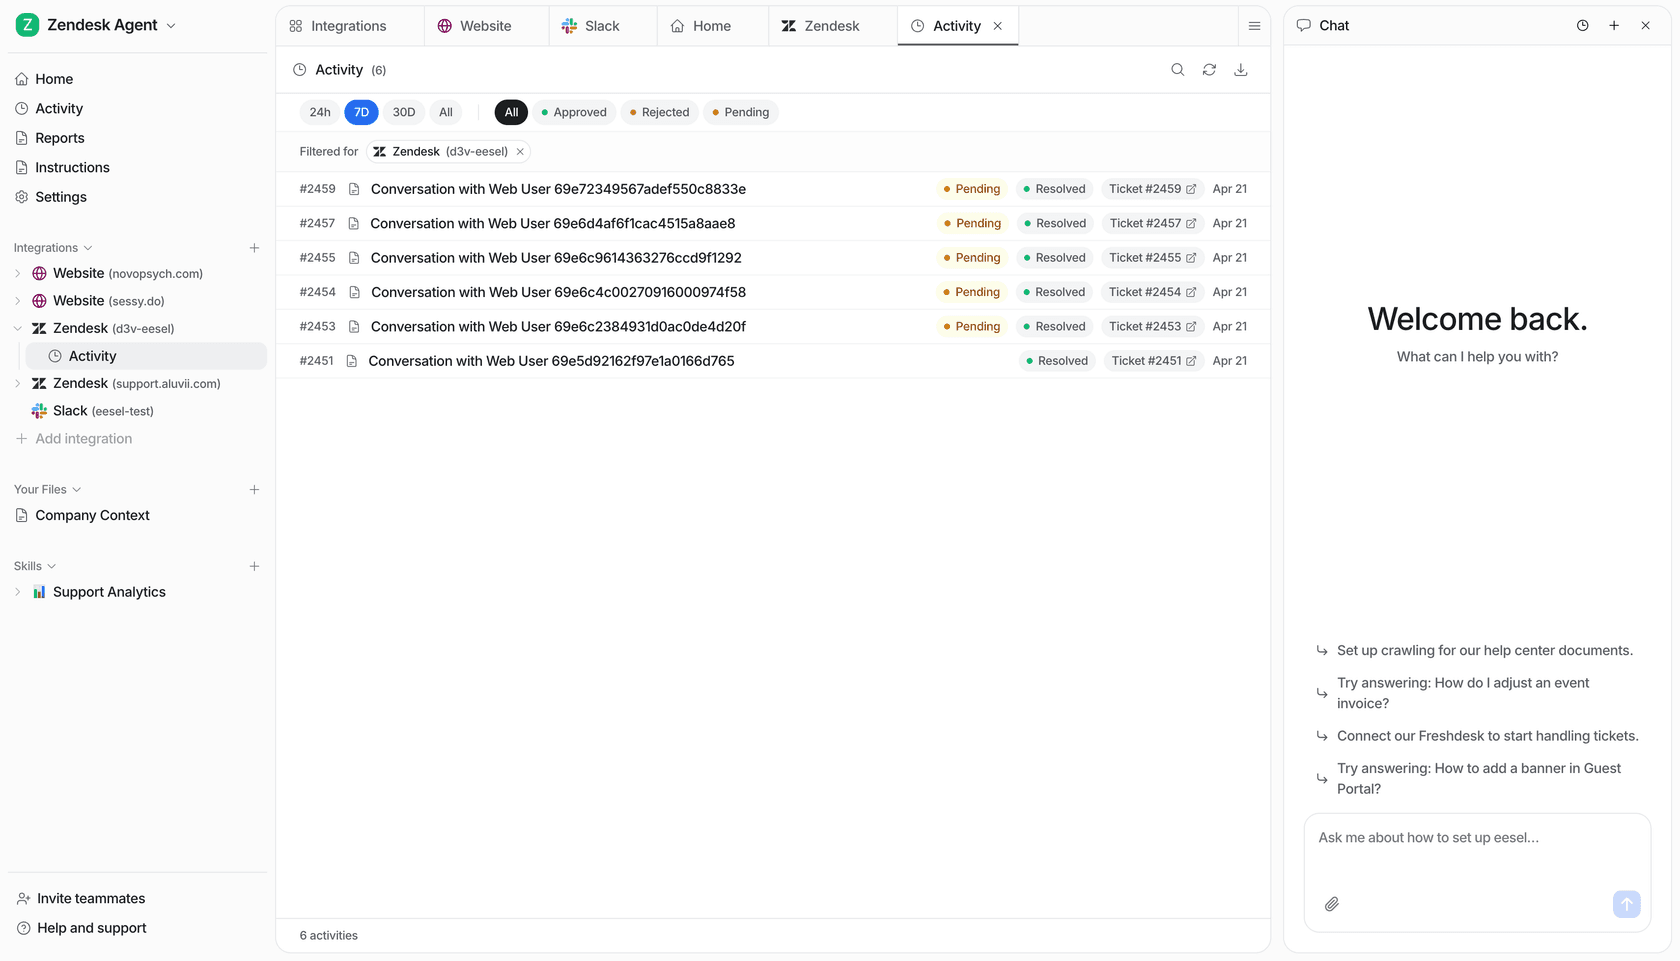
eesel connects to Freshdesk, Front and the rest in a few minutes, then learns from the tickets your team has already resolved. What you get back is the thing no helpdesk plan sells you: a before-and-after. Before launch, a simulation over your own history estimates how much of last quarter it would have closed. After launch, you see what it really closed, and how often your agents overrode it.
Billing is $0.40 per ticket handled with no seat fee, so adding a manager who only wants to watch the numbers costs nothing extra. That is the part I would weigh against a $60 per agent reporting upgrade.
Start with the free $50 of usage, no card required, and run the simulation over your own history. Worst case you get a fairly precise estimate of how much of your queue is automatable, which is a useful number to own regardless of what you buy next.
Frequently Asked Questions
What is customer service tracking software?
How much does customer service tracking software cost in 2026?
Which customer service tracking software is best for a small team?
Can I track SLA performance on a cheap plan?
How do I track whether my AI agent is actually working?
Is there free customer service tracking software?
Do I have to switch helpdesks to get better tracking?
What is the difference between ticket tracking and support reporting?



Article by
Kurnia Kharisma Agung Samiadjie
Kurnia is a software engineer and writer at eesel AI with two years of SEO experience, writing about AI tools, helpdesk software, and customer support. He pairs a developer's understanding of how these products are built with search-driven research into what actually ranks and resonates with the people searching for them.