If you work in customer support, you know that data isn't just a bunch of numbers on a dashboard. It’s the story of your customers and your team. High-quality reporting helps you see what's really going on, manage your team’s workload, and, ultimately, elevate your service. Most teams using Zendesk rely on its sophisticated built-in tools for this, which are designed to turn a mountain of data into a clear path forward.
This guide will walk you through Zendesk reporting analytics in a practical, helpful way. We’ll look at the core tool, Zendesk Explore, from its reliable, ready-made dashboards to its advanced custom reporting capabilities. We'll also look at how to master its features and explore how modern tools can work alongside Zendesk to turn your support data into an even more proactive plan for improvement.
What is Zendesk reporting analytics?
Simply put, Zendesk reporting and analytics is about leveraging Zendesk’s mature toolset to measure and track how your customer service is performing. The star of the show is Zendesk Explore, a robust analytics platform built to give you a comprehensive window into your support world.
Zendesk Explore seamlessly pulls in data from all your Zendesk products-Support, Talk, Chat, and Guide-allowing you to:
-
Keep an eye on key metrics: You can accurately track vital indicators like first response time (FRT), resolution time, and customer satisfaction (CSAT).
-
Monitor team performance: You can gain visibility into how individual agents or specific groups are performing, tracking key performance metrics, highlighting successes and identifying opportunities for professional development.
-
Understand your customers: You can identify common trends, determine peak contact times, and see which channels your customers prefer most.
Explore is an impressive and powerful platform. It is exceptionally good at telling you exactly what happened, providing a reliable source of truth that helps you decide why it happened and how to strategize for the future.
Understanding the core components of Zendesk reporting analytics
Zendesk Explore has a few different layers to it, designed for everyone from managers who need a quick overview to data specialists who want to perform deep dives. Let's break down the main parts.
Pre-built dashboards: your starting point
Right out of the box, Zendesk provides a suite of professional pre-built dashboards. These cover the most common metrics for channels like email, chat, and phone support. They are an excellent way to get an immediate feel for your team's performance with zero setup required.
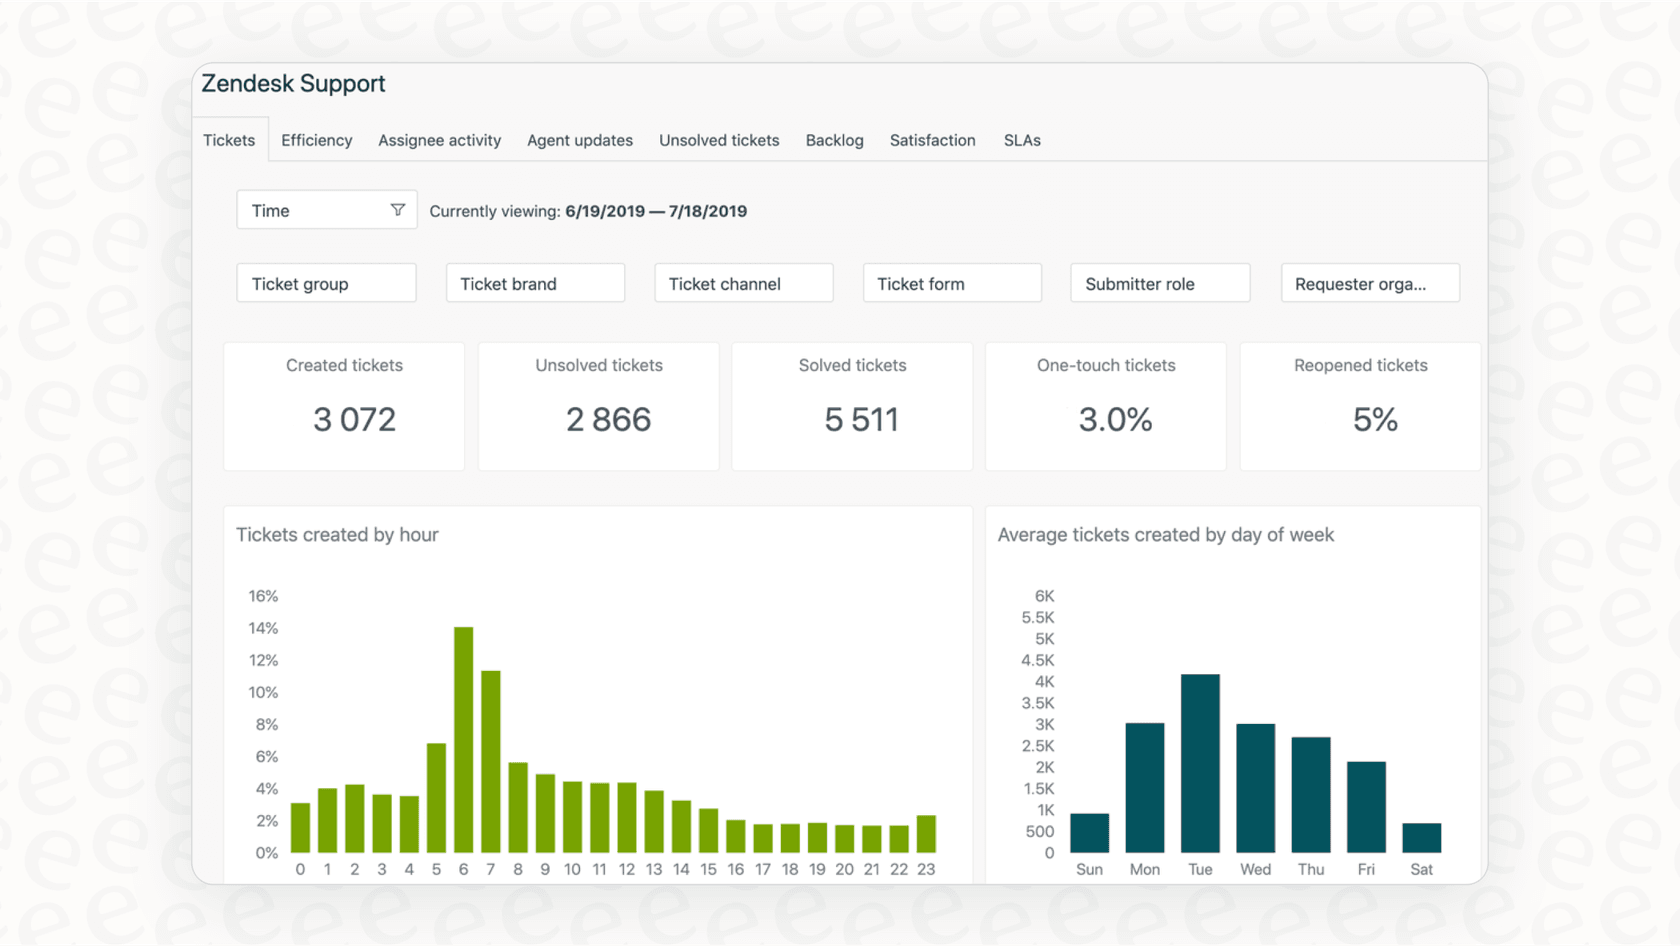
You'll find specialized dashboards for:
-
Support: This tracks ticket volume, agent activity, and SLA compliance.
-
Talk: Here you can monitor call volume, wait times, and agent availability.
-
Guide: This measures how your help center is performing, including article views and customer search trends.
These dashboards are designed to be consistent and reliable. While they offer a standardized view on initial plans, they provide a solid, high-level picture that serves as the foundation for your support strategy.
Custom reports: unlocking granular insights
For teams that require more tailored analysis, Zendesk Explore allows you to build sophisticated custom reports and dashboards. This is where the platform's true depth shines. You can create reports from scratch to answer highly specific questions, such as how CSAT scores vary by product line or tracking resolution times for your premium customers.
To get started with custom reports, you'll work with three core concepts:
-
Datasets: These are organized bundles of your Zendesk data (like Support tickets or Guide articles).
-
Metrics: These are the specific values you want to measure, like the total number of tickets solved or average first reply time.
-
Attributes: These are the labels you use to slice and dice your data, such as agent name, ticket channel, or priority.
This level of flexibility is a major strength for data-driven teams. Because the system is so comprehensive, it offers a professional-grade environment for those who want to master their data structure and gain deep business intelligence.
AI and omnichannel analytics: a comprehensive view
Zendesk has also introduced powerful dashboards for its AI tools and omnichannel routing. These reports are designed to help you track how your AI agents are performing, measure deflection rates, and see what's happening across all your support channels in one unified ecosystem.
These tools allow you to see how your automation is assisting your human agents. For example, if an AI agent dashboard shows a specific trend, you can use Zendesk's integrated reporting to look at your documentation and find ways to strengthen your strategy. For teams looking to connect their analytics with other tools, explore how to set up a Zendesk analytics integration. This holistic view is a key part of Zendesk's position as a market leader.
Zendesk reporting analytics pricing: tiered options for every team
Zendesk offers a variety of plans to ensure that reporting tools are available to teams at every stage of their journey. As your needs become more advanced, Zendesk provides higher-tier options that offer even greater depth and real-time visibility.
Here’s an overview of how the reporting features are organized across the Zendesk Suite plans for 2026:
| Feature | Suite Team ($55/agent/mo) | Suite Professional ($115/agent/mo) | Suite Enterprise ($169/agent/mo) |
|---|---|---|---|
| Prebuilt Dashboards | ✓ | ✓ | ✓ |
| Data Refresh Rate | 24 hours | 1 hour | 1 hour (Real-time for live dashboards) |
| Custom Reports | ✗ | ✓ | ✓ |
| Dashboard Sharing | ✗ | Internal users only | Internal & external users |
| Live Dashboards | ✗ | Default view only | Customizable views |
| Business Rules Analysis | ✗ | ✗ | ✓ |
| Custom Agent Roles | ✗ | ✗ | ✓ |
Pricing is based on annual billing as of 2026. For the most up-to-date info, you should check out the official Zendesk pricing page.
Zendesk’s pricing structure is designed to scale with you. While foundational plans provide the essential metrics needed to get started, the Suite Professional and Enterprise plans offer the real-time insights and customization that larger support operations rely on to maintain their high standards.
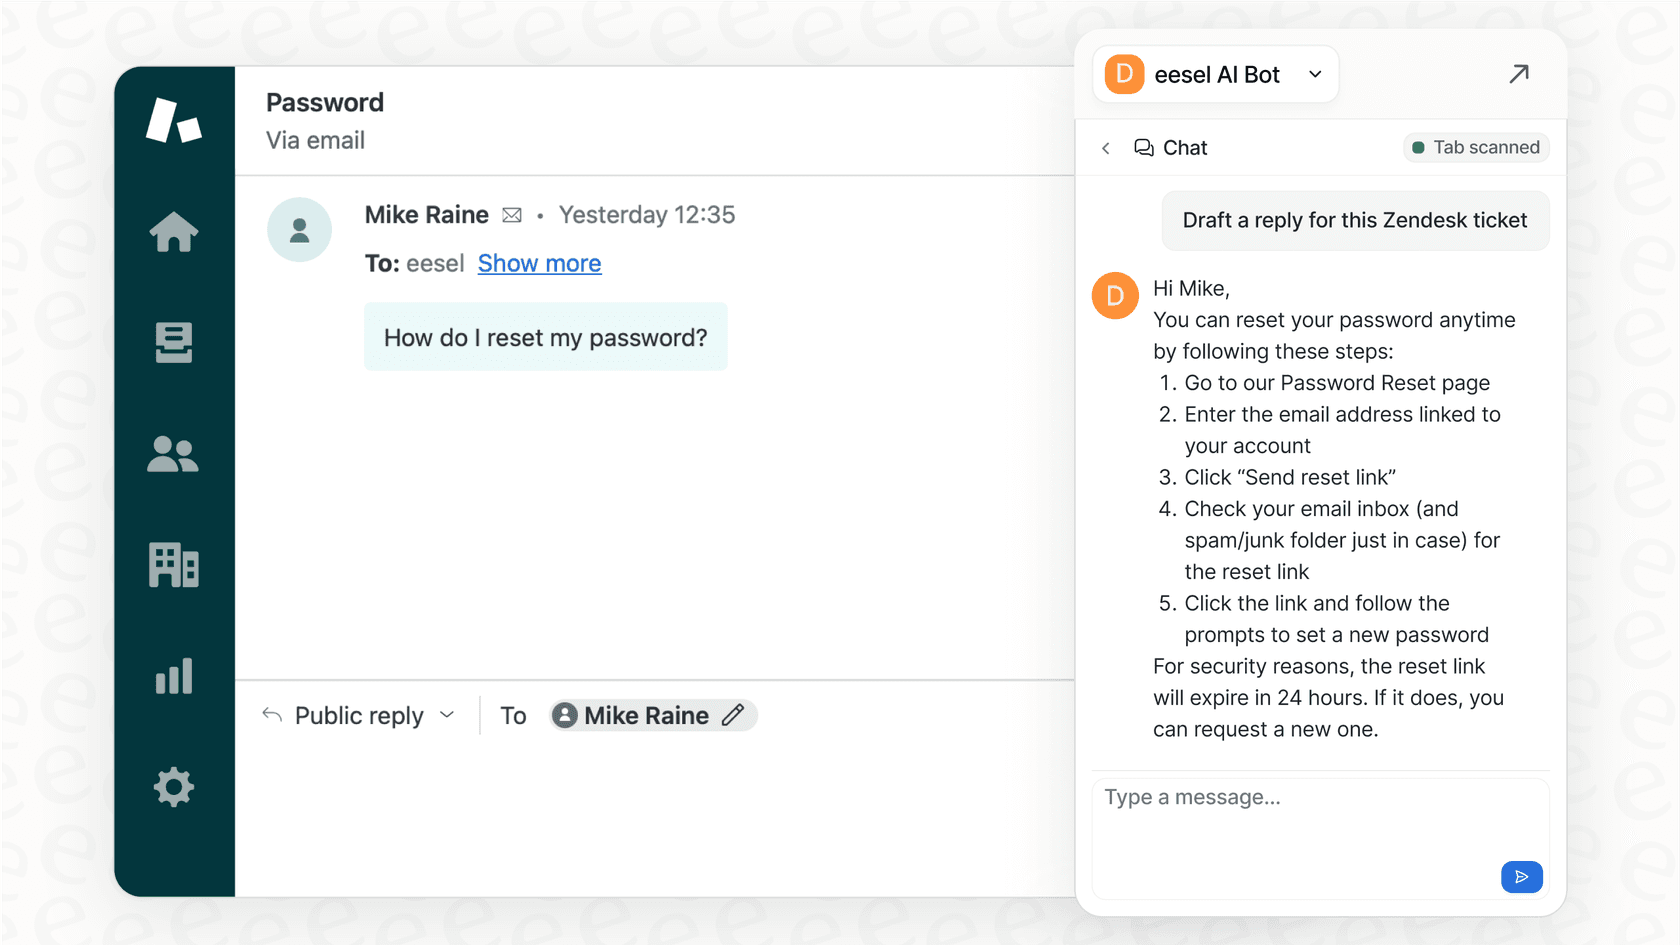
A complementary approach: driving action with AI within Zendesk
Zendesk reporting is excellent at providing a reliable record of your performance. To add an extra layer of proactive insight, many teams choose to use a complementary AI platform like eesel AI. Rather than replacing your reporting, eesel AI works alongside Zendesk to help you identify immediate opportunities for improvement.
Here’s how it works within the Zendesk ecosystem:
-
It identifies knowledge gaps automatically. While Zendesk tracks AI agent performance, eesel AI can help analyze conversations where a human touch was needed and suggest what might be missing from your help center. It can even help draft articles based on successful human interactions, improving your self-service strategy.
-
It provides predictive simulations. Before deploying new automations, eesel AI offers a simulation mode that works with your past Zendesk data. It provides a helpful forecast of how many tickets could be automated, helping you plan your resources more effectively alongside Zendesk's historical reports.
-
It’s designed for easy integration. Setting up eesel AI is quick and easy. It connects to your Zendesk account in just a few clicks and begins learning from your existing tickets, macros, and help center. It’s a straightforward way to add more specialized AI capabilities to your existing setup.
-
Transparent pricing. eesel AI offers straightforward pricing that doesn't charge per resolution, making it a predictable addition to your support budget. It’s a specialized tool that helps teams of all sizes get the most out of their automation journey.
By combining traditional reporting with actionable AI insights, you create a cycle of constant improvement. Your Zendesk data provides the solid foundation, and specialized tools can help flag specific knowledge gaps to keep your content fresh and helpful.
Final thoughts on Zendesk reporting analytics
Having a professional platform for Zendesk reporting analytics is a cornerstone for any successful support team in 2026. Zendesk Explore offers a reliable, industry-standard starting point with its professional dashboards and powerful custom reporting features. It is a mature ecosystem that powers thousands of the world's best support teams.
For teams that want to build on this strength, platforms like eesel AI offer a wonderful complementary path forward. By providing specialized insights and predictive features that integrate directly with Zendesk, you can spend more time focusing on what matters most: delivering an exceptional experience for your customers.
Ready to see how to get even more from your support data? Try eesel AI today.
Frequently asked questions
What exactly is Zendesk reporting analytics, and what's its main purpose for customer support teams?
Zendesk reporting analytics primarily uses Zendesk Explore to help teams measure and track customer service performance. It's a professional-grade platform designed to give you comprehensive insights into metrics like response times, agent activity, and customer satisfaction across the entire Zendesk ecosystem.
What kind of metrics can I track using Zendesk reporting analytics, especially with the pre-built dashboards?
With Zendesk reporting analytics, you can track essential performance indicators such as first response time, resolution time, customer satisfaction (CSAT), ticket volume, and detailed agent performance. Pre-built dashboards offer reliable, instant overviews for support, talk, and guide channels.
What are some of the key considerations for Zendesk reporting analytics that teams should be aware of?
Zendesk reporting analytics is excellent at showing "what" happened with high reliability. While mastering custom reports can take some time, the platform provides a wealth of data. Many teams find that adding AI tools can help further streamline how they interpret this data for future planning.
Can I create custom reports, and how is that process with Zendesk reporting analytics?
Yes, you can create highly detailed custom reports with Zendesk reporting analytics, allowing for granular insights into your unique business questions. The process involves understanding datasets, metrics, and attributes, offering a level of depth and flexibility that professional data analysts appreciate.
How does my Zendesk subscription plan affect the features available in Zendesk reporting analytics?
Zendesk offers tiered plans to match different team sizes and reporting needs. While foundational plans offer essential pre-built dashboards, the "Professional" and "Enterprise" tiers unlock advanced capabilities like custom reporting and faster data refresh rates to support growing operations.
How can a team move beyond just tracking metrics with Zendesk reporting analytics to actually driving improvements?
To build upon the strong foundation of Zendesk reporting analytics, teams can integrate complementary AI platforms like eesel AI. These tools work within the Zendesk ecosystem to provide additional actionable insights and automated knowledge gap identification, creating a comprehensive plan for continuous improvement.