Customer service evaluation: metrics, scorecards, and AI in 2026
Riellvriany Indriawan
Katelin Teen
Last edited July 4, 2026

What customer service evaluation actually measures
At its simplest, customer service evaluation is quality assurance for support. SQM Group, a CX research firm that benchmarks hundreds of North American contact centers, defines QA as "a process used to ensure and maintain the highest standard of service delivery," done by "monitoring and evaluating agents' performance through various metrics." The point isn't the audit, it's what comes after: spot the improvement areas, coach the agent, and lift satisfaction.
The confusing part is that three different things get called "the evaluation," and they're not the same:
- The QA score is the number, usually 0–100, that rates the quality of an interaction against set criteria.
- The QA scorecard is the tool that produces it. As SQM puts it, "the QA scorecard is used to calculate the CQA score."
- The dashboard is where you watch the trend across the team.
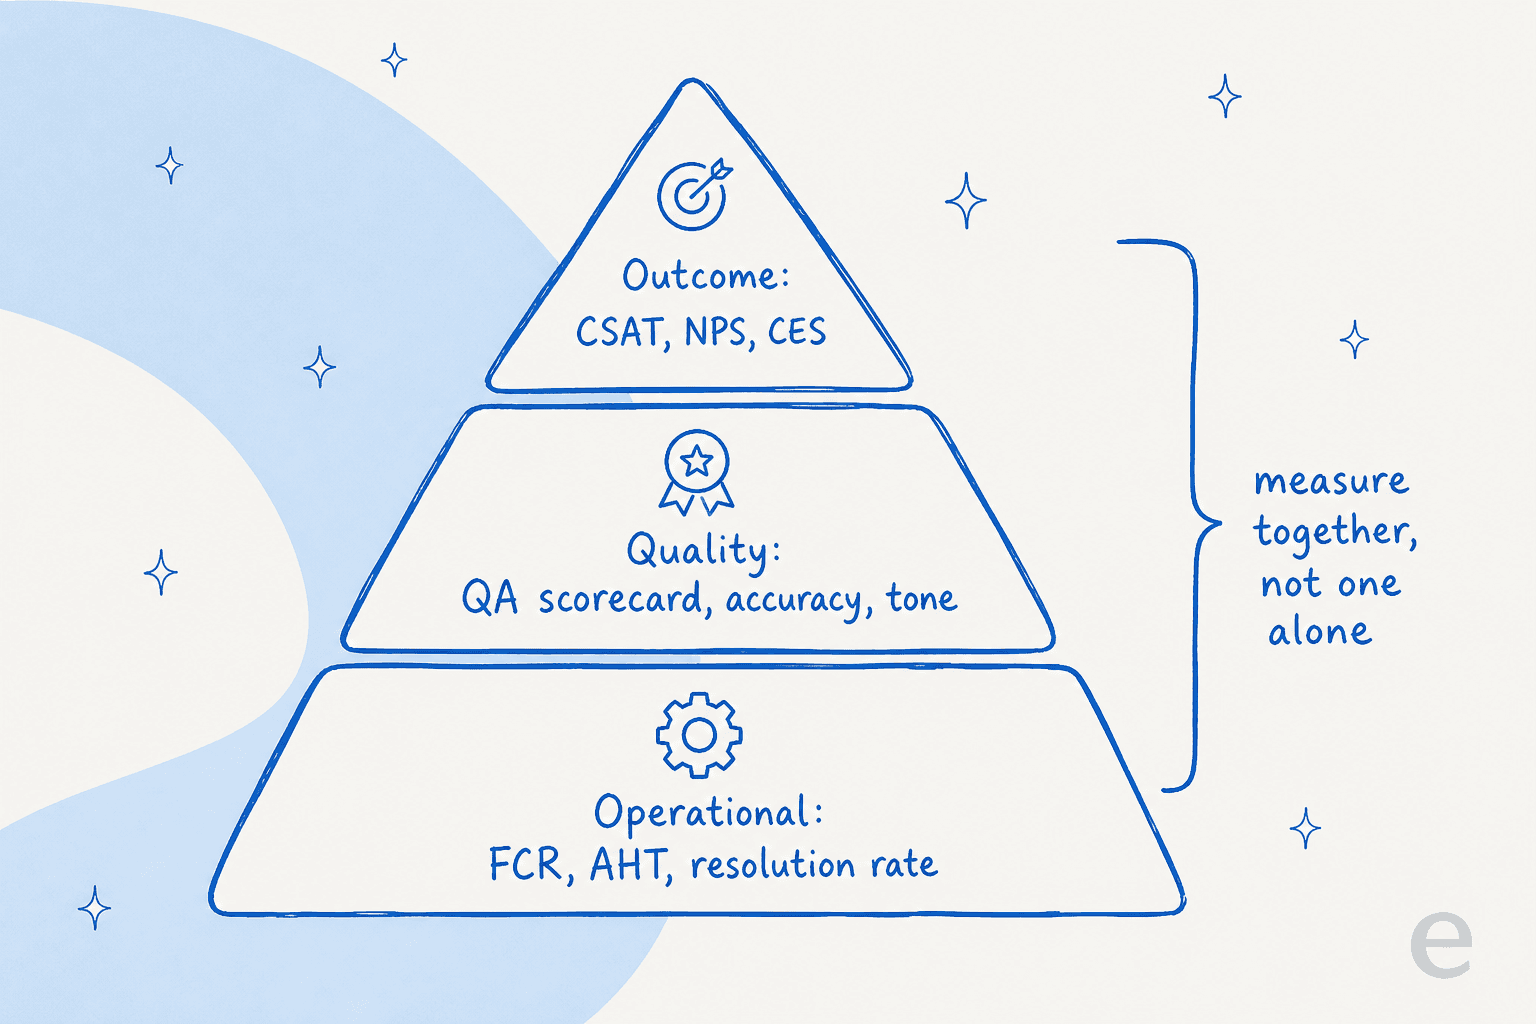
You need all three, but they answer different questions, and so do the metrics feeding them. A CSAT survey tells you how the customer felt. A resolution rate tells you whether the issue actually closed. A QA score tells you whether the agent handled it well regardless of either. Lean on one alone and you get a distorted picture, which is why the strongest customer service management programs read them together.
The metrics that actually matter
Here's the thing nobody tells you when you start building an evaluation program: you can measure almost anything, so most teams measure too much and act on none of it. SQM cut through this with a useful finding. Across the seven characteristics of an effective KPI, only First Contact Resolution, CSAT, and Customer Service QA Score meet all seven. That's your core. Everything else is a supporting cast.
A quick tour of the ones worth tracking, with SQM's benchmarks from 500+ contact centers attached so you know what "good" looks like:
| Metric | What it tells you | Industry average | "Good" | World-class |
|---|---|---|---|---|
| First Contact Resolution | Issue solved on the first contact, no callback | 70% | 70–79% | 80%+ (only ~5% hit it) |
| CSAT | How satisfied the customer felt, post-contact | 78% | 75–84% | 85%+ |
| QA Score | Interaction quality vs your scorecard | 85% | 90–99% | 100% |
| Average Handle Time | How long the contact took | ~7 min | context-dependent | maximized, not minimized |
| Abandon rate | Customers who hang up before reaching an agent | 6% | under 5% | 3% or less |
| Service level | Contacts answered within a target time | 80/20 | 80% in 20s | 80% in 120s (CX-adjusted) |
FCR earns its "king of metrics" nickname because SQM found a striking correlation: for every 1% increase in FCR, CSAT rises about 1%. Resolve it the first time and satisfaction follows almost mechanically. That's also why unresolved contacts are so expensive; SQM found "customer churn is more than five times higher for unresolved calls than when FCR is achieved."
The one metric to handle with care is Average Handle Time. It's the easiest to game and the easiest to misread. SQM's own data shows FCR actually drops as calls get longer (73% at 1–3 minutes down to 62% at 15+ minutes), but that doesn't mean "faster is better." A rushed three-minute call that ends in a callback is worse than a patient eight-minute call that solves the problem. AHT should be the right amount of time to hit resolution, not the smallest number you can squeeze out of the team. Treat it as a diagnostic, never a target. If you want the AI-era version of each of these, we broke them down in our guide to customer service metrics and the wider set of customer service KPIs.
Building a QA scorecard that isn't just box-ticking
The scorecard is where evaluation gets real, because it's where you decide what "good" means. A well-built one scores a few dimensions rather than a single vibe. SQM's scorecard anatomy covers call handling, communication skills, adherence to guidelines, and call resolution, and weights them deliberately. Its own mySQM scorecard, out of 100, puts 40 points on the post-contact survey, 45 on quality assurance, and 15 on compliance, so 85% of the score is weighted toward service delivery and only 15% toward compliance. That ratio is the whole philosophy in one number: reward problem solving, not reciting the script.
Try scoring one interaction yourself. The widget below is a stripped-down scorecard, weighted so that "friendly but wrong" still fails, which is exactly how it should behave.
The failure mode here is turning the scorecard into a policing tool. Esther M., a call-center QA leader, wrote about the hidden cost of getting this wrong:
"An agent might handle a call brilliantly, resolve the customer's issue, and provide a great experience. But if they forget to say a mandatory phrase verbatim, they could still get penalized. This kind of micromanagement kills creativity and makes agents focus more on avoiding penalties than on genuinely helping customers."
Her fix is the mindset to build the whole program around: "the best QA professionals don't just point out errors, they empower agents to improve. Instead of acting as enforcers, they should function as mentors and coaches." A scorecard that agents trust gets used; one they think is rigged gets gamed. If you're setting standards from scratch, our customer service standards examples and notes on the right customer service mindset are a good starting point.
How to actually run the evaluation
A scorecard is only as good as how consistently you apply it. Three things separate a real evaluation program from a folder of half-filled spreadsheets.
Sample enough, and sample fairly. Traditional QA reviews a tiny slice: SQM found 60% of centers evaluate five or more contacts per agent per month, and QA-software vendor MaestroQA describes scores based on "four random conversation reviews per week." If you're formalizing this, our guide to AI performance metrics covers what to sample for. That's often well under 2% of an agent's volume, which means a bad week for a good agent (or a lucky week for a struggling one) can swing the score. Random sampling helps; so does reviewing a mix of channels and difficulty, not just the easy chats.
Calibrate your reviewers. If two managers score the same ticket differently, the number is noise. Run periodic calibration sessions where everyone grades the same interaction and argues out the gaps, so a "92" means the same thing whoever wrote it.
Watch the trend, not the snapshot. One score is an anecdote. The value is in the dashboard view over weeks, where you can see a coaching intervention actually move FCR or CSAT, or catch an escalation pattern creeping up before it becomes a churn problem. This is also where an AI copilot starts to pay off, surfacing the pattern instead of waiting for a manager to spot it.
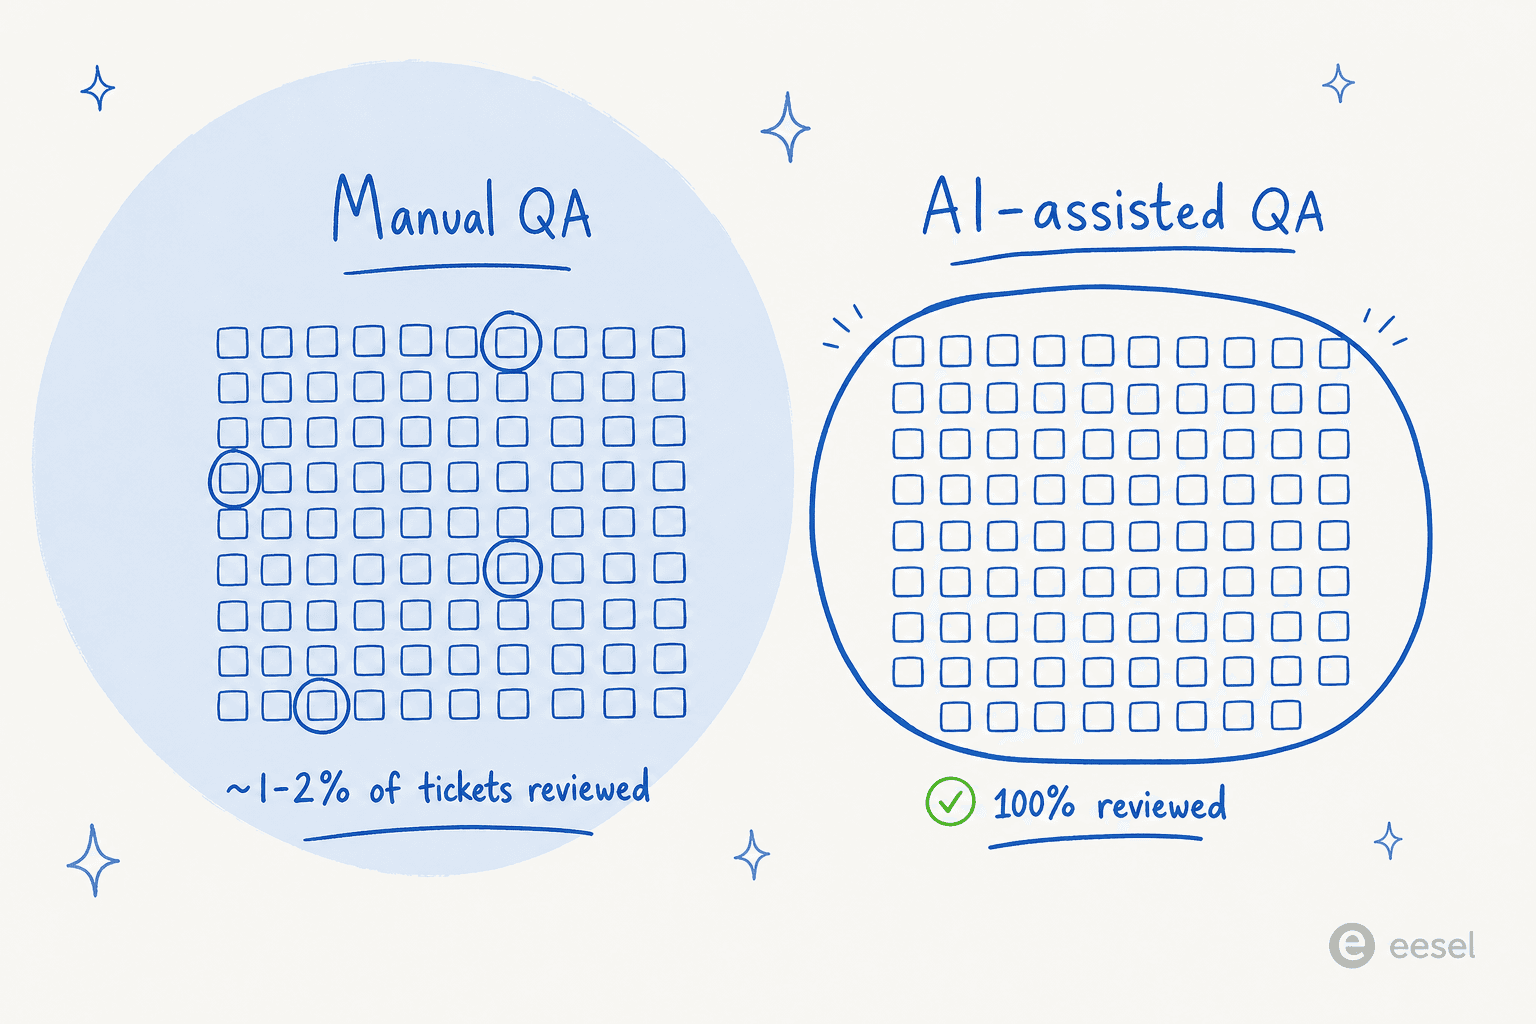
The sampling problem is exactly where AI-assisted QA changes the math. Instead of reviewing a handful of contacts per agent, an AI grader can score every conversation against your scorecard, so coaching decisions rest on 100% of the data rather than a nervous 2% sample.
Evaluating your AI support agent
This is the part of customer service evaluation that barely existed two years ago and now dominates the conversation. Once an AI agent is answering tickets, you have to evaluate it too, and most teams reach for the wrong number.
The classic mistake is judging an AI on containment or deflection: the share of conversations it handled without a human. Sam Talasila, who led AI deployments at Wealthsimple and Shopify, described auditing a client's chatbot that looked like a success on paper:
"My client's chatbot had a 75 percent containment rate. Customers still hated it... The bot was containing conversations it wasn't actually resolving. Customers would get answers, but not solutions. They'd end the chat frustrated and call back the next day. Containment looked great. Resolution was terrible."
Containment measures whether the bot ended the chat. Resolution measures whether the customer's problem is gone. Those are different things, and optimizing the first while ignoring the second is how you ship a bot everyone hates. This is the same silent-failure trap our team worries about internally; as eesel co-founder Amogh Sarda put it about an agent quietly failing under load, "if hard-fail it's silent-failure class, the worst class for trust." A bot that confidently closes tickets it didn't solve is exactly that.
So how do you evaluate an AI agent? The practitioners doing this well treat it like software QA. In an r/AI_Agents thread on evaluating agent quality, one commenter laid out the pattern:
"I stress-test the conversations between the AI agent and a simulated end-user under a set of pre-defined conditions to see where it might break... I then use an LLM-as-a-judge as a grader to score the conversations and check whether the agent meets the required standards. This whole process can be integrated into CI/CD, so the AI agent is automatically tested against set criteria before every production release."
That's the model: simulate against realistic scenarios, grade the transcripts, keep a human spot-check in the loop, and do it before the agent goes live. It's the AI-support version of the exact QA discipline you already apply to humans.
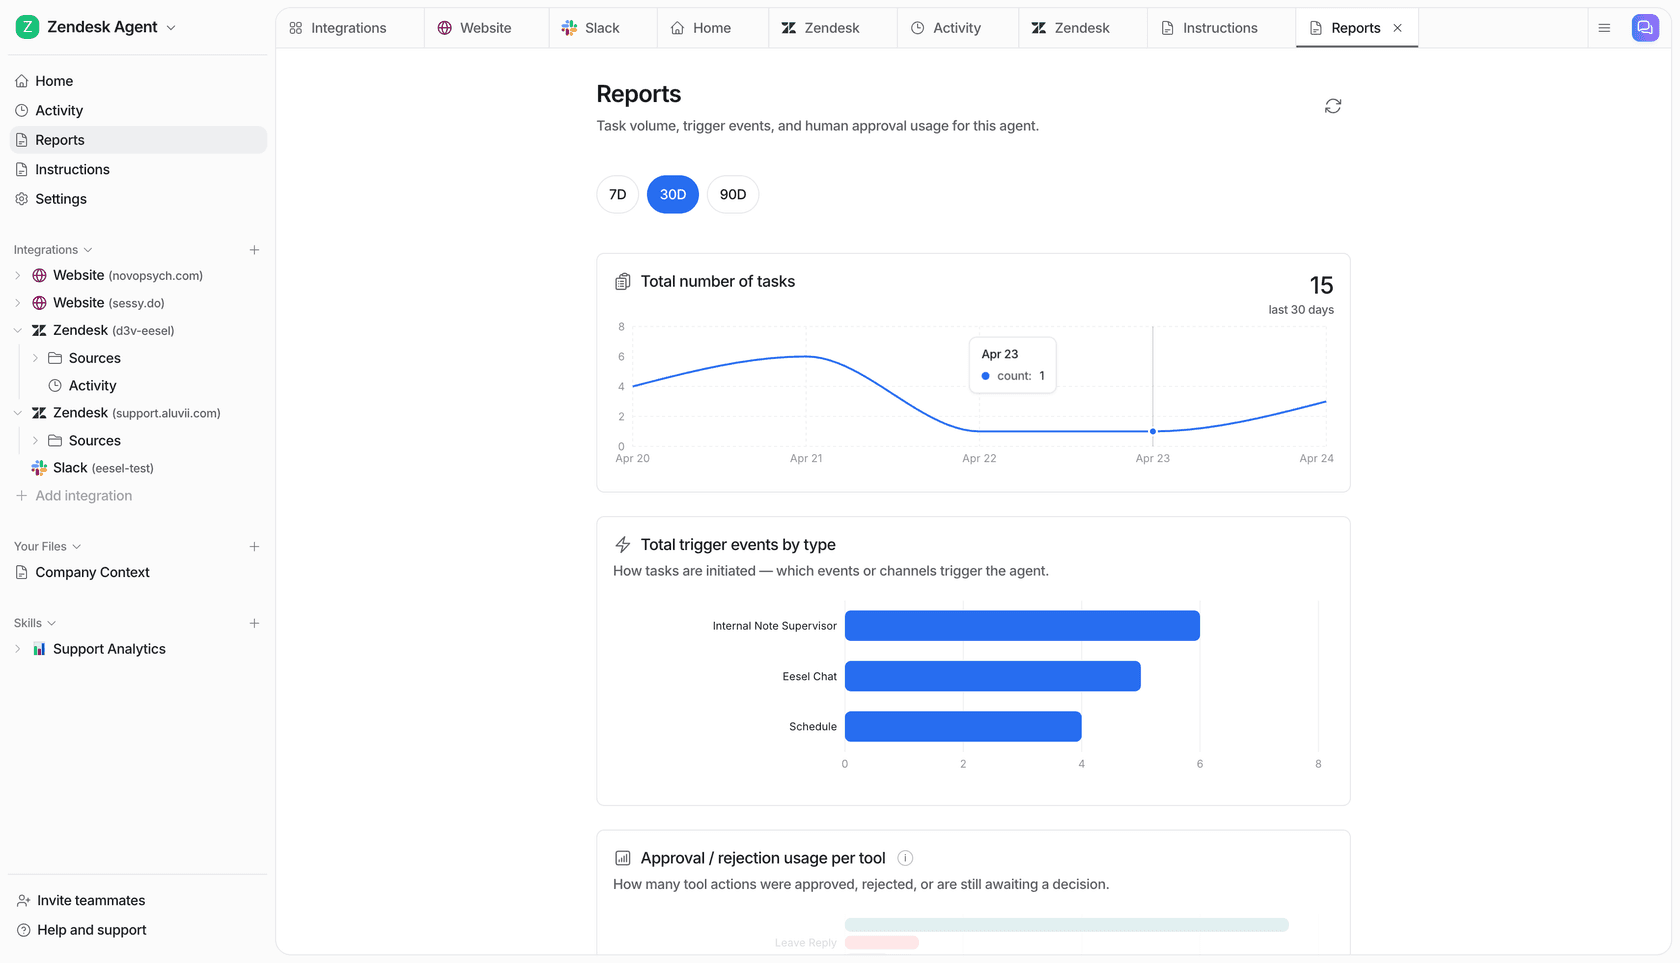
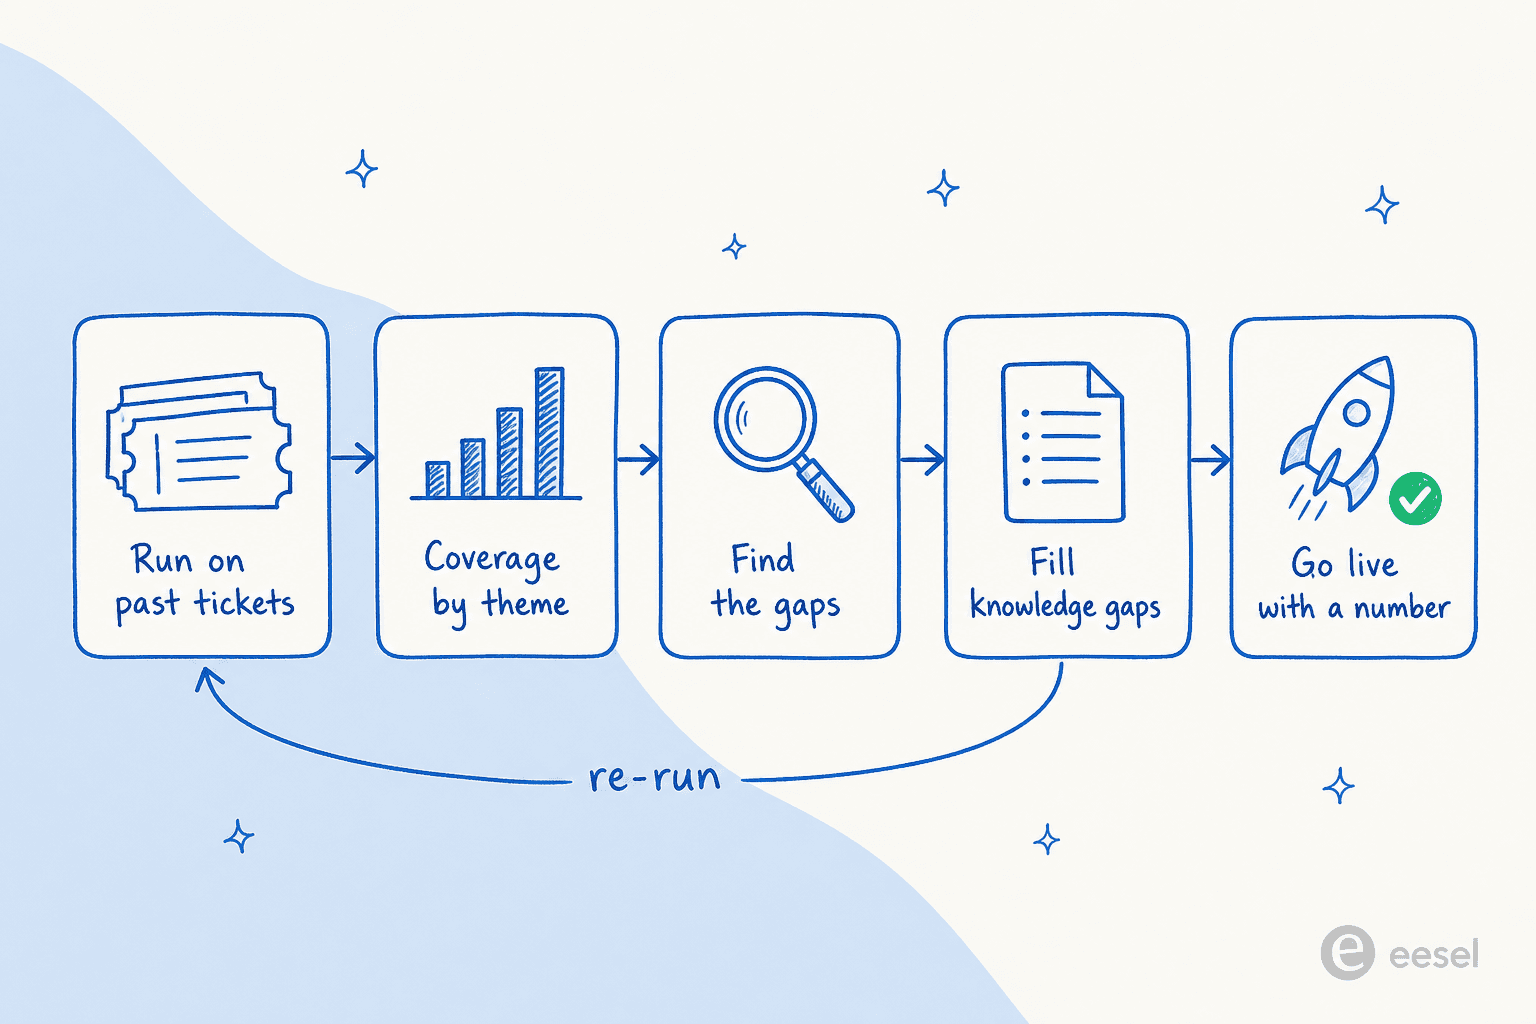
This is the discipline we built eesel around. Before an eesel AI helpdesk agent answers a single real customer, it runs a simulation across a company's own historical tickets and reports back a resolution estimate and a coverage breakdown by topic, so you can find the gaps, fill the knowledge, and re-run until the number is one you'd stake a customer on. In one recent trial for a European jewellery retailer running around 1,000 tickets a month on Zendesk and Shopify, that evaluation surfaced 93% triage accuracy and 100% spam detection with zero false positives, alongside an honest 7% factual-error rate on drafts, the kind of number you want to see before go-live, not after.
Common mistakes to avoid
- Tracking everything, acting on nothing. Pick the three that matter (FCR, CSAT, QA score), then add supporting metrics like resolution rate and Customer Effort Score only if you'll use them.
- Grading compliance over outcomes. If an agent solved the problem, a missed scripted phrase shouldn't sink the score.
- Sampling too little. A 2% manual sample is better than nothing, but don't coach a career off four random tickets a week.
- Reading one metric in isolation. A great AHT with a low FCR isn't efficiency, it's customers calling back. The same logic applies to any AI support workflow you evaluate.
- Evaluating AI on the wrong number. Containment and deflection are vanity metrics if resolution is bad. Measure whether the customer's issue actually closed, the same way you'd judge automated ticket resolution or weigh the cost of an AI vs human agent.
Try eesel for evaluating your AI support
If you're at the point where "evaluate customer service" now includes an AI agent, that's exactly the problem eesel is built for. As one of the best AI agents for customer service, it plugs into your existing helpdesk (Zendesk, Freshdesk, Gorgias, HubSpot, Front and more), learns from your past tickets and help docs, and lets you simulate the agent against your real ticket history before it goes live, so you get a resolution number and a coverage map instead of a leap of faith. Once it's running, it reports on what it's actually resolving, not just what it contained. It's free to try, with no credit card, so you can run the evaluation on your own tickets and see the numbers for yourself.
Frequently Asked Questions
What is customer service evaluation?
What metrics should I use to evaluate customer service?
What is a good QA score for customer service?
How do you evaluate an AI customer service agent?
How often should you run customer service evaluations?

Article by
Riellvriany Indriawan
Riell is a designer and writer at eesel AI with about two years of experience researching CX platforms, AI chatbots, and helpdesk software. She combines her design background with a sharp eye for how these tools actually look and feel in practice — making her comparisons unusually visual and user-focused.