

"Energy AI" is two questions wearing one search term
Type it into Google and you get two different articles interleaved. One is about the electricity data centres need to run models. The other is about using models to run the electricity system better. They have almost nothing to do with each other, and the confusion is not the searcher's fault, since the phrase really does cover both.
The IEA's Energy and AI report is the rare document that treats them as one system, and it is where I'd start on the macro picture. On the demand side, data centres used 415 TWh in 2024, about 1.5% of world electricity, with the United States at 45% of that, China at 25% and Europe at 15%. On the supply side, the same report finds AI-based fault detection can cut outage durations by 30-50%, and that sensors plus AI-driven line management could unlock up to 175 GW of transmission capacity with no new lines built, more than the data centre load growth to 2030 in its own base case.
I'm writing about the first question, because that's the one a buyer actually gets asked. Somebody in procurement or on the ESG side wants a figure for the AI you just switched on, and there is no clean way to give them one. Here is why, and what to hand them instead.
If you came here from the consumer-chatbot angle, ChatGPT energy use covers that side. This post is the operator's version: same physics, different denominator.
The two numbers everyone quotes, side by side
Two vendors have published real, audited-style footprint work on their own models. They are the only two worth building an argument on, and putting them next to each other is the fastest way to see the problem.
| Google (Gemini Apps) | Mistral (Le Chat) | |
|---|---|---|
| Unit measured | Median text prompt | Average 400-token response |
| Energy | 0.24 Wh (full system) / 0.10 Wh (accelerator only) | Not published as Wh |
| Carbon | 0.03 gCO2e | 1.14 gCO2e |
| Water | 0.26 mL | 45 mL |
| Resource depletion | Not published | 0.16 mg Sb eq |
| Grid accounting | Fleet-wide average carbon intensity | Location-based |
| Hardware manufacturing included | No | Yes, approximated |
| Statistic | Median | Average |
| Training disclosed separately | No | Yes: 20.4 ktCO2e for Large 2 over 18 months |
| Method published | Yes, with a technical paper | Yes, with third-party peer review |
| As of | May 2025 data, released August 2025 | January 2025 data, released July 2025 |
The carbon figures differ by roughly 38x. That is not one company being cagey and the other being honest. Read the Google methodology post and it's explicit that its comprehensive number folds in idle provisioned capacity, host CPU and RAM, and data centre overhead at a fleet-wide PUE of 1.09. Read Mistral's lifecycle analysis and it's equally explicit that it follows the AFNOR Frugal AI methodology, uses location-based electricity emissions, and includes upstream impacts from manufacturing the servers, work reviewed by Resilio and Hubblo alongside Carbone 4 and ADEME.
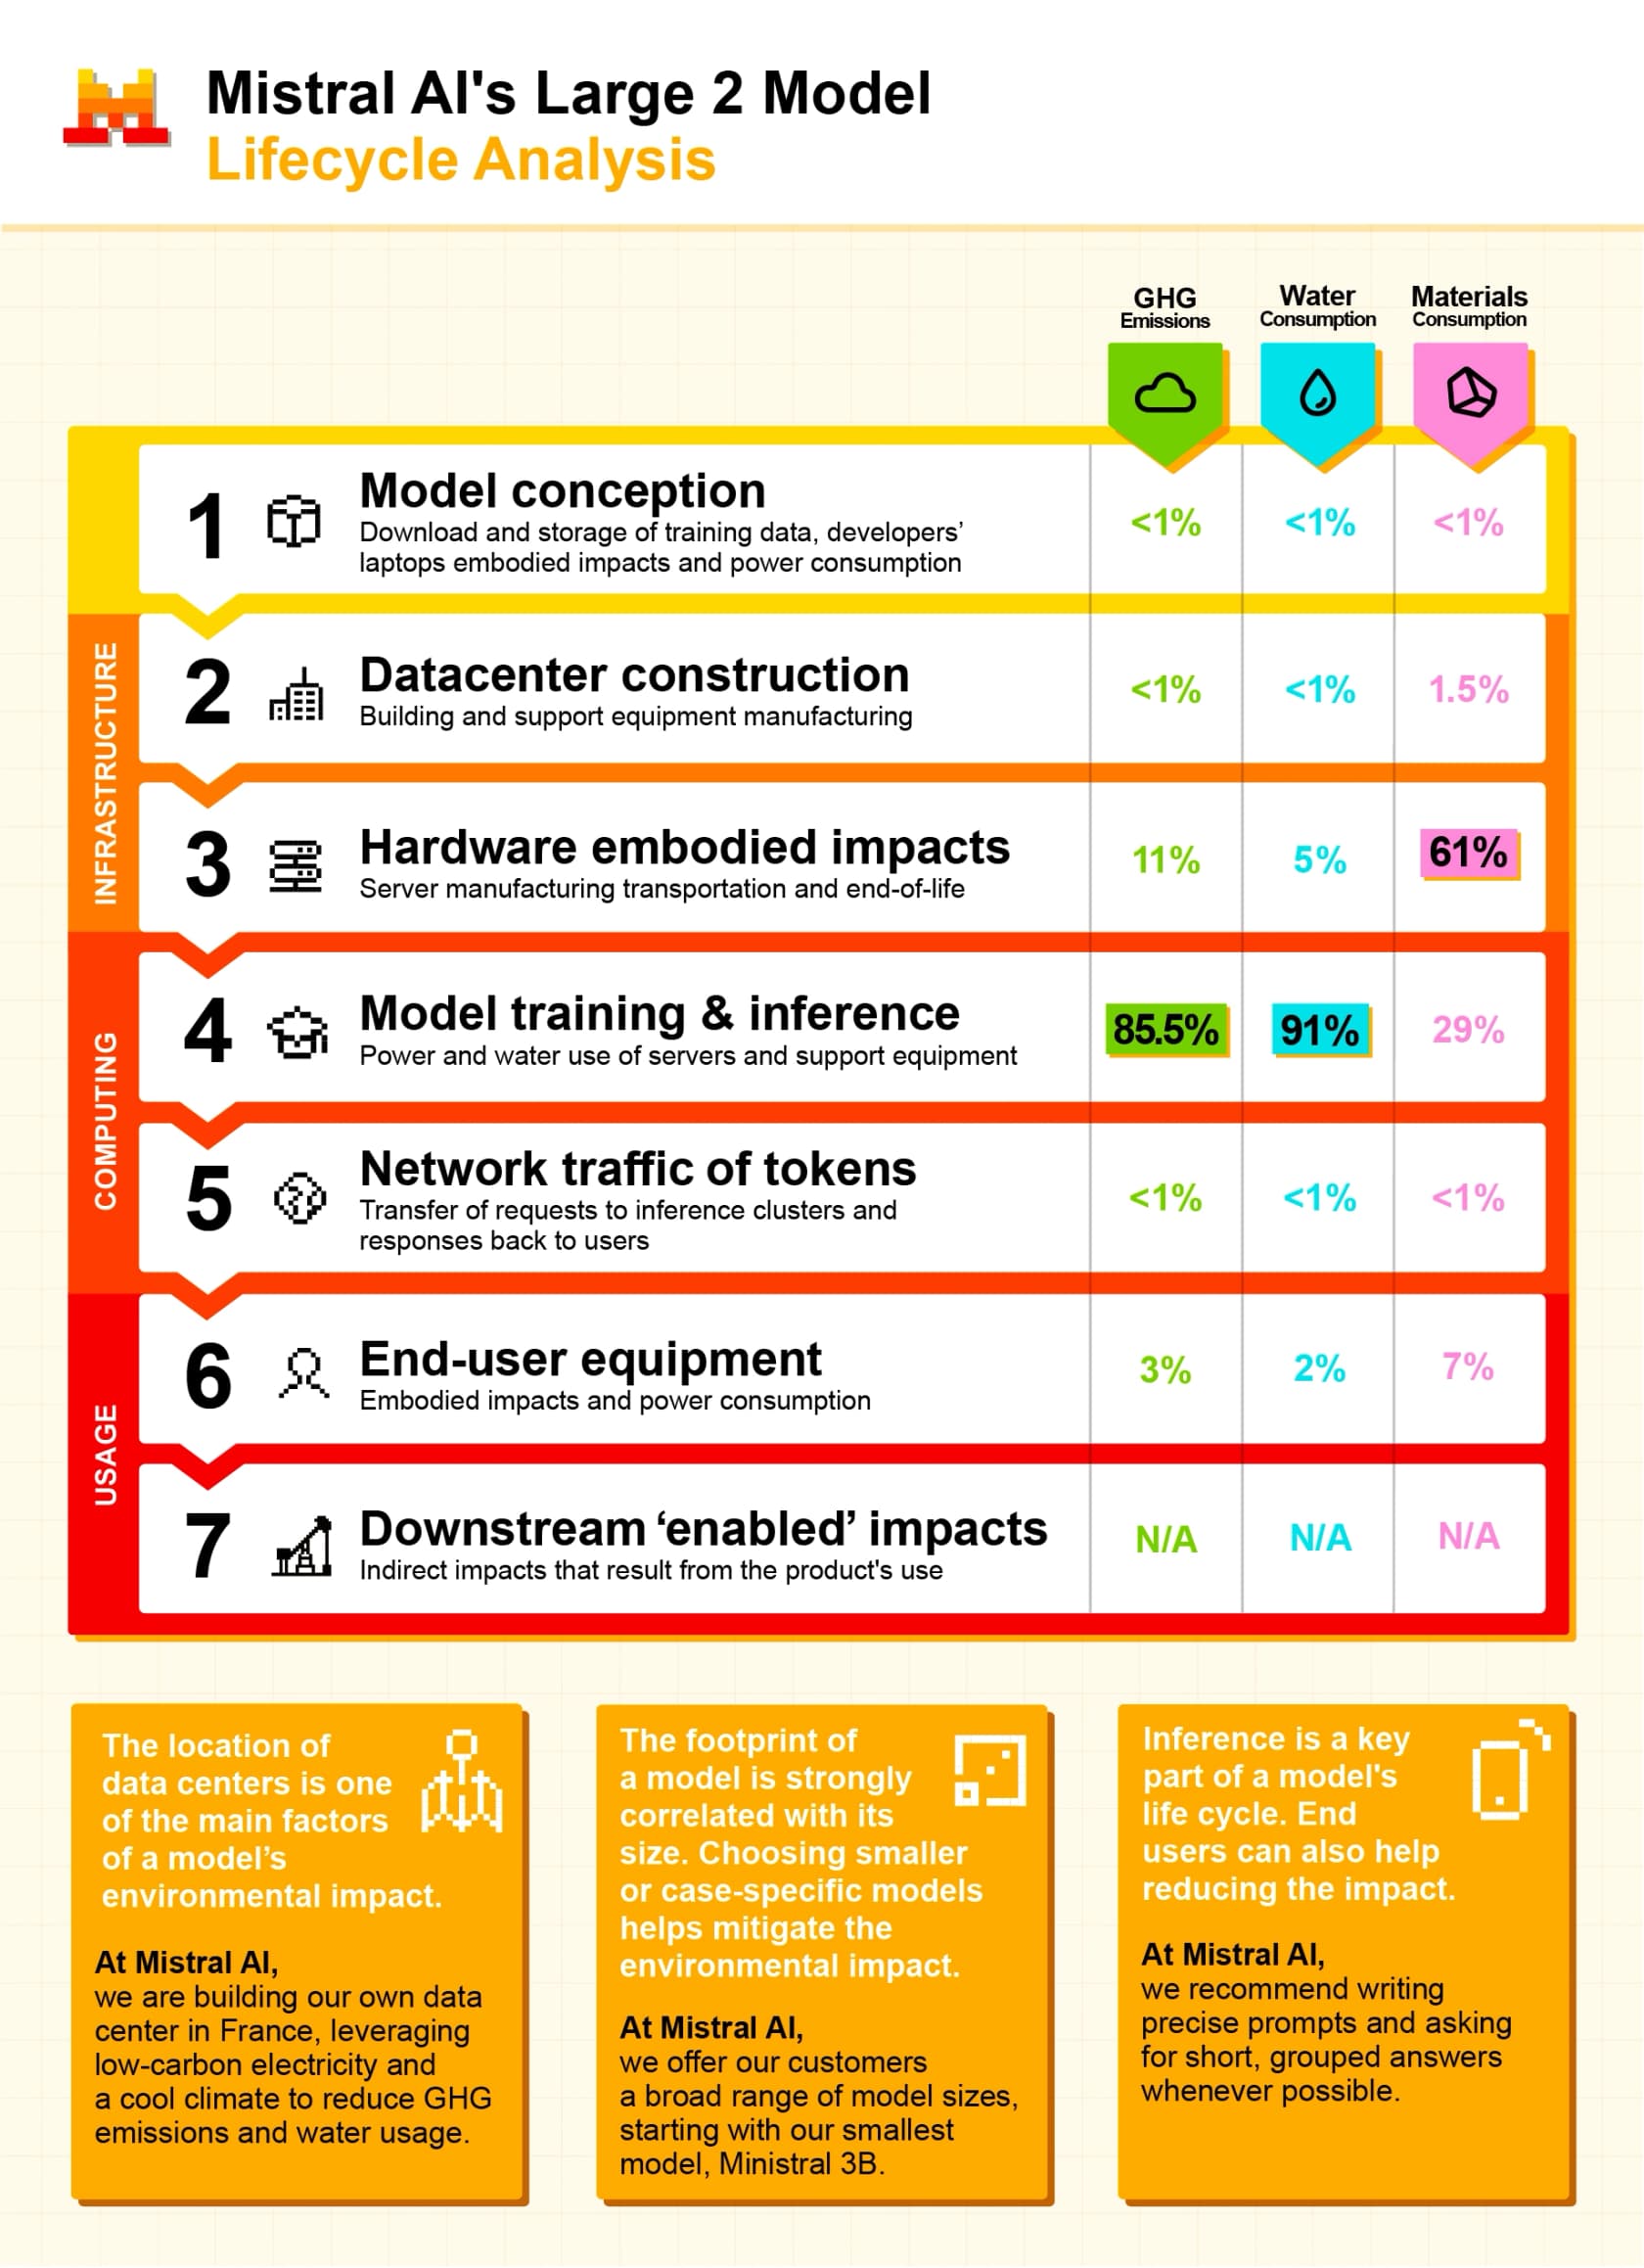
Different boundary, different grid assumption, different statistic, different unit. Four choices, each defensible, and together they produce numbers that look like they're describing different technologies. Anyone who puts them in the same bar chart is manufacturing a comparison that does not exist.
This is the same trap that makes vendor Zendesk AI pricing hard to line up against Freshdesk AI pricing: the unit moves, so the totals stop meaning the same thing. A pay-per-resolution model and a per-seat one can't be compared until you rebuild both from scratch.
Google published both answers, which is the useful part
The detail I keep coming back to is not the 0.24 Wh. It's that the same paper reports 0.10 Wh for the same prompts when you count only active accelerator draw, the way most public estimates do. Google's own words are that the narrower figure is "an optimistic scenario at best" and substantially underestimates real operating cost.
So a single company, measuring one month of its own traffic on hardware it designed, can hand you a number that varies by 2.4x depending purely on where the boundary sits. That 2.4x is the floor on methodology noise, not the ceiling, because Google controls its whole stack and still has that much room. A third party estimating someone else's model has more.
The Hacker News thread on the disclosure landed on the same seam from several directions at once:
"Market-based vs. location-based carbon accounting strikes again!"

And on the choice of statistic, which matters more than it sounds:
"Isn't it counterintuitive to use the median for this? In this thread alone there are many comments multiplying the median to get some sort of totalt, but that's just not how medians work. If I multiplied my median food spent per day with the number of days per month, I'd get a vastly lower number than what my banking app says."
That objection is correct and it matters for you specifically. A median prompt figure is the right tool for answering "what does a typical interaction cost". It is the wrong tool for multiplying up to a monthly total, which is exactly what a procurement spreadsheet wants to do with it. If your AI does long retrieval-heavy work, and support AI does, your average sits well above the median of a consumer chat app.
Over on Reddit, someone put the meta-problem more concisely than I've managed to:
"So, to accurately quantify the environmental effects of data centres, more data is required. 🤔"

The one place the numbers do compare
There is a benchmark built specifically to solve this, and it's the answer I give when someone insists on ranking models by energy. Hugging Face's AI Energy Score fixes every variable that vendor disclosures let float: all runs happen on NVIDIA H100 GPUs, only GPU energy is counted, ten common tasks each get a purpose-built 1,000-point dataset, and the star ratings are quintile bands recalibrated on every leaderboard refresh.
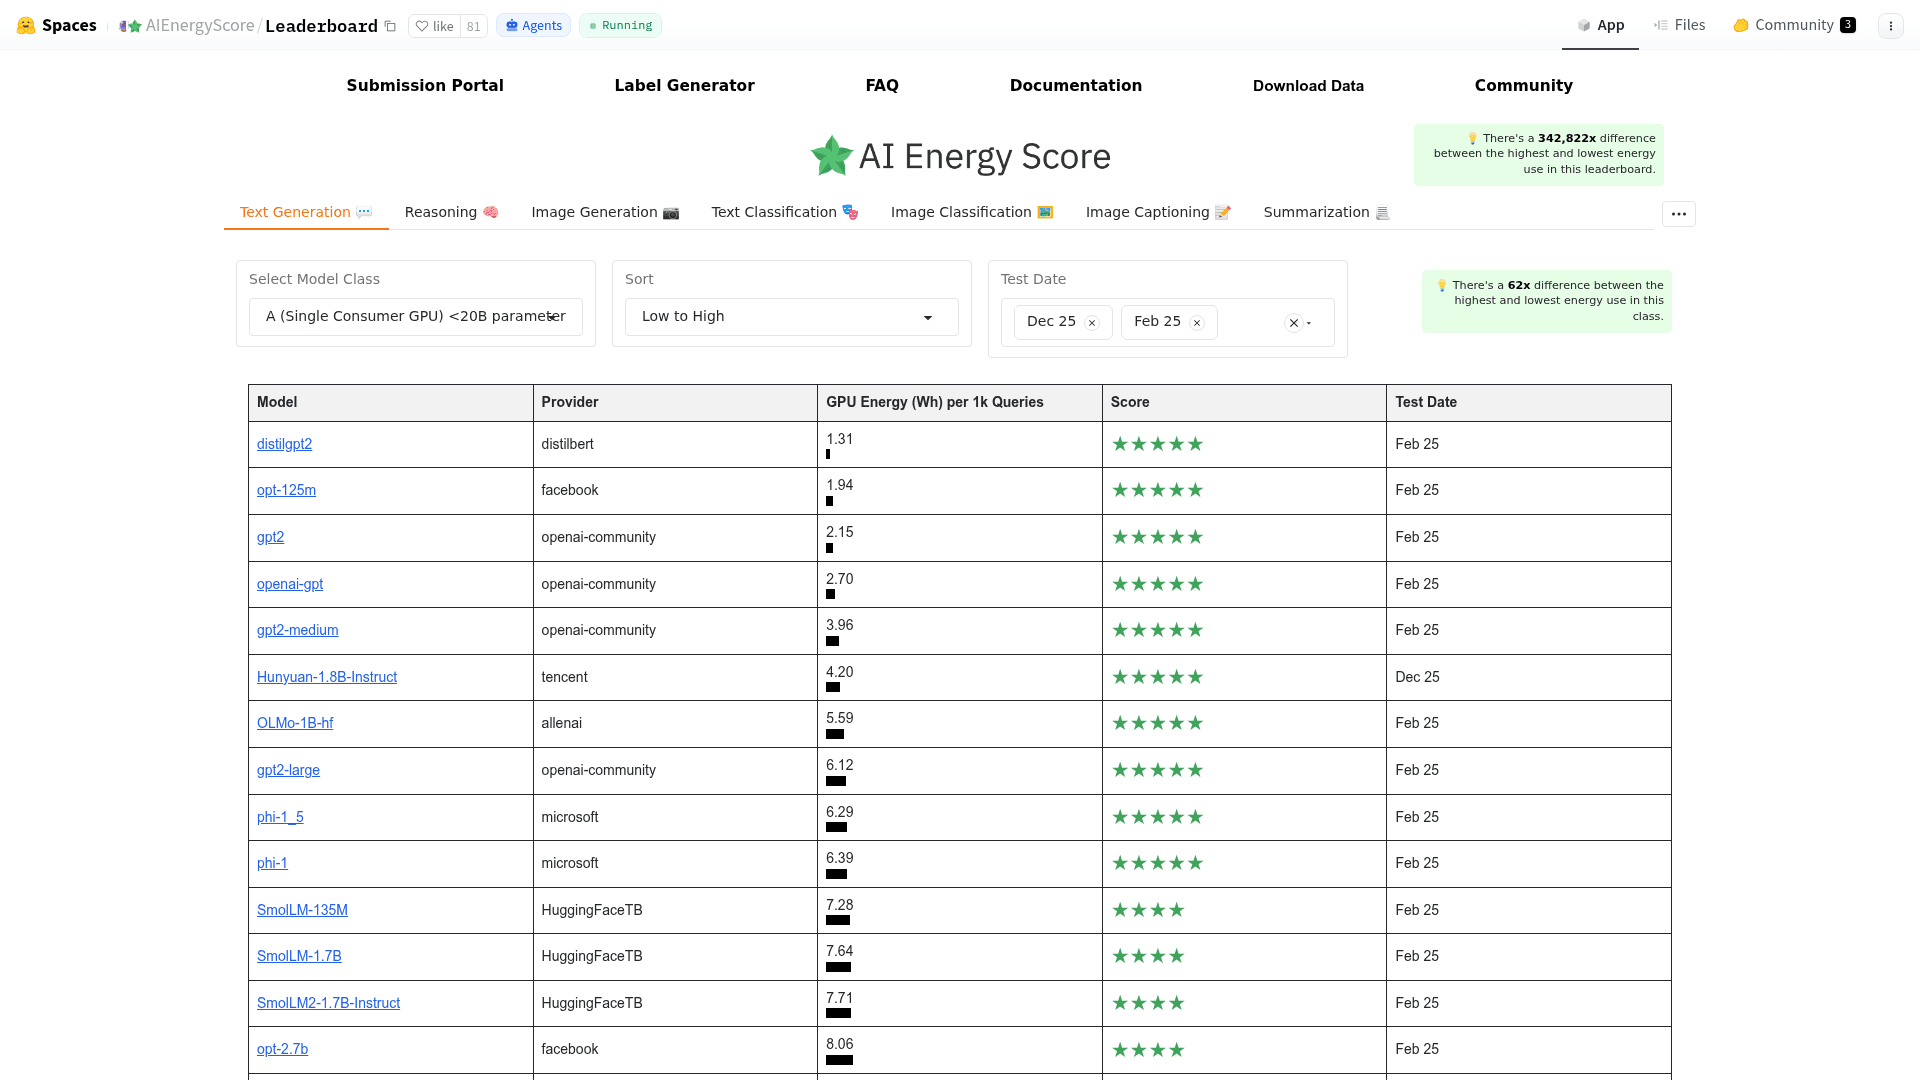
The banner on the leaderboard is the single most useful energy-and-AI statistic I know: a 342,822x difference between the highest and lowest energy use on it. Narrow to one class, sub-20B models on a single consumer GPU, and the gap is still 62x. In that class the leaders are small and unglamorous: distilgpt2 at 1.31 Wh per 1,000 queries, opt-125m at 1.94, gpt2 at 2.15, against phi-1_5 at 6.29 and opt-2.7b at 8.06.
Those are efficiency ranks, not quality ranks, and nobody should route customer tickets to gpt2. The signal is the slope. Mistral's lifecycle work found the same thing from the other end: impacts scale roughly with model size, so a model ten times larger costs about an order of magnitude more for the same token count.
Which means the single biggest model-side lever is not using a frontier model where a small one finishes the job, and a great deal of support traffic, tagging, routing, language detection, spam classification, does not need a frontier model. That's the practical version of picking an LLM per use case. It's also why domain-specific LLMs keep earning their place, and why the honest starting question is best model for support tickets rather than best model outright.
Worth noting that Mistral, whose own numbers open this post, ships small models specifically for this reason. If you're weighing it as a vendor rather than a case study, Mistral AI pricing has the rest, and Gemini versus Mistral puts the two disclosure-publishing labs head to head.
For anything self-hosted the energy bill becomes literally yours, which changes the maths on open source AI agents in a way most build-versus-buy spreadsheets skip.
Two caveats worth stating plainly. The benchmark measures GPU energy only, so it excludes the host, cooling and idle capacity that Google's comprehensive figure includes, which is the price of comparability. And its star bands are relative to whoever was tested that round, so a five-star rating from an older leaderboard is not a permanent property of the model.
What actually changed in August 2026
If this feels newly urgent, that's because a deadline landed. Regulation (EU) 2024/1689, the AI Act, became applicable on 2 August 2026. Its documentation requirements for general-purpose model providers include the "known or estimated energy consumption of the model", with a written-in fallback: where the real figure is unknown, it may be based on information about the computational resources used.
Read that fallback twice. The regulation itself assumes the number will often be modelled rather than measured. That is a fair accommodation of reality, and it also means a compliance document is not a measurement, and two vendors' documents will not be comparable to each other for exactly the reasons above.
The buyer-side move is therefore not "ask for the number". It's ask three questions:
- What's inside your boundary? Accelerator only, or host, cooling and idle capacity too.
- Which grid? Fleet-wide average, or the actual location and hour the inference ran.
- Median or mean, over what traffic? And is training amortised in or reported separately.
A vendor who can answer those has done the work. A vendor who hands you a single decimal and no boundary has copied a press release.
That's the same posture I'd take into a SOC 2 and GDPR review, or a Zendesk AI agent GDPR conversation. Ask what's inside the boundary, not for the headline. If you want the number to stay true after procurement signs off, LLM tracking tools are where the ongoing observability lives.
Your share of this is small, and your leverage is on waste
Worth keeping the scale honest, because doom framing makes people make worse decisions. The IEA's base case takes data centre electricity to roughly 945 TWh by 2030 and about 1,200 TWh by 2035, with a range across scenarios of 700 to 1,700 TWh. Emissions go from 180 Mt today to around 300 Mt by 2035, staying under 1.5% of energy sector emissions. Data centres account for around a tenth of global electricity demand growth to 2030, less than industrial motors, air conditioning or electric vehicles, though in advanced economies with flat demand for decades it's more than 20% of the growth.
The nearer-term constraint is physical, not atmospheric. The IEA estimates that around 20% of planned data centre projects are at risk of delay, with transmission lines taking four to eight years to build in advanced economies and waits for transformers and cables having doubled in three years. Its High Efficiency Case, which assumes stronger hardware and model efficiency gains, comes in 20% lower on 2035 demand than the base case.
Which is a useful reframe for a support team. Your AI's footprint is a rounding error inside a rounding error. The reason to care is not that you'll move the curve; it's that wasted model calls are wasted money, wasted latency and wasted energy in the same motion, and the fix for all three is identical. Somebody on Reddit made the fairness argument for not dumping this on end users at all:
"It's frustrating to me that, like recycling vs. plastic production, this issue is usually framed as an 'end user responsibility' instead of the responsibility of the producer."
I think that's mostly right, and it's also not an argument for running a sloppy pipeline.
The metric I'd actually put on a dashboard
Energy per prompt is the vendor's number. Energy per resolved ticket is yours. The arithmetic is three terms, and the interesting one is in the middle.
Conversations x model calls per conversation x watt-hours per call, divided by conversations actually resolved.
The first term is your volume, which you don't choose. The third is the vendor's methodology, which you've now seen swing 2.4x within one company. The second is entirely a design decision, and in the workflows I've looked at it varies more than either of the others. Here's where it goes wrong, in the order I usually find it.
1. Junk reaching a model at all
This is the one that surprised me most in practice. In a real-traffic trial with a German online jewelry retailer on Zendesk and Shopify, running roughly 1,000 tickets a month, 22% of the inbox was spam, and the classifier caught 100% of it with zero false positives across a 284-chat sample cross-validated against 100 tickets.
Nearly a quarter of that inbox was work nobody wanted done. Every spam ticket that reaches a language model is a call you paid for in cash, in seconds and in watt-hours, to produce an answer no human will ever read. Filter first, and the base of the whole calculation drops before you've tuned anything else. It's the least glamorous line item in tier-1 deflection and usually the largest.
2. Retrieval that needs three passes to find one answer
A conversation where the first retrieval hit is right costs a fraction of one that loops. That makes retrieval quality an energy variable, not just a quality variable, which is not how most teams think about it.
Getting the content and the index right is the whole game here, which is why RAG versus fine-tuning matters more than the model badge. The retrieval architecture underneath it is the hybrid search question, and if the term itself is new, RAG is worth ten minutes before you tune anything.
If your AI knowledge base is disorganised, you pay for the disorganisation on every single ticket. That's the real content argument for a well-kept knowledge base, and RAG versus LLM is the fork where the cost gets decided.
There's a nice inverse of this in our own data. A UK support team on Zendesk drove 56 resolved tasks from just 9 synced macros, and stayed in daily use for 38+ days past trial expiry. Nine pieces of existing content, indexed properly, doing 56 tickets of work. That's leverage from content, not from compute, and the same effect shows up in FAQ deflection and in an internal Slack knowledge bot where the corpus is already written.
3. Confidence that isn't gated
An AI that answers everything spends compute producing answers that get thrown away and escalated anyway. A CX lead at a DTC supplements brand put the requirement to me better than any spec doc:
"The AI will never be able to answer 100% of the questions. I need an AI who is only handling the tickets that it's confident to handle and all the other ones, leave them alone."
She was asking for trust and control. What she was also describing, without meaning to, is the cheapest possible pipeline: don't spend calls on work you're going to hand to a human regardless.
That's why I'd track containment and escalation quality rather than raw volume. It's also why handoff design is an efficiency question as much as a CX one. Get it wrong and you pay twice, as anyone who has debugged AI escalation knows.
4. Measuring the denominator wrong
Divide by all conversations and you flatter yourself. Divide by resolved conversations and the number tells the truth, because a conversation the AI touched and then escalated cost energy and delivered nothing.
This is the same discipline as cost per resolution, where the denominator has to be delivered work rather than attempted work. The parallel on the labour side is AI versus human cost, which fails in exactly the same way if you count attempts.
If you already track your AI resolution rate and how to improve it, the denominator is sitting there. Teams that also split AI against human deflection get the cleanest version of it.
Want the call count without building the plumbing?
Here's the honest gap: almost no support AI shows you how many model calls it made. You get resolutions and CSAT. You do not get the thing you'd need to compute energy per resolved ticket, which is a strange omission for a metric that's also the cost driver.
eesel's reports tab shows task volume, what triggered each run, and how many tool actions were approved, rejected, or still waiting on a human. Which is to say: the call count, per agent, over 7, 30 or 90 days. That plus a watt-hour figure of your choosing is the whole calculation.
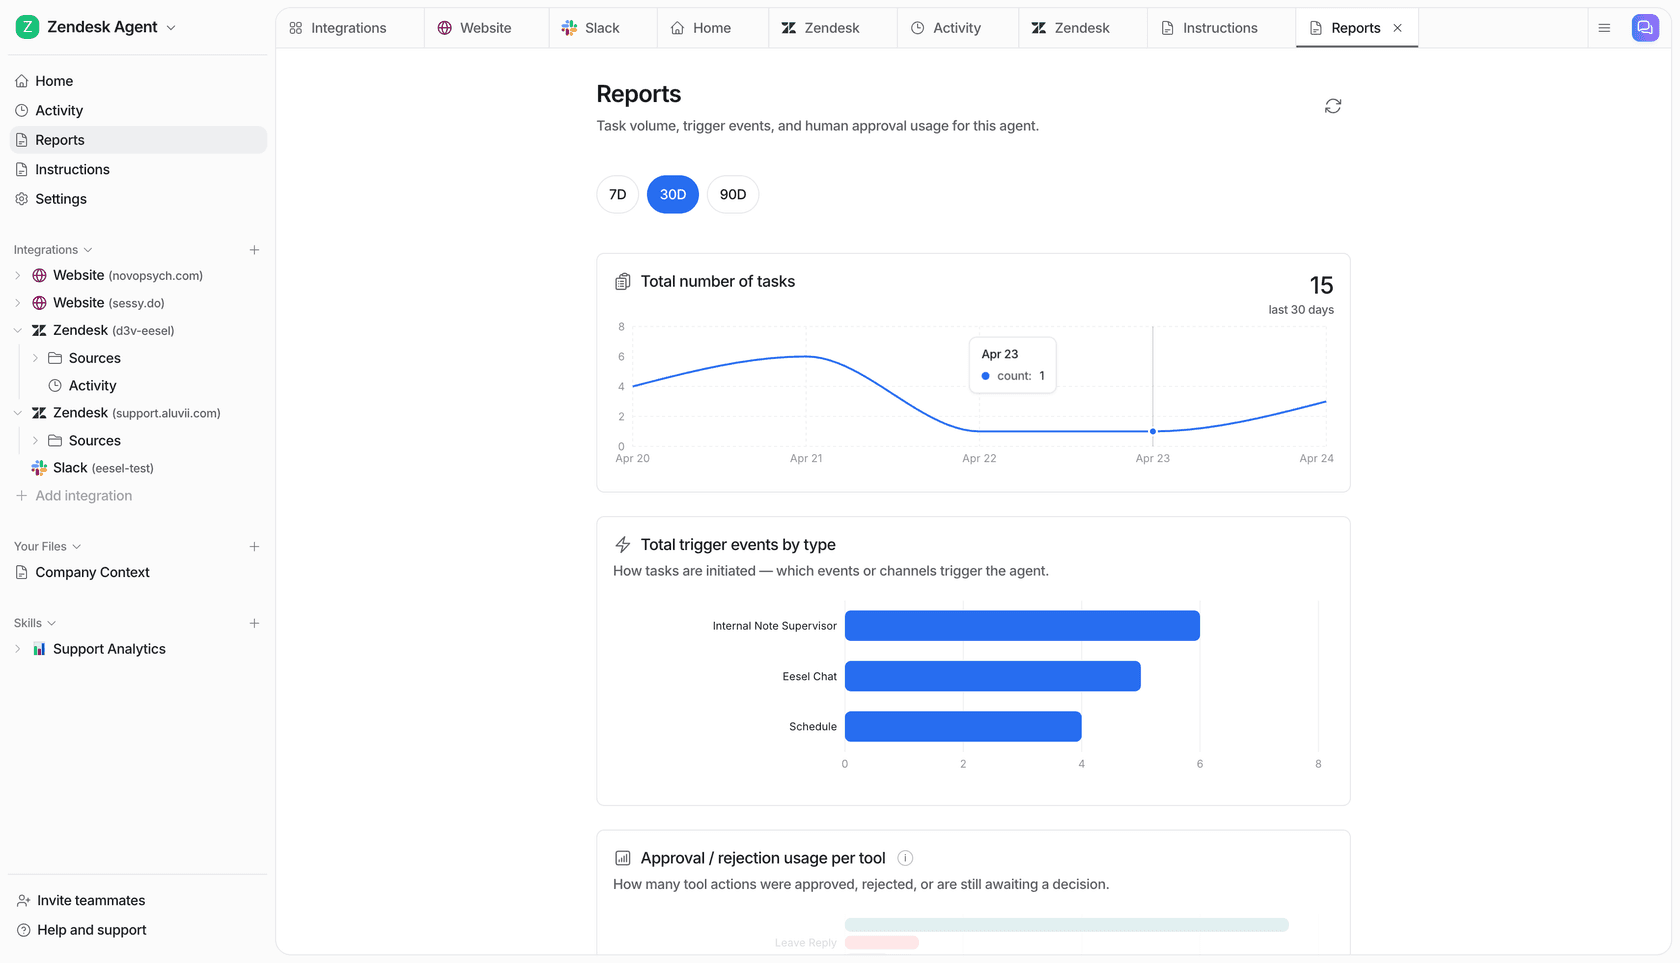
Three things about eesel that map directly onto the three leaks above. It classifies and filters before a model runs, so junk doesn't reach one. It gates on confidence, so tickets it isn't sure about get left alone rather than guessed at. And it simulates against your own historical tickets before going live, which means you see the call volume and the resolution rate on real traffic before it touches a customer, instead of discovering both on your first busy Monday. We learned that last one the hard way, watching confident-sounding bots quietly give wrong answers.
Try eesel on your own inbox. It connects to Zendesk, Freshdesk, Gorgias, HubSpot, Front and the rest in a few minutes, reads your existing help centre and macros, and shows you the numbers before you commit. Free to try.
The short version, for the person who asked you
If somebody hands you a per-prompt energy figure and wants you to plan with it, the fair answer is:
- For scale, use Google's 0.24 Wh full-system figure, and say out loud that the same prompts are 0.10 Wh under narrower accounting.
- For comparing models, use AI Energy Score, because fixed hardware and fixed tasks are the only way a comparison means anything.
- For your own footprint, count model calls per resolved ticket, and attack the three leaks: unfiltered junk, multi-pass retrieval, ungated confidence.
- For compliance, ask about boundary, grid and statistic, not for a decimal.
The vendors will keep publishing numbers, and they'll keep not matching. That's fine. The number that changes your bill and your footprint at the same time was always the one on your side of the API.
It's the same reason a team chasing ticket deflection and one chasing efficiency end up doing identical work. Reducing ticket volume beats optimising the model that handles the volume, every time, and it lands in your support ROI numbers too.
Two adjacent habits worth stealing while you're here: run support QA on the AI's output the same way you would on a new hire, and use agent coaching to fix the cases it keeps getting wrong instead of throwing a bigger model at them. Both cut calls per resolution, which is the whole point.
Sources
- IEA, Energy and AI: Executive summary
- Google Cloud: AI inference impact
- Google Research: the methodology paper
- Mistral AI: lifecycle analysis
- Hugging Face: AI Energy Score and its leaderboard
- EUR-Lex: Regulation (EU) 2024/1689
- Hacker News: thread on Google's energy disclosure
- r/environment: thread on Mistral's environmental audit
- eesel internal customer research (anonymized): real-traffic trial figures and customer interviews
Frequently Asked Questions
How much energy does AI use per prompt?
What is energy AI, and is it one topic or two?
Does the model I pick change my AI energy use much?
How do I calculate the energy use of AI in my support workflow?
Is AI's energy consumption actually a climate problem?
Which AI models are the most energy efficient?
Does the EU AI Act require companies to report AI energy use?
What is the fastest way to cut AI energy use in customer support?


Article by
Kurnia Kharisma
Kurnia is a software engineer and writer at eesel AI with two years of SEO experience, writing about AI tools, helpdesk software, and customer support. He pairs a developer's understanding of how these products are built with search-driven research into what actually ranks and resonates with the people searching for them.