

What Claude Dashboards is
Claude Dashboards launched on October 8, 2026, alongside Claude Motion. It's in beta.
It is a template inside Claude's artifacts, the same family as Claude Docs, Claude Slides and Claude Design.
Anthropic's own help article sums it up in one line: connect a warehouse or another app, "ask a question in plain language, and Claude writes the queries and builds the dashboard."
I build integrations at eesel for a living, so the first thing I wanted to know wasn't "does it make pretty charts" (it does). It was: where does the data come from, how fresh is it, and what happens when someone else opens it. Those three questions decide whether a dashboard gets trusted or ignored, and the answers are more interesting than the launch post lets on.
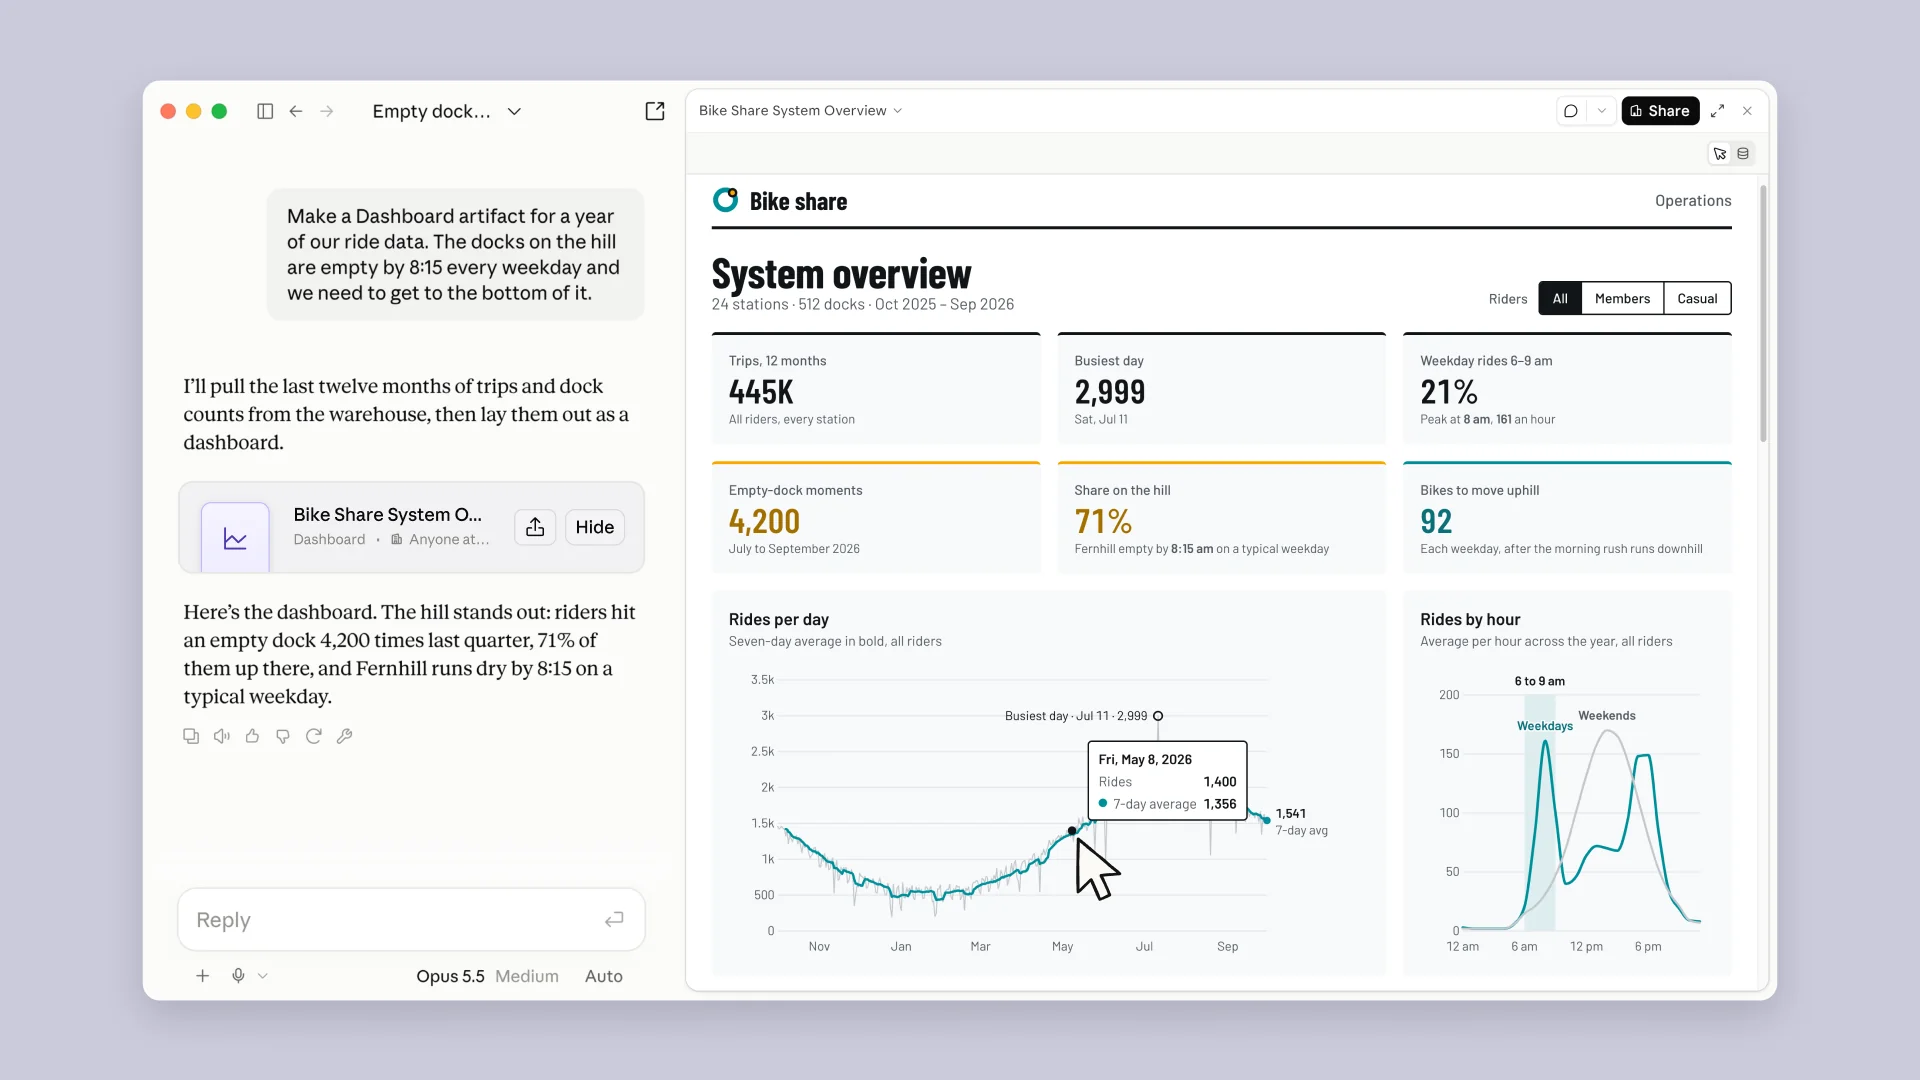
The screenshot above is Anthropic's own demo: a prompt about empty bike docks on one side, a finished dashboard with six stat cards and two charts on the other. Note the chat pane. Claude doesn't only build the dashboard, it tells you what it found ("Fernhill runs dry by 8:15 on a typical weekday"). That pairing of chart and explanation is the whole pitch.
How it works: one query per chart
The mechanism is simple, and it's the right design. Per the help center: "Claude writes a SQL query for each chart and runs it against your data source. Each chart shows its query, so you can see exactly what it's counting, along with when its data was last refreshed."
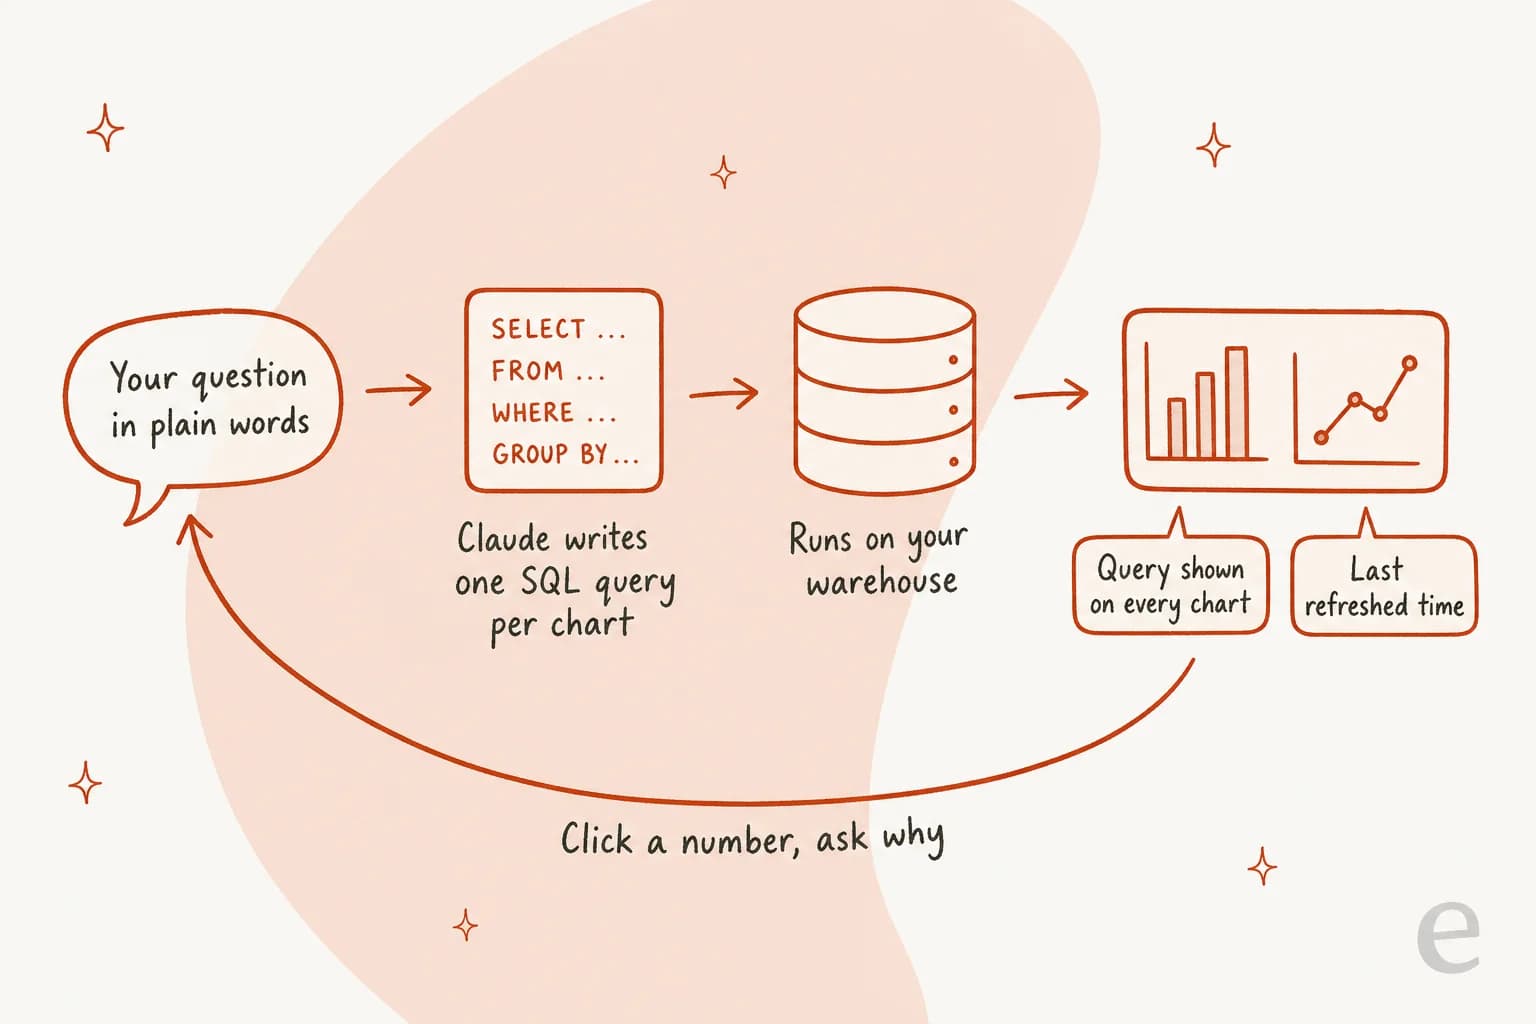
Why does that matter? Because the hard part of AI-written analytics was never drawing the chart. It's knowing whether "active customers" meant what you think it meant. A model that hands you a number with no working is a model you have to re-check by hand, which defeats the point. Putting the SQL on every chart makes each number auditable by anyone who can read a WHERE clause.
Three ways to start a dashboard, all from the help article:
- Ask for one in any chat ("Build a dashboard of this quarter's revenue by region").
- Pick "Output" in the message box and choose "Dashboards."
- Open the Artifacts tab and pick a Dashboards template.
Refining works the same way: ask Claude to "add a filter for region" or "change this to a weekly view," or open a chart's query and tell Claude what it should be counting instead. Anthropic's tip is a good one: say what you want to know, not just what to chart. "How do this month's signups by channel compare with last month's?" gets you further than "a signups chart."
What the docs don't say is just as useful to know. I couldn't find a published refresh schedule, a refresh button, row limits or chart limits anywhere in the help center. The only freshness signal is the per-chart "last refreshed" stamp. If you need a number that is guaranteed current at 9am every Monday, that's not something the docs promise yet.
Where your data has to live
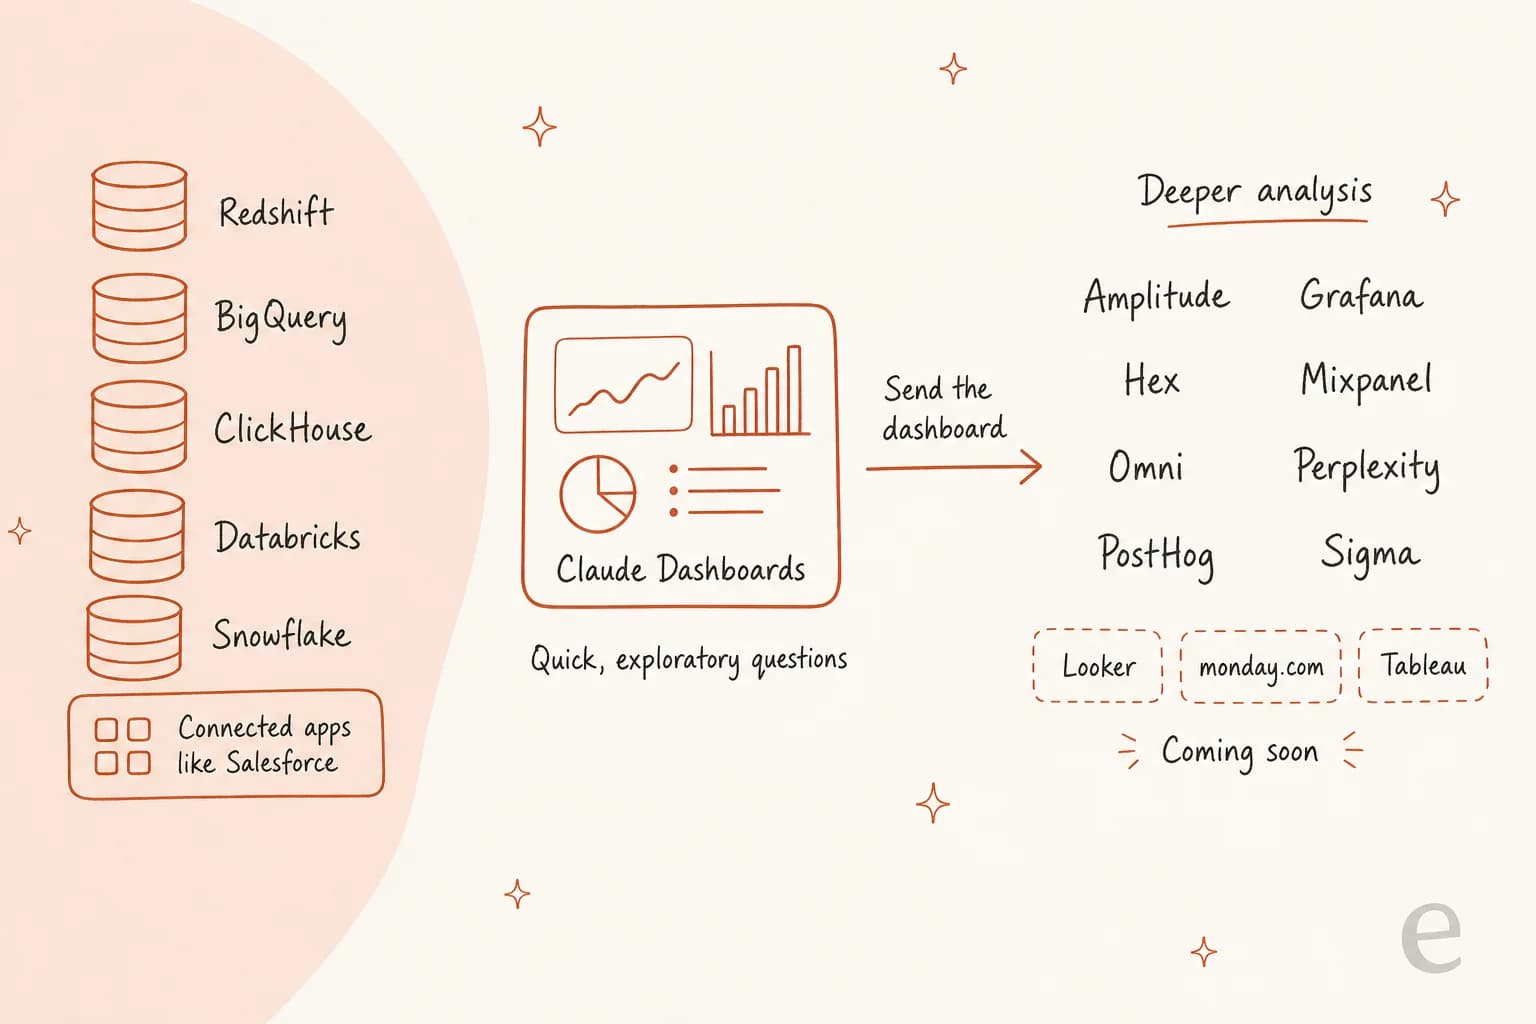
Anthropic names five warehouses: Amazon Redshift, BigQuery, ClickHouse, Databricks and Snowflake. Beyond those, it works with "other apps you've connected to Claude," and the example given is a dashboard of your Salesforce opportunities.
The app side is where I'd slow down. I went through Anthropic's connector directory to see which tools a typical ops or support team could point a dashboard at:
| Where the data lives | Listed in Anthropic's connector directory? | What that means for a dashboard |
|---|---|---|
| Snowflake, BigQuery, Databricks, ClickHouse | Yes | Direct SQL, the path Anthropic designed for |
| Salesforce | Yes (Headless 360, plus the Salesforce in Claude beta) | Named by Anthropic as a dashboard source |
| HubSpot | Yes | A connected app Claude can read |
| Zoho Desk, Freshservice, ServiceNow | Yes | Connected apps; Zoho Desk's connector includes a ticket metrics tool |
| Zendesk, Freshdesk, Front | No listing I could find | Ticket data has to reach your warehouse first |
Two caveats on the app route. First, the help docs on artifacts say connector tools that need approval for every action aren't available inside artifacts, and the first time an artifact uses an app, Claude asks you to approve which tools it may use. Second, "Enable artifact connectors" is an all-or-nothing org setting per the admin guide: "you can't limit which apps artifacts can reach."
For support teams this is the practical catch. If your tickets live in Zendesk or Freshdesk, Claude Dashboards only sees them after an export pipeline lands them somewhere like Snowflake. Plenty of teams already pipe Zendesk data into Power BI or a warehouse, and those teams are in good shape. Teams that report straight out of the helpdesk's built-in reports aren't.
The sharing model is the real story
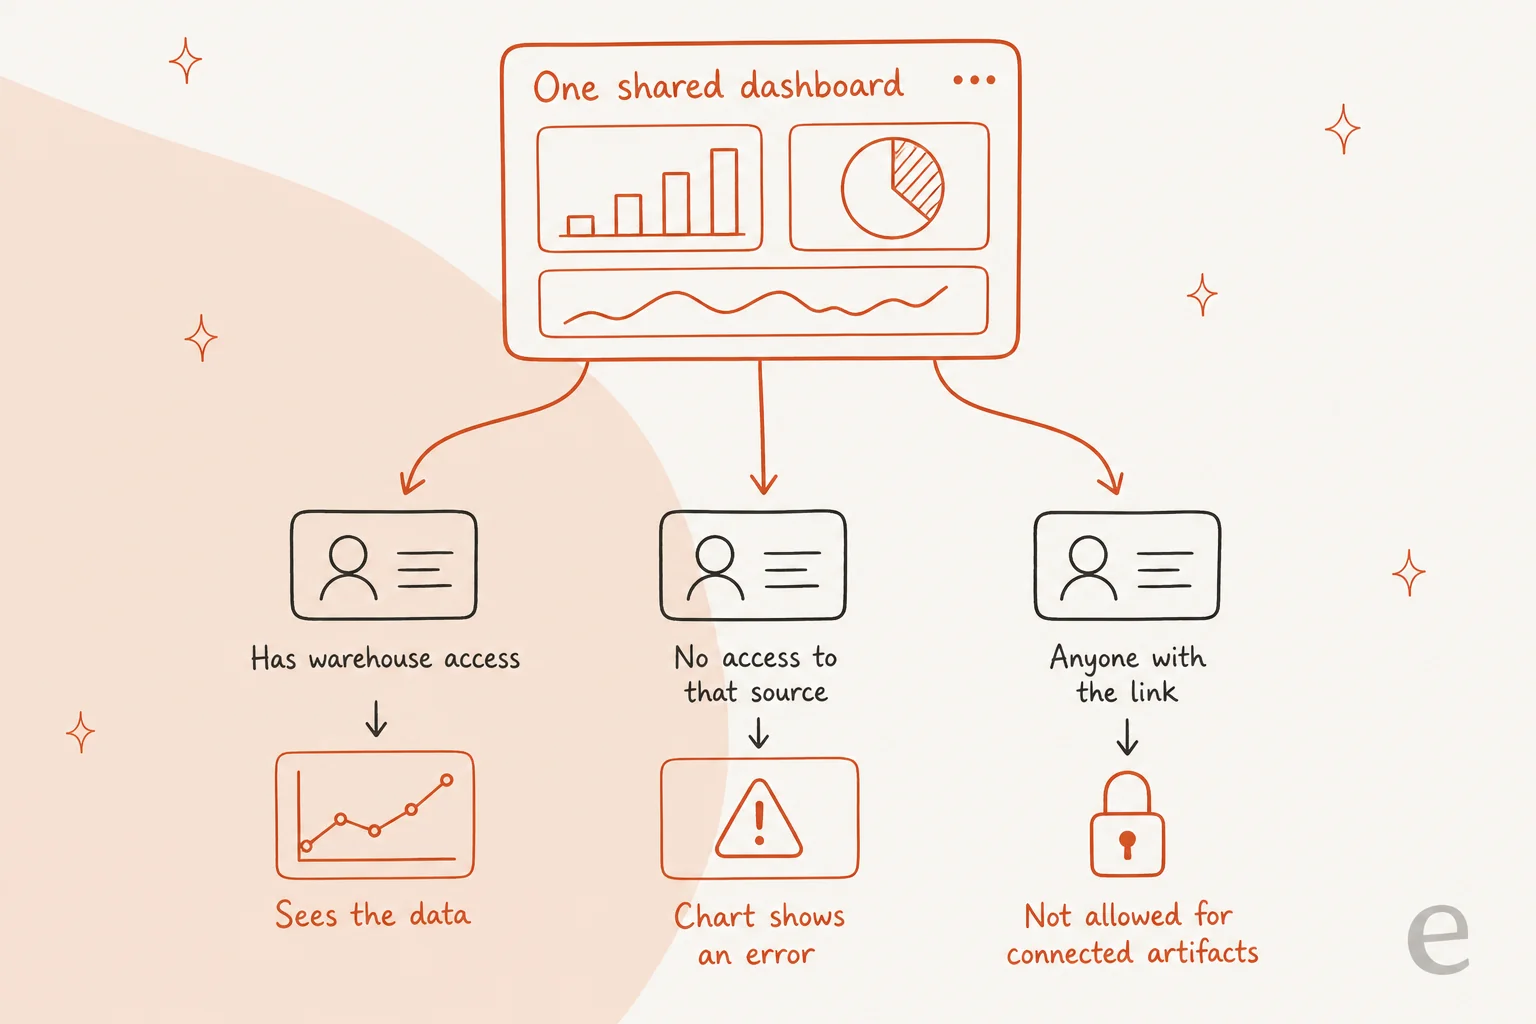
Here's the part that changes how you'd use it. From Anthropic's sharing docs: "Viewers use their own access. An artifact that pulls from connected apps uses the viewer's connections, not yours. If a viewer can't access a data source, that part of the artifact shows an error instead of your data."
That's a sensible security default. Your warehouse permissions stay in charge, and nobody sees rows they shouldn't. But follow it through to a real Monday:
- You build a revenue dashboard and share it with your sales lead. If they don't have a Snowflake login with the same grants, they get error tiles, not your numbers.
- You want to post it in a company channel. You can't use a public link: "Artifacts that connect to your apps or use Claude can't use 'Anyone with the link.'"
- You invite an agency or a board member from outside the company. You can invite up to
50outside people per artifact, but "parts of the artifact that use Claude or your connectors don't work for them." Pending invites expire after30days.
So a Claude dashboard is a personal analysis tool that happens to be shareable, not a broadcast report. Classic BI tools usually solve this the other way, with a service account that queries on everyone's behalf. Neither is wrong. They're built for different jobs, and the launch post's line that "your team and Claude can work on the same doc, deck, design, or dashboard" reads more broadly than the permission model actually allows.
Access levels are the familiar three (Can view, Commenter, Can edit), everyone needs a Claude account, and you can't change sharing settings from the iOS or Android apps.
Which plans include it and what it costs
Claude Dashboards has no price of its own. It "counts toward your plan's usage limits, like the rest of your work with Claude," per the help center, and Anthropic's pricing page marks it as included on every paid plan.
| Plan | Price | Claude Dashboards | Notes |
|---|---|---|---|
| Free | $0 | Not included | Gets Docs, Slides and Design, but not Dashboards |
| Pro | $17/month billed annually, or $20 monthly | Beta | Individual plan |
| Max | From $100/month | Beta | 5x or 20x Pro usage |
| Team Standard | $20/seat/month annual, or $25 monthly | Beta | 2 to 150 seats |
| Team Premium | $100/seat/month annual, or $125 monthly | Beta | More usage per seat |
| Enterprise | $20/seat/month billed annually, plus usage at API rates | Beta, off by default | An owner has to turn it on |
That's a wider rollout than Motion got. Motion is Team and Enterprise only, as I covered in my Claude Motion pricing breakdown, while a single $20 Claude Pro subscription gets you Dashboards.
Two cost notes worth knowing:
- Enterprise pays per token. With usage billed at API rates, a dashboard that re-runs heavy queries and long explanations costs real money on Enterprise in a way it doesn't on a flat seat. My Anthropic API pricing guide has the rate card.
- There's a launch discount until October 15. Anthropic's artifact usage promotion makes the next 10 messages after Claude creates or edits an artifact use 50% less of your five-hour session limit, on Pro, Max and Team (and Free from October 7). It excludes Enterprise and doesn't touch your weekly limit.
Also remember the warehouse bill. Every chart is a real query against Snowflake or BigQuery, and those platforms charge for compute on their own meter. My Snowflake pricing and BigQuery pricing guides explain how that's metered.
Setting it up for a team
For Team and Enterprise owners, the admin guide lays out the switches:
- Turn on Cloud code execution and file creation under Organization settings, Capabilities. Dashboards won't work without it.
- Turn on the Dashboards template under Organization settings, Artifacts, Templates. It's off by default on Enterprise.
- On Enterprise, use custom roles to limit who can start a dashboard.
- Decide on Enable artifact connectors, remembering it applies to every app at once.
- Decide on External sharing. Turning it off also kills any existing public links.
Compliance teams should read one more line: HIPAA-ready organizations can turn Dashboards on, but it isn't covered by the Business Associate Agreement, so protected health information should stay out of it. Dashboards also aren't available through third-party cloud platforms, so if you buy Claude through a cloud marketplace rather than from Anthropic, check before you plan around it.
Where Claude Dashboards falls short
None of these are dealbreakers for the job Anthropic designed it for. They matter if you were hoping it would replace something.
- It's a beta. Anthropic's beta features page says plainly that "the experience may change" and "not every feature graduates."
- No documented refresh schedule. You get a last-refreshed timestamp per chart and nothing about cadence, alerts or scheduled delivery.
- No public links for connected dashboards. Good for security, limiting for a company-wide KPI page.
- Viewer-by-viewer access. Shared dashboards break for anyone without matching data permissions.
- No semantic layer. Every number comes from SQL Claude wrote for that chart. Two people asking about "churn" can get two different definitions, and the only defense is reading the query.
- Fixes aren't guaranteed. When an artifact errors, there's a "Try fixing with Claude" button, and the docs add that "success isn't guaranteed."
- 20 MB, text only. That's the artifact storage cap from the artifacts article.
The semantic layer point is the one I'd weigh most. Tools like Looker exist precisely so "revenue" means one thing everywhere. Claude Dashboards shows its working instead of enforcing a definition, which is fine for one person exploring and riskier for a number a whole company acts on.
Claude Dashboards vs your BI tool
Anthropic isn't pretending this replaces BI. The launch post says "Dashboards work alongside your BI and analytics tools," and you can send a dashboard straight to Amplitude, Grafana, Hex, Mixpanel, Omni, Perplexity, PostHog or Sigma, with Looker, monday.com and Tableau coming soon.
| Claude Dashboards | A governed BI tool (Looker, Tableau, Power BI) | |
|---|---|---|
| Best at | Quick, one-off questions | Recurring company-wide reporting |
| Who builds it | Whoever asks the question | Usually an analyst or data team |
| Metric definitions | Written fresh per chart, shown as SQL | Defined once in a model or semantic layer |
| Who sees the data | Each viewer through their own access | Often a shared service account |
| Public or embedded sharing | Not for connected dashboards | Commonly supported |
| Refresh | Last-refreshed stamp per chart, no published schedule | Scheduled refreshes and alerts |
| Cost | Included in Claude plans, plus warehouse compute | Separate BI licenses |
My read: the people who gain most are the ones who were stuck in the middle. The product manager who'd otherwise file a ticket with the data team and wait three days. The founder who can read SQL but doesn't want to write it at 11pm. For them, this is a real step up from pasting CSVs into a chat. If you're weighing Claude against other AI tools for this kind of work, my roundup of AI for data analytics covers the wider field.
What people are saying
The launch is a day old, so these are first reactions rather than long-term reviews. Still, the pattern is already clear. The loudest response came from the Power BI world itself:
"Claude Dashboards. It was inevitable."
The most-praised detail is the one I'd praise too, the query on every chart. The open questions are the same ones I had about editing and permissions:
"Love that the query is exposed on every chart. Two things I'm curious about: can I edit the query and have the dashboard respect my change on refresh, and how does it handle row-level permissions when a teammate opens a shared dashboard?"
The permissions half of that has an answer in the docs (each viewer uses their own access). The skeptical side lands on metric definitions, which is the semantic layer gap above:
"Can teams pin an approved metric definition across dashboards? Two valid SQL queries can still disagree on what “revenue” means."
Early hands-on reports are positive, with a few people unconvinced it's new at all:
"Just played around with it using some old data I published a couple years ago. It is surprisingly good"
"I really don’t understand, this is already just a prompt way using python within Claude,why the fuss?"
That last one has a point for anyone who was already charting CSVs in chat. The difference is the live warehouse connection and the visible SQL, not the charts themselves.
Is Claude Dashboards worth turning on?
Yes, if three things are true: you're already paying for a Claude plan that includes it, your data sits in one of the five named warehouses (or an app with a connector), and the people asking questions are the same people with data access. In that setup it's a fast, honest way to answer the questions that used to die in a data-team backlog, and the SQL on every chart keeps it honest.
Skip it, or at least don't plan around it, if you need a dashboard that a whole company opens from a link, a metric definition that can't drift, or a scheduled refresh you can promise to leadership. That's still your BI tool's job.
And if your hardest questions are about the support queue ("what are customers asking about this week, and how much of it could AI handle?"), the warehouse route is a long detour.
Try eesel for answers that live in your helpdesk
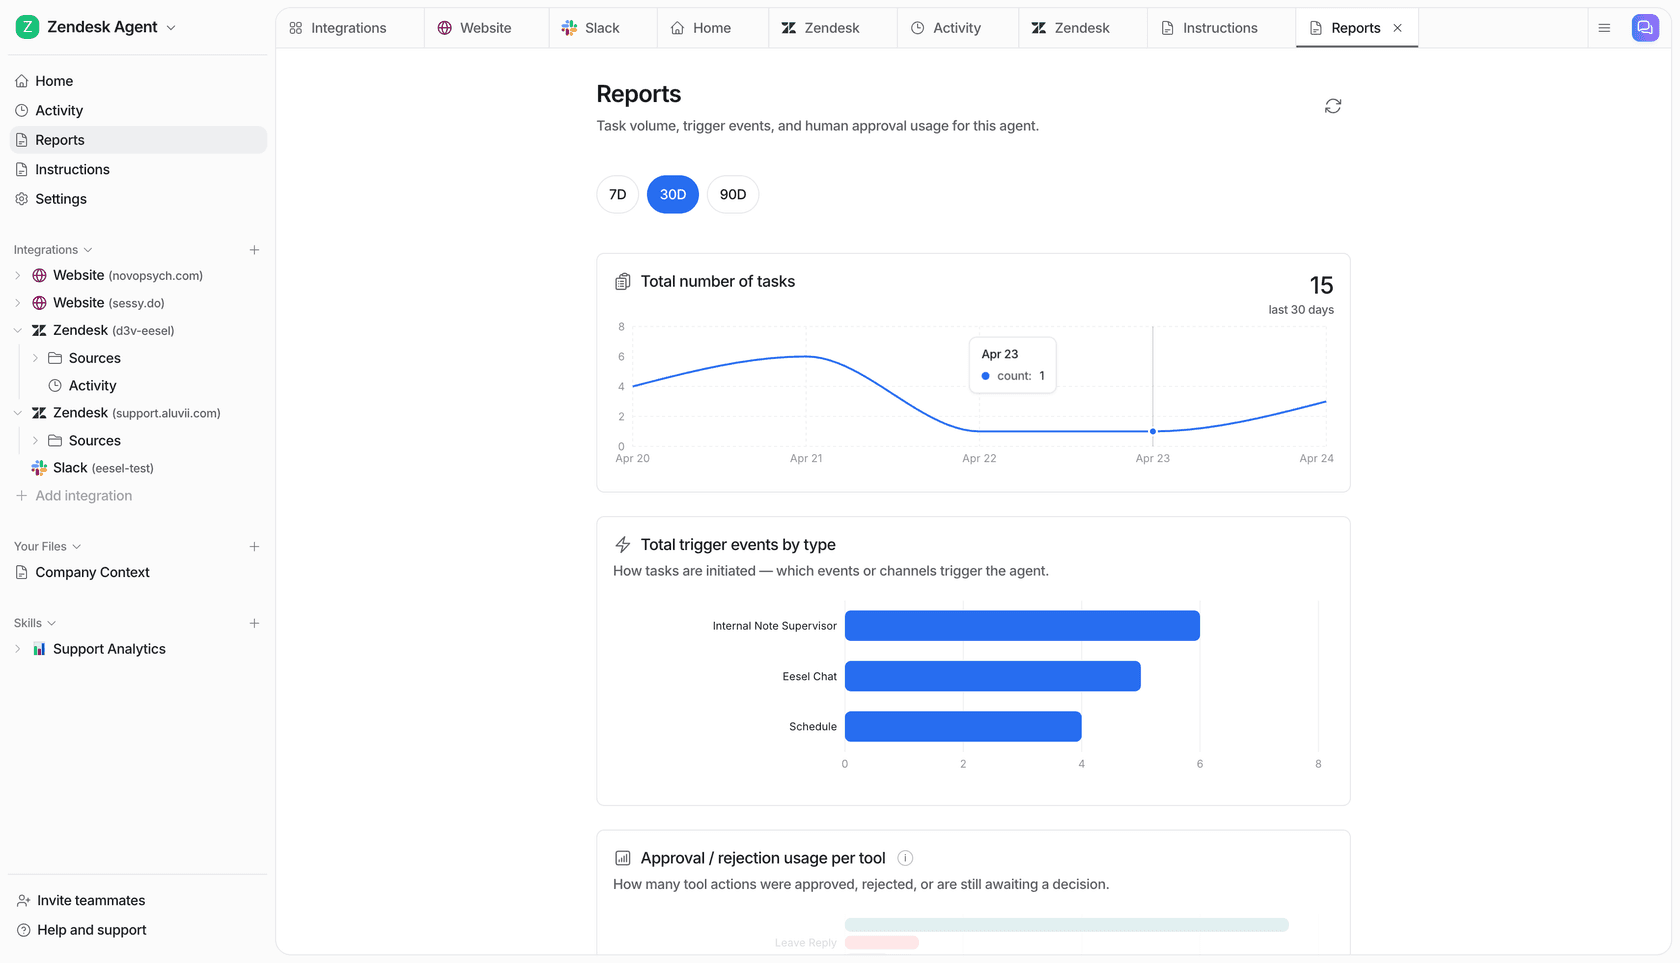
Claude Dashboards answers questions about data you've already moved into a warehouse. Support data mostly hasn't moved anywhere: it lives in Zendesk, Freshdesk or Gorgias. The eesel AI helpdesk teammate works there directly. It plugs into Zendesk, Freshdesk or Gorgias in minutes, learns from your past tickets and help center, drafts or sends replies, and reports on every task it ran, what triggered it and which actions a human approved.
Before it touches a live ticket, I'd run it against your historical tickets first, which is how every eesel rollout starts, so you see the numbers before your customers do. Here's how one Zendesk team described its first month:
"In the first month, eesel is resolving 73% of our tier 1 requests. eesel offers easy Zendesk implementation and setup."
Kim Simpson, Gridwise
Try eesel free, or check eesel pricing first.
Frequently Asked Questions
What is Claude Dashboards?
Claude Dashboards is a beta artifact template in Claude that turns a plain-language question about your company data into a dashboard. Claude writes one SQL query per chart, runs it against a connected warehouse or app, and shows the query and the last refresh time on every chart. It sits next to Claude Motion, Claude Docs and Claude Slides in the Artifacts tab.
Is Claude Dashboards free?
No. Claude Dashboards is in beta on Pro, Max, Team and Enterprise, and the Free plan does not include it. There is no separate dashboard fee: it draws from your plan's normal usage limits. My Claude pricing breakdown covers what each plan costs.
Does Claude Dashboards replace Looker, Tableau or Power BI?
Not in my testing of the design. Anthropic positions it for quick, exploratory questions and offers a way to send a dashboard on to tools like Hex, Sigma or Amplitude for deeper work, with Looker and Tableau listed as coming soon. Teams already reporting in Power BI will keep their governed reports there.
Can Claude Dashboards report on my Zendesk or Freshdesk tickets?
Not directly from the helpdesk today. Dashboards query a warehouse or a connected app, and I could not find a Zendesk or Freshdesk listing in Anthropic's connector directory, so ticket data has to land in your warehouse first. For AI that works the queue itself and reports on what it did, the eesel AI helpdesk teammate plugs into Zendesk and Freshdesk directly.
How do I turn on Claude Dashboards for an Enterprise organization?
An owner goes to Organization settings, then Artifacts, and turns on the Dashboards template. It is off by default on Enterprise, Cloud code execution and file creation must be on first, and custom roles can limit who starts a dashboard. My Claude Cowork review covers the wider admin picture.


Article by
Rama Adi
Rama is a software engineer at eesel AI with two years of experience writing about B2B SaaS, AI tools, and customer support technology. Based in Bali, Indonesia, he brings a developer's perspective to product comparisons — cutting through marketing copy to what the integrations and APIs actually do.