


Why I wrote this one
I'm Kurnia. I write a lot of eesel's posts on support costs, and I spend a fair amount of time looking at what buyers search before they talk to us. "Cost per ticket" comes up constantly, usually right before someone tries to justify an AI rollout to a finance team.
The search results for it are rough. When I asked ChatGPT what a support ticket costs, it ran three searches, cited MetricNet and a Zendesk article, and then answered with channel ranges ("email $6-11, chat $5-9") that I couldn't trace to any primary source. Meanwhile, the primary sources say something quite different.
There's also a lesson eesel learned the hard way. One of our own churn reviews ended with my cofounder Amogh writing that without a "cost-per-ticket comparison, that price is indefensible at renewal time." We hadn't lost the account on product. We lost it because nobody showed the finance team the math. So this post is the math, sourced, plus a calculator so you can run it on your own team.
What does a support ticket cost in 2026?
Here are the numbers that come from the organisations that actually collected the data. Every one of them carries a year, because the most-quoted figures in this space are older than most people realise.
| Benchmark | Figure | Year of data | Source |
|---|---|---|---|
| Assisted contact (phone, chat, email), median | $13.50 | 2024 | Gartner |
| Self-service contact, median | $1.84 | 2024 | Gartner |
| Service desk ticket by channel (North America) | $15.07 to $37.52 | 2021 | MetricNet via HDI |
| Self-help ticket (North America) | $2.37 | 2021 | MetricNet via HDI |
| Level 1 service desk ticket, average | $15.56 (range $2.93 to $49.69) | 2016 | MetricNet via HDI |
| Desktop support ticket, average | $109.15 | 2016 | MetricNet via HDI |
| Support spend as share of revenue, median | 0.7% | 2024 | Gartner |
The short version: a ticket a person touches costs somewhere around $13 to $17 at a typical North American desk, and a ticket nobody touches costs a few dollars or less. Everything else is detail about where your team sits in that range and why.
Gartner adds one line that is worth more than the figures themselves: assisted channels "tend to have similar costs per contact." That's the opposite of the "chat is half the price of phone" story a lot of AI-generated answers repeat.
Cost per ticket by channel: email and chat aren't the cheap ones
MetricNet's 2021 North American data is the freshest public channel breakdown I could find. Here it is as MetricNet published it.
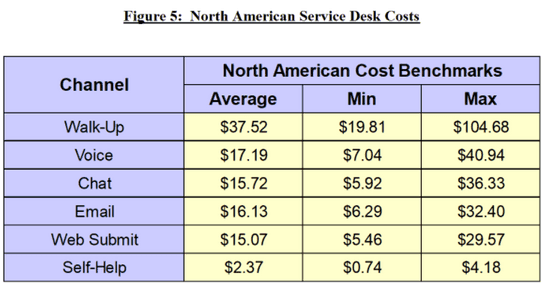
| Channel | Average cost per ticket | Low | High |
|---|---|---|---|
| Walk-up | $37.52 | $19.81 | $104.68 |
| Voice | $17.19 | $7.04 | $40.94 |
$16.13 | $6.29 | $32.40 | |
| Chat | $15.72 | $5.92 | $36.33 |
| Web form | $15.07 | $5.46 | $29.57 |
| Self-help | $2.37 | $0.74 | $4.18 |
Look at the middle four rows. Voice, email, chat and web form sit within about $2 of each other. Chat comes out slightly cheaper because a good chat agent can work more than one conversation at once, and email is cheaper than voice because written queues don't spike the way phone lines do, per MetricNet's own explanation. But it's a few percent, not half.
The real gap is between a person handling it and nobody handling it. Voice costs about seven times what self-help does. That is the gap AI and self-service are trying to close.
There's a catch on the cheap end, though. Gartner's 2024 survey found only 14% of issues are fully resolved in self-service, and MetricNet's self-service completion average is just 10.4%. A failed self-service attempt usually turns into an assisted ticket anyway, so you pay for both.
Why most cost per ticket benchmarks are hard to trust
I'd love to hand you one clean 2026 number. Nobody publishes one. Here's what you're actually looking at when you see a benchmark:
- Most of the dollar figures are old. MetricNet's public numbers run from 2010 to 2021. Its current data sits behind a members wall; the cost per ticket page says you "must become a member" for recent benchmarks. Wages have moved a lot since 2016.
- Most of the data is IT, not customer support. MetricNet benchmarks internal IT service desks: password resets, laptop problems, access requests. A customer support desk for an ecommerce brand or a SaaS product has different ticket types, but similar cost structure.
- Methods differ. Gartner's 2019 poll put live channels at
$8.01per contact. Its 2024 benchmark says$13.50. That isn't a 68% price rise; one is an average from a poll and the other is a median from a benchmark set. Don't draw a trend line between them. - Wages set the level. MetricNet puts it bluntly: the same ten-minute ticket can cost
$10at one desk and$25at another, and "the answer is wage rates" (HDI). A team in Manila and a team in Manhattan can run identical processes and land at very different numbers. - Industry tables are mostly paywalled. No primary source I found publishes a free cost-per-ticket-by-industry table. Anyone quoting one is usually quoting a blog that quoted a blog.
That's why I'd treat the benchmarks as a sanity check and spend most of your energy on your own number. MetricNet's own column makes the same point: "many service and support managers do not know their own Cost per Ticket."
How to calculate your cost per ticket
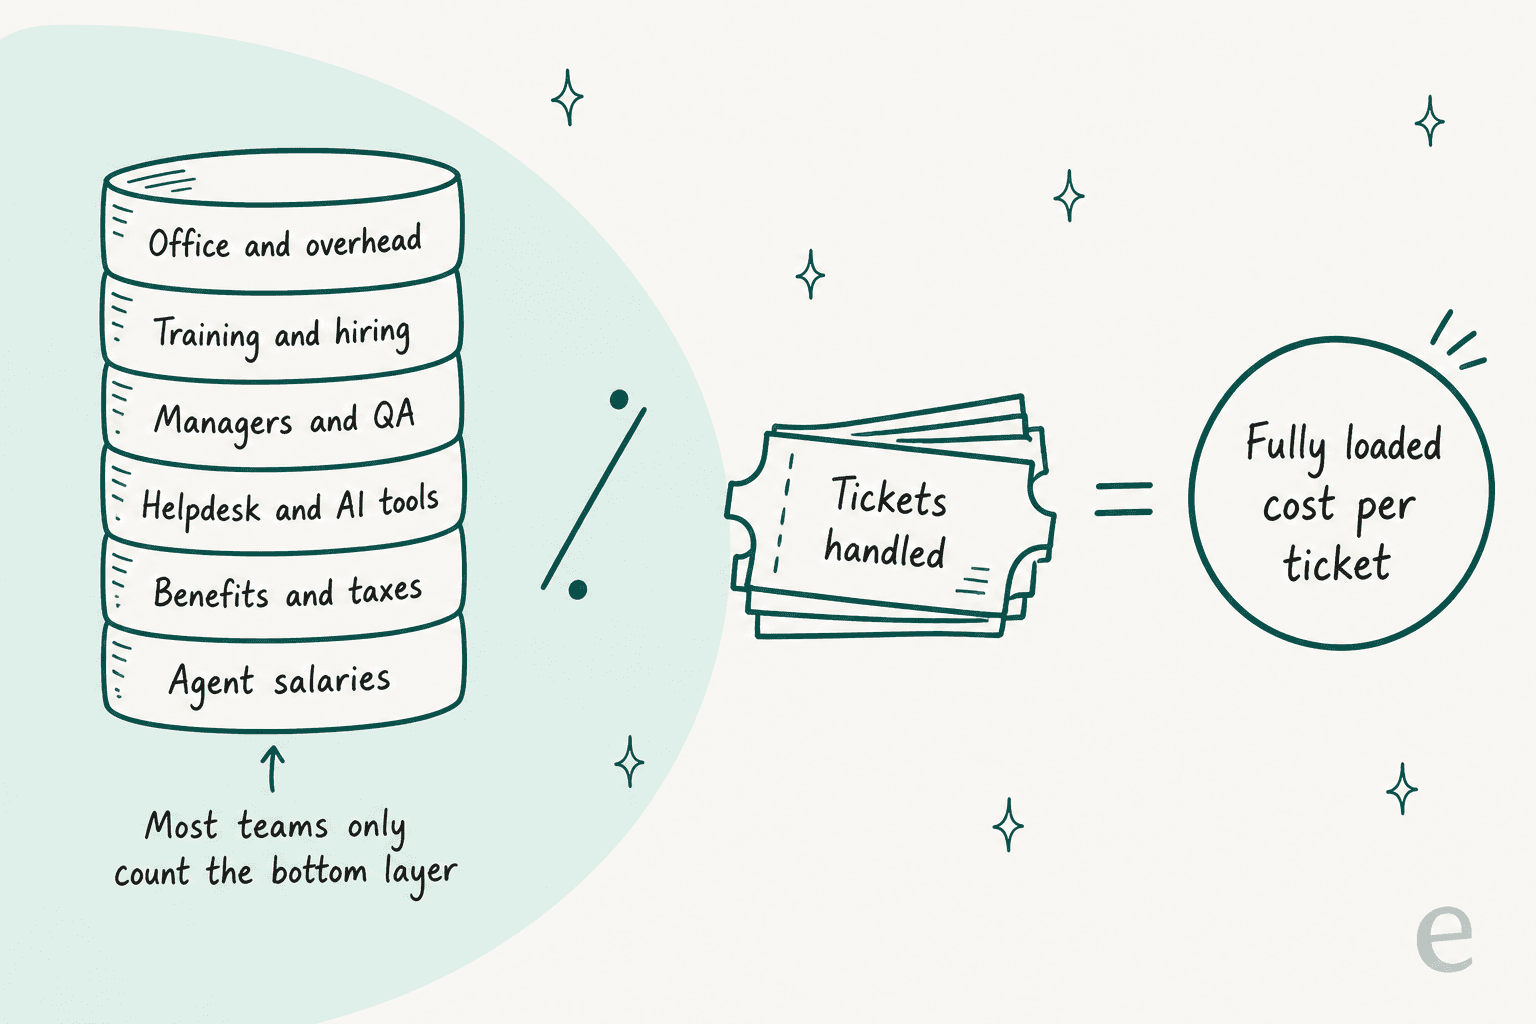
The reference definition comes from MetricNet: "Cost per Ticket is the total monthly operating expense of a service desk divided by the monthly ticket volume" (HDI). The important word is total. Operating expense includes:
- Salaries and benefits for agents
- Salaries and benefits for everyone around them: team leads, QA, trainers, schedulers, managers
- Technology: your helpdesk seats, telephony, AI tools, laptops
- Facilities: office space, utilities, insurance
- Travel, training and supplies
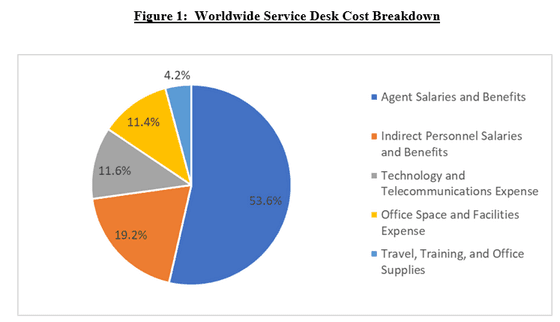
Where the money goes, worldwide, according to MetricNet's 2021 breakdown: agent salaries and benefits are 53.6% of the total, and indirect staff another 19.2%. People are almost three quarters of the cost, which is why handle time and staffing move the number more than any software line.
The mistake almost everyone makes: salary only
The most common error is dividing wages by tickets and stopping there. A call center manager on Reddit put the fix well:
"I managed several call centers. There’s much more to the costs than your hourly rate. Any benefits costs, PTO, etc. have to be added in which is usually in the 35-40% of your hourly range. Also each ‘seat’ license for whatever call/problem tracking software you use, computer and telephony equipment and your physical office space."

The official data backs that up and then some. For office and administrative support jobs, benefits make up 31.3% of total compensation (BLS, June 2026). Flip that around and benefits add about 46% on top of the wage. Applied to the BLS median rep wage of $21.53 an hour, that's roughly $31 an hour before you've paid for a single tool, manager or desk.
The other common slip is just arithmetic. One SaaS founder on r/SaaS estimated $350 to $450 per ticket for a part-time rep; a reply caught that it was monthly volume against an annual salary:
"i think the math is off - 100 tickets/mo is 1200/yr, so $35-45k/yr is like $30-40 per ticket, not $350-450. ... cost per ticket we track as loaded payroll hours/tickets + tooling, early stage we see $20-50 depending on complexity."
A worked example
Take a team of six agents at the BLS median salary, handling 3,000 tickets a month:
| Line | Monthly cost |
|---|---|
Salaries (6 × $44,770 ÷ 12) | $22,385 |
| Benefits and taxes (+46%) | $10,297 |
| Helpdesk, AI and other tools | $900 |
| Team lead, QA, training, space | $9,000 |
| Total | $42,582 |
| Cost per ticket (÷ 3,000) | $14.19 |
| Salary-only cost per ticket | $7.46 |
That's 1.9 times the salary-only figure, and it lands right on top of Gartner's $13.50 median. If 10% of those tickets come back (reopens, repeat contacts), the cost per resolved ticket is $15.77.
Run it on your own team
Swap in your own numbers. The second half of the calculator answers the question finance usually asks next: what happens if AI takes a share of the queue?
If you'd rather go deeper on the AI side of this, our guides to AI vs human agent cost and cost per resolution walk through more scenarios.
What pushes cost per ticket up or down
MetricNet names two primary drivers, agent utilization and ticket handle time, and three secondary ones: absenteeism, turnover, and the ratio of agents to total headcount (HDI). In practice, four things move the number most.
Handle time (the one straight line in support)
"Cost per ticket increases as the average handle time increases. Furthermore, this is one of the few linear relationships in IT support," MetricNet wrote. The average service desk handle time was 8.6 minutes. At about 10 minutes a ticket, an agent handles roughly 400 tickets a month; at 15 minutes, about 270.
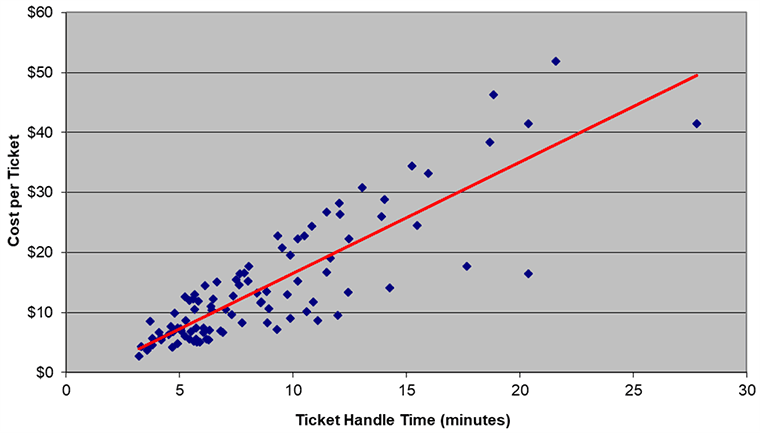
This is why the cheapest place to cut cost is usually the knowledge base, macros and context in the ticket, not headcount. A ticket where the agent already has the order status and the right macro takes a fraction of the time of one where they go digging.
Utilization (and its ceiling)
Utilization is the share of paid time agents spend on tickets. The global average was 49.6% in 2017. Low utilization means you're paying for idle capacity, which raises cost per ticket. But MetricNet also warns that once utilization approaches 60 to 70 percent, turnover climbs, and replacing one agent costs about $12,000 in North America. Squeezing utilization past that point saves on paper and costs you in hiring.
Escalations
Every hop up the support chain costs more, and the costs stack.
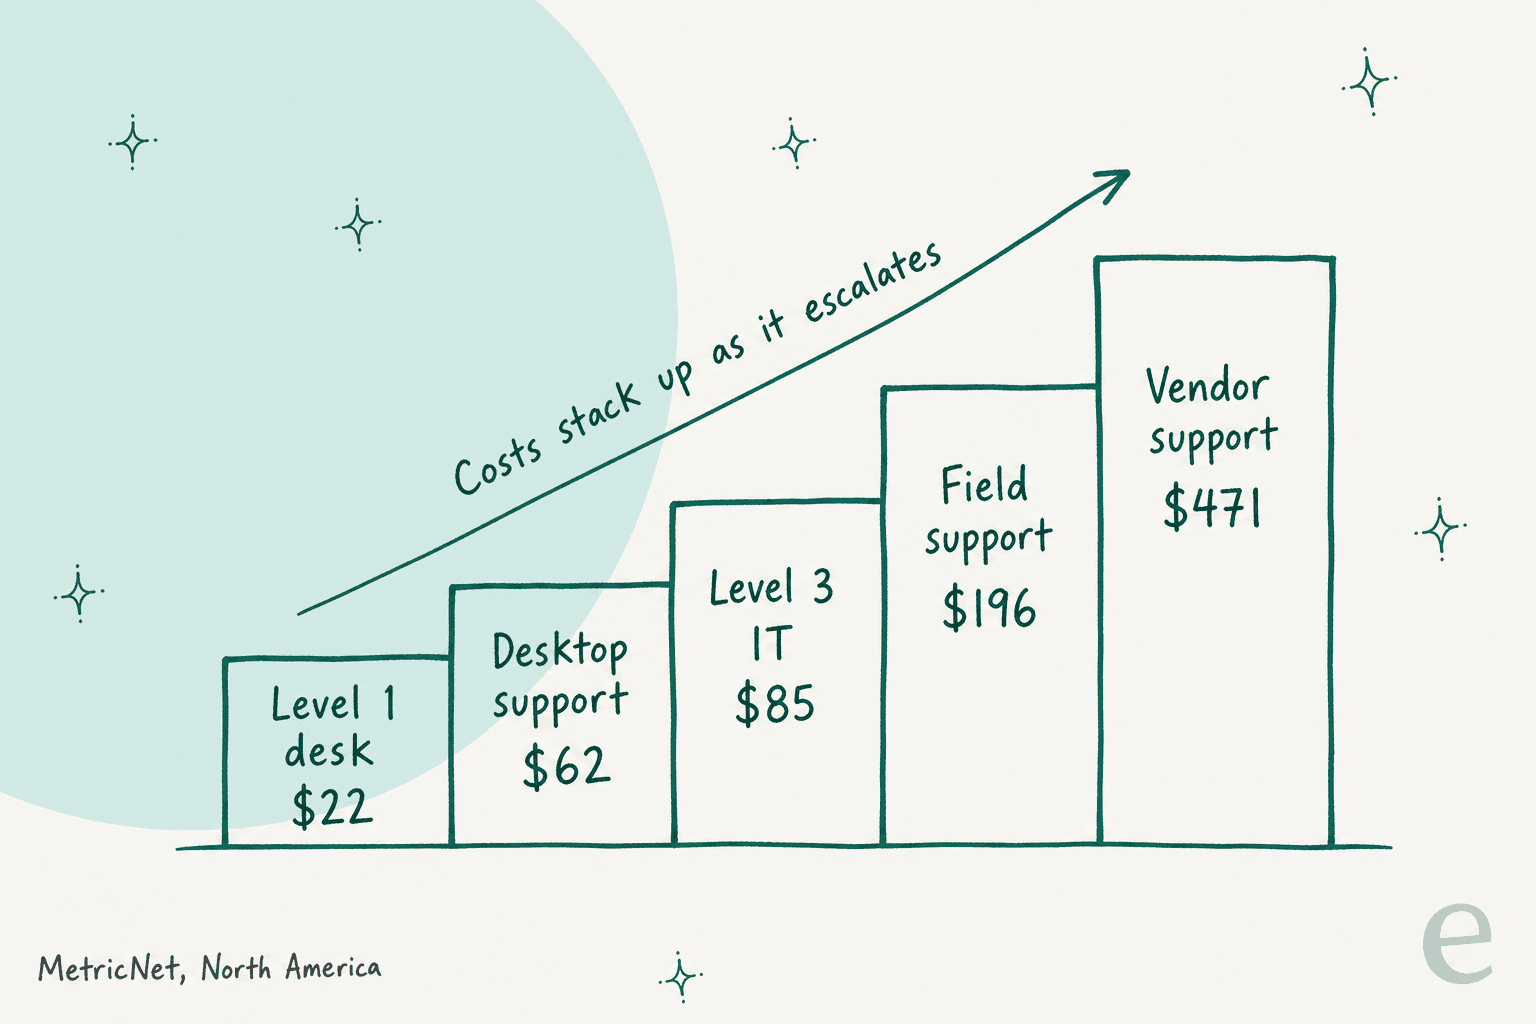
Those are MetricNet's 2010 North American figures, so ignore the absolute dollars and look at the ratios. A ticket escalated from level 1 to desktop support costs $22 plus $62, not just $62, per MetricNet. Its conclusion: "any ticket that can be resolved at level 1 should be resolved at level 1." In customer support terms, the equivalent is resolving at first touch instead of bouncing between tiers, which our tier 1 deflection guide covers.
Ticket mix
This one is easy to miss. A desk where most tickets are quick "where's my order?" questions will have a low average, and a desk full of billing disputes will have a high one, even if both teams work equally well. MetricNet showed the same thing with incidents versus service requests: shifting the mix alone moved one example company's cost per ticket from $62.50 to $80.00. Which brings us to the problem AI creates.
What AI does to your cost per ticket
Here's the part I wish more AI vendors explained up front. When AI handles the easy tickets, your average cost per human-handled ticket usually goes up. That's not a sign anything broke. One team that rolled out an AI agent described it on Hacker News:
"After a few months of running the AI agent, we found that both our time and cost per ticket had increased - but then digging in, the issue was that our overall cost and time had decreased and it was just that the more complicated issues the agent wasn't able to answer were the ones now going to the humans, skewing our per ticket cost up."

Run the worked example through it. If AI fully handles 30% of the 3,000 tickets, those are the easier ones (call it half the effort), and the AI costs $1.00 per ticket, then:
- Total monthly cost drops from
$42,582to about$37,230, a saving of$5,352 - The blended cost per ticket drops from
$14.19to$12.41 - But the cost of each ticket a person still handles rises from
$14.19to about$17.30
If your dashboard only shows "cost per ticket (human)", the rollout looks like a failure. If it shows total cost and blended cost per ticket, it looks like what it is. This is the same trap as reporting a high deflection rate that hides customers who gave up.
A second Reddit thread got to the fix on its own: compare by issue type, not averages.
"If AI gets all the easy "where is my order?" tickets while humans keep refunds, disputes, and edge cases, comparing average AI cost vs average human cost isn't really apples-to-apples."
Two more things worth knowing before you build the business case:
- The savings assume headcount can follow the work. If you keep the same six agents, total cost doesn't fall much; you've bought capacity, not savings. That can still be the right call if volume is growing, but say so in the plan. Our AI support pilot guide covers how to frame that.
- Budgets are already shifting. Gartner's 2026 survey found AI spending up 38% while total service budgets grew just 2%. Leaders are moving money from labour into technology, so the AI line on your cost sheet is going to get looked at closely.
Cost per ticket vs cost per resolution
Cost per ticket counts work. Cost per resolution counts outcomes. They split apart whenever tickets come back, and they come back more than most teams measure.
Zendesk's own explainer on cost per resolution includes a warning I'd pin above every support dashboard: "If CPR falls while repeat contact rises, the cost reduction may be shifting work rather than removing it." It also says AI "only reduces cost per resolution when the cost to automate stays lower than the cost to resolve manually." That's a vendor being refreshingly direct about its own category.
A support director on LinkedIn made the same point from the operator side:
"A lower cost per ticket doesn't necessarily mean a lower cost of support. ... If the customer has to reopen the ticket, contact support again, escalate through their account manager, or spend another hour trying to get the same issue resolved, the organization hasn't really saved money. It has simply moved the cost somewhere else."

The practical version: count a ticket as resolved only if it doesn't come back within a set window (48 to 72 hours is common), and track AI and human resolutions separately. One operator on Reddit described exactly why:
"i track cost per resolution with a 48 hour window for reopens, automation rate alone is basically useless
we had a period where our "automation rate" looked incredible but half those customers were just giving up and calling in later, the dashboard was lying to us"
Our posts on AI resolution rate and CX AI metrics go further into how each helpdesk defines a resolution.
What AI support costs per ticket in 2026
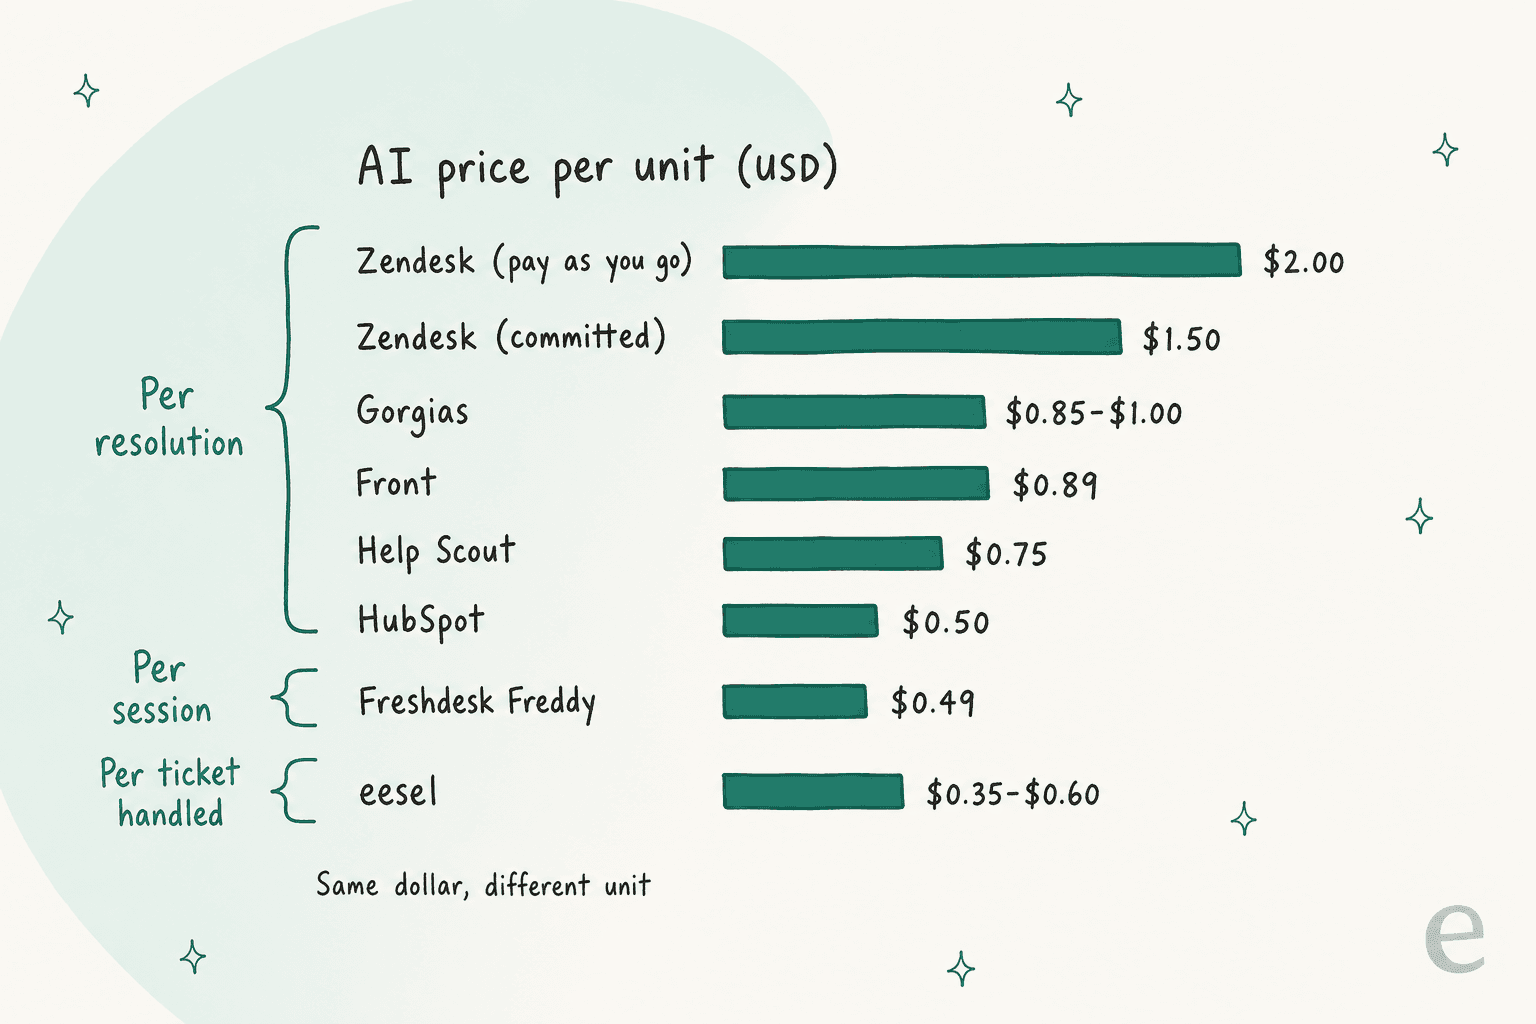
If AI is going to take a share of your queue, its price per ticket goes into the same calculation. The catch is that vendors bill for different things, so a lower sticker price can be a more expensive ticket. Here's what each vendor publishes on its own pricing page or help center, checked October 2026:
| Vendor | Price | What counts as one unit | Worth knowing |
|---|---|---|---|
| Zendesk | $1.50 committed, $2.00 pay-as-you-go | An automated resolution with no human involved, verified by an AI model (Zendesk) | Since May 18, 2026, only "verified" resolutions count against the allowance |
| Gorgias | $0.85 to $1.00 | An interaction where the customer doesn't need a human within 72 hours (Gorgias) | The helpdesk ticket fee is charged on the same ticket too |
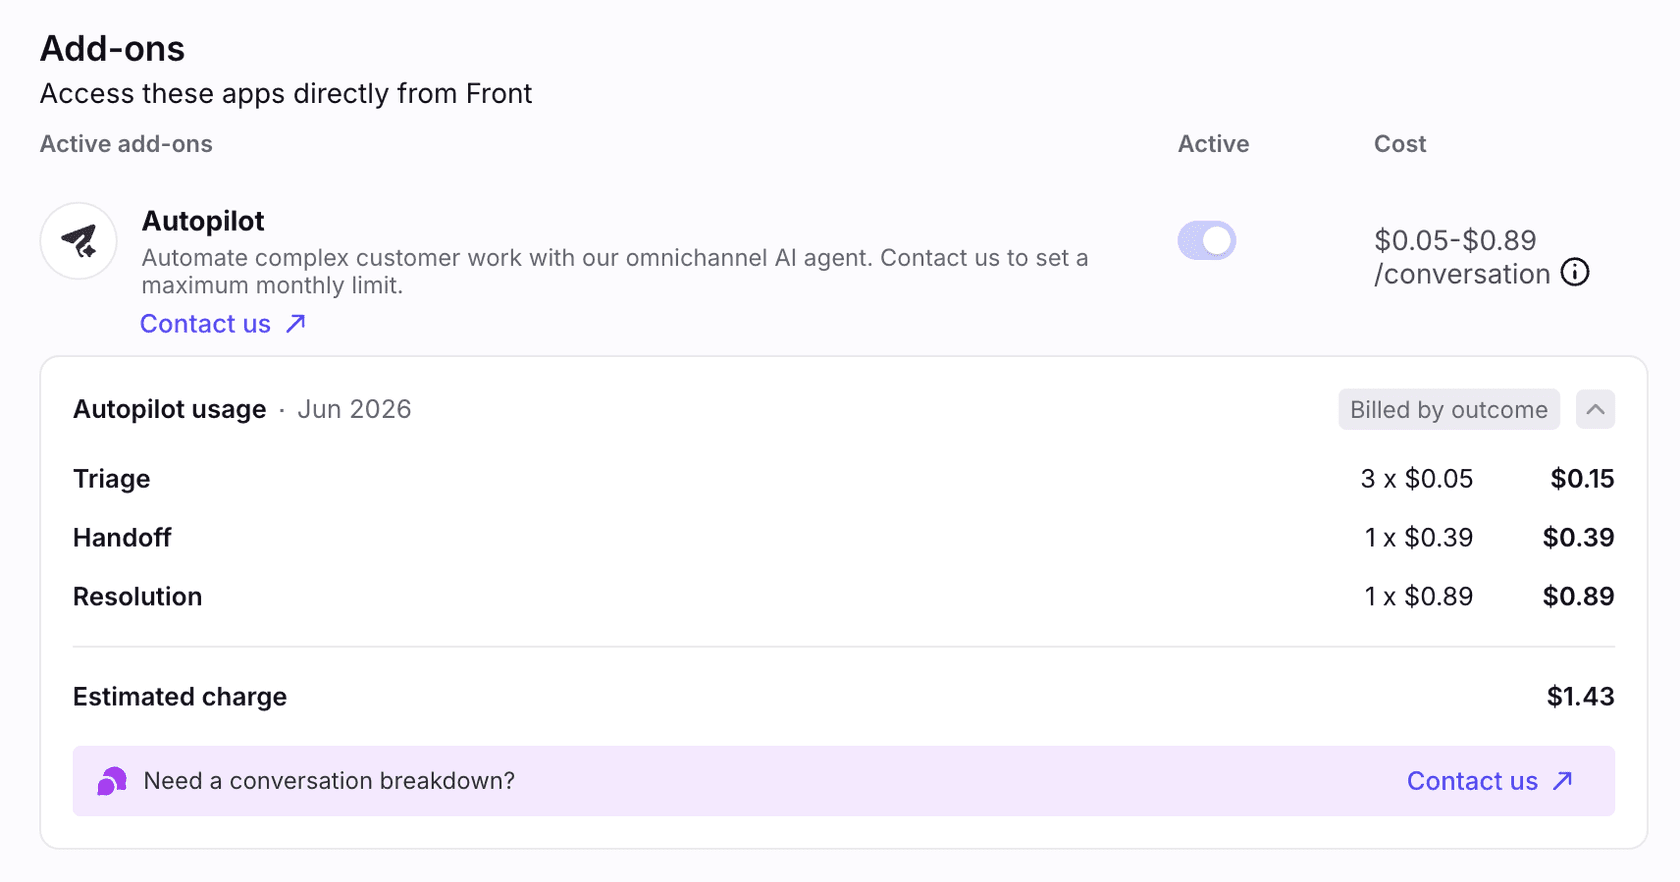
| Front | $0.05 triage, $0.39 handoff, $0.89 resolution | Highest outcome the conversation reached (Front) | Resolution means no teammate reply within 24 or 72 hours |
| Help Scout | $0.75 | A resolution, max one per conversation (Help Scout) | Spending cap available |
| HubSpot | $0.50 | A resolved conversation, as 50 credits (HubSpot) | Needs Service Hub Professional or Enterprise |
| Freshdesk | $49 per 100 sessions ($0.49 each) | A session, resolved or not (Freshworks) | 500 free sessions, once per account |
| Salesforce Agentforce | $0.10 per action, or $2 per conversation | Flex Credits per action, or a whole conversation (Salesforce) | The two models can't run in the same account |
| eesel | $0.35 to $0.60 per ticket | One ticket or chat handled, however many replies | No charge for spam or tickets it stays out of |
Three things to check before you plug a price into the calculator:
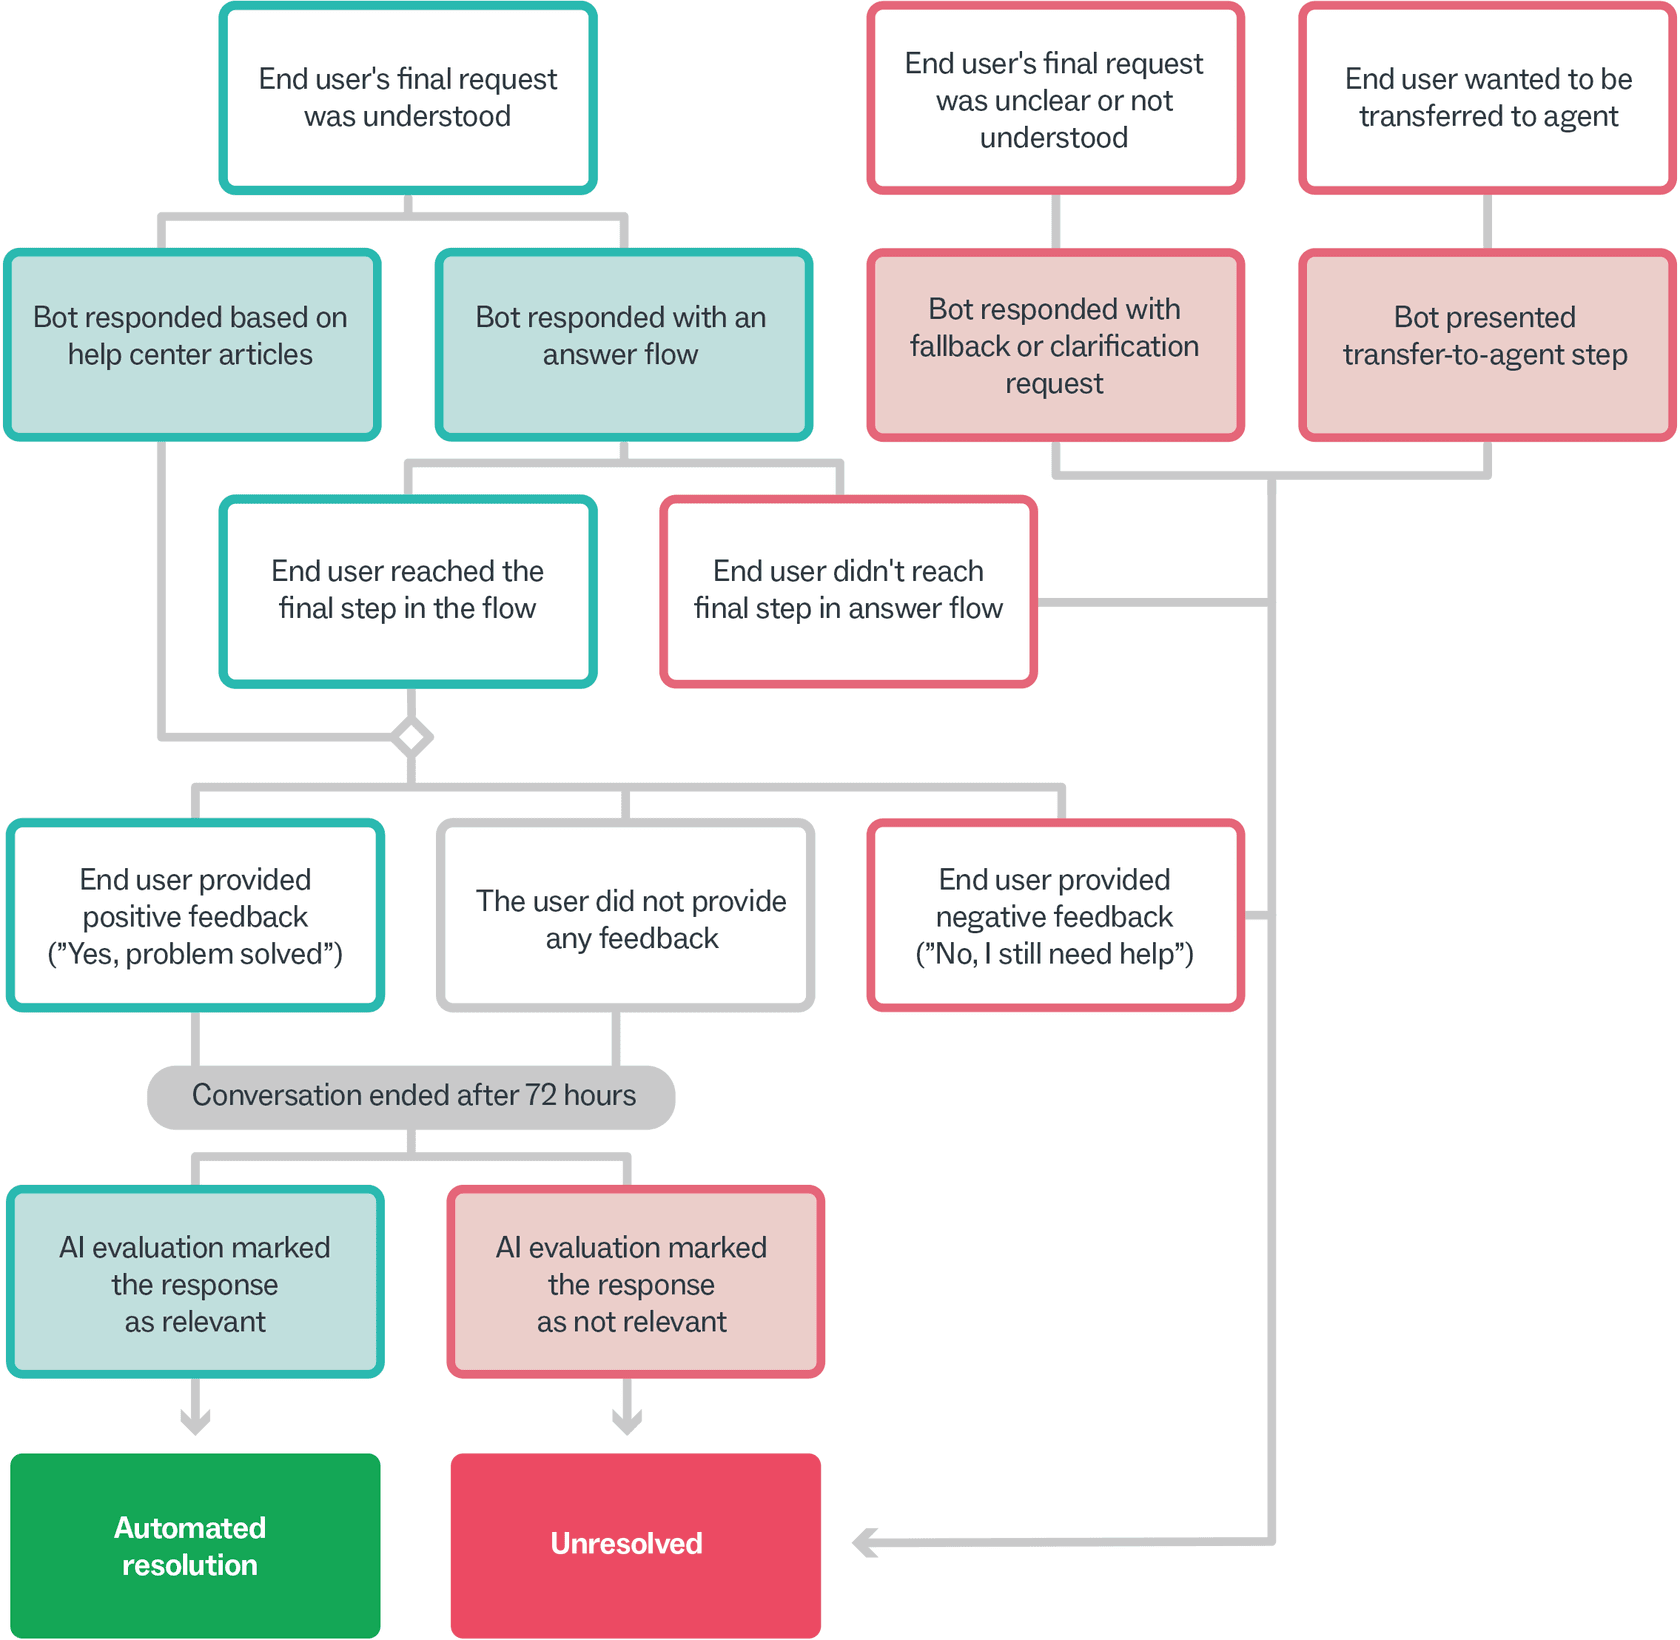
- Resolution-based pricing only charges for wins, but someone else decides what a win is. Zendesk's flow below shows how many branches end in "automated resolution", including a conversation where the customer gave no feedback at all and the AI evaluation marked the reply relevant.
- Stacked fees change the real price. On Gorgias Pro,
$471a month (billed annually) covers 2,000 tickets, about$0.24each, and an AI-resolved ticket pays that plus$0.90, so roughly$1.14all in. Front shows the billing in a way I wish more vendors copied, broken out by outcome:
- Per-resolution pricing gets more expensive as the AI gets better. That sounds backwards, but it's literal: every extra resolution is another charge, and so is every extra ticket in a seasonal spike. Per-ticket or per-session pricing is easier to forecast, but you pay for tickets the AI touched and didn't solve. Neither model is wrong. Pick the one whose failure mode you can live with, and model both in the calculator.
For a vendor-by-vendor breakdown, see our posts on Zendesk's pay-per-resolution pricing, Freddy AI pricing and AI customer service cost.
How to tell if your cost per ticket is too high
A single benchmark won't tell you this. A few comparisons will:
| Check | Fine | Worth digging into |
|---|---|---|
Your number vs $13.50 (Gartner median, assisted) | Within shouting distance, given your wage market | Well above it on a mostly simple ticket mix |
| Cost per ticket by ticket type | "Where is my order?" costs a few dollars | A $15 order-status ticket |
| Trend over 3 to 6 months | Flat or falling with steady CSAT | Rising with no change in complexity |
| Cost per resolution vs cost per ticket | Close together | Resolution cost far higher (lots of repeat contacts) |
| Utilization | Around 50% to 60% | Far below (idle capacity) or above 70% (burnout and turnover) |
MetricNet is fair about the trade-off: "A higher-than-average Cost per Ticket is not necessarily a bad thing, particularly if it helps to drive higher than average customer satisfaction." A premium brand paying for longer, warmer conversations isn't doing anything wrong. A team paying $15 to tell people where their parcel is has an easy win sitting in the queue.
The usual fixes, in the order I'd try them:
- Find the repetitive ticket types. An ecommerce owner on Reddit said automating just tracking updates and return status checks "cut our per-ticket cost significantly" (u/LUXE-Pickleball). Our guide to reducing support costs with AI walks through how to spot them.
- Shorten handle time on what's left with better macros, a cleaner knowledge base and order context inside the ticket.
- Resolve at first touch instead of escalating, since escalations stack cost.
- Then look at AI or outsourcing. For comparison, real outsourced IT desks quoted
$6to$40per ticket to one buyer on Reddit, though most outsourced help desks price per seat or per agent instead.
If your numbers point toward handing the whole queue to someone else, that's a different decision; our AI vs offshore cost comparison and eesel's Managed Support cover that route.
What this looks like with eesel on the queue
eesel is an AI teammate for your helpdesk. It joins Zendesk, Freshdesk, Gorgias and others, learns from your past tickets and help center, and either answers customers itself or drafts for your team, depending on what you let it do.
The cost-per-ticket angle is the pricing. eesel bills one credit per ticket or chat, however many replies go back and forth, from $299 for 500 credits to $1,749 for 5,000. That works out to $0.60 down to $0.35 per ticket, with no seat fee and no charge for spam or tickets the agent stays out of. It's honest to say what that means: you pay per ticket handled, including ones it hands to a person with a draft. If you only ever want to pay for confirmed wins, a per-resolution vendor fits that preference better.
Here's how that plays out for real teams:
- smava, a German loan comparison site on Zendesk, runs eesel across
27,000tickets a month. It sorts every ticket and prepared15,300draft replies, and never sends anything itself. - Question Beauty, a cosmetics brand on Gorgias, had eesel send
960replies directly in a month and close280tickets without a person. - ClutchLoop, a phone accessories brand on Gorgias, sees about seven in ten conversations handled with no person needed.
- SE Ranking uses one agent per product on Zendesk, answering
2,100live chats first in a month and handing refunds and trial extensions to the team.
The smava setup is a good model for the cost-per-ticket argument: it doesn't remove the human from a single ticket, it removes the slow part. Classification and a first draft are exactly the handle-time minutes that MetricNet's straight line says you're paying for.
Try eesel on your own cost per ticket
If you've just run the calculator and the order-status tickets are the ones costing you $14 each, that's the queue eesel was built for. Connect your helpdesk, and eesel replays your past tickets before it goes live, so you can see which ones it would have handled and what that does to your monthly number. At $0.35 to $0.60 a ticket, the AI line on your cost sheet stays one predictable figure.
Try eesel free with 100 credits, no card needed, or see the pricing page to match a plan to your volume.