


A normal ecommerce support contact rate is 19 to 46 tickets per 100 orders, and the category you sell in decides most of where you land: Gorgias data from March 2026 puts Toys and Games at 19.4 and Electronics at 46.3. Calculate it as contacts divided by orders, times 100, after you strip out spam and auto-replies.
My take from working the queue: don't chase the total. Sort contacts by reason and kill the avoidable ones, mostly "where is my order" and return-policy questions. An AI helpdesk teammate like eesel can answer those from a live Shopify lookup, which lowers the work your team carries even though the contact rate itself doesn't move. With the eesel CLI, an AI coding agent can upload your returns policy and test answers before go-live.
What is ecommerce support contact rate?
Ecommerce support contact rate is the number of customer support contacts your store receives for every 100 orders in the same period. You'll also see it called tickets per order, contacts per order, or contact-to-order ratio. They are one number written three ways: 25 tickets per 100 orders is a 25% contact rate, or 0.25 contacts per order.
I work eesel's support queue every day, and this is the one metric I'd put on the wall before first response time or CSAT. Raw ticket volume tells you how busy you were. Contact rate tells you whether you got busier because you sold more, or because something broke. A store that doubles orders and doubles tickets is fine. A store that holds orders flat while tickets climb has a carrier, a product, or a policy problem.
It also makes ticket volume forecastable. If you know you run at 25 per 100 and Black Friday will bring 12,000 orders, you're staffing for about 3,000 contacts, not guessing.
How do you calculate contact rate?
The formula is simple:
Contact rate = (customer contacts ÷ orders) × 100
The hard part is deciding what goes in each box. I've watched teams compare numbers that were never measured the same way, so here's what I'd count.
| Count it | Don't count it |
|---|---|
| Email, chat, social DMs, SMS, and calls a customer started | Spam and sales pitches |
| One conversation as one contact, however many messages | Auto-replies and out-of-office bounces |
| Pre-sale questions (report them separately) | Shipping and order confirmation notifications |
| Contacts an AI agent answered | Internal or B2B partner threads, unless you sell B2B |
The spam line matters more than it looks. In one eesel trial on a German jewelry ecommerce brand's real inbox (about 1,000 tickets a month on Zendesk and Shopify), 22% of incoming tickets were spam. Leave those in and that store's contact rate looks a fifth worse than it is. One of eesel's published customers, Swiss luggage retailer Koffer.ch, runs a filter that skips order confirmations and shipping notifications before anything else happens, for the same reason.
For the bottom half of the fraction, Shopify's Orders over time report gives you the total number of orders received in a period. Use the same dates for both numbers.
Which helpdesks calculate it for you?
None of the big three do it natively, as far as their own docs show. You export a ticket count and divide by the Shopify order count yourself.
- Gorgias: its Helpdesk performance reports count tickets and chart contact reasons on the Ticket attributes tab, and the trend chart can overlay the same period last year. There's no tickets-per-order metric.
- Zendesk: counting tickets by a contact-reason field uses an Explore recipe that needs Suite Professional or higher.
- Freshdesk: contact reasons go in the Type field or a three-level dependent dropdown, which you can make required when closing so the data is complete.
A spreadsheet with two columns, weekly tickets and weekly orders, is enough to start. The eesel guide to Gorgias reports shows where to pull the first column.
What is a good contact rate for ecommerce?
A good contact rate is the median for your category, or lower, and falling against your own history. The best public benchmark I've found comes from Gorgias, which published medians across 14 product categories using its own platform data from March 2026, measured at the $10M annual sales band.
The spread is 2.4x between the quietest and busiest categories. In Gorgias's words, an Electronics brand gets "nearly one ticket for every two orders," while Food and Beverages gets "roughly one in five."
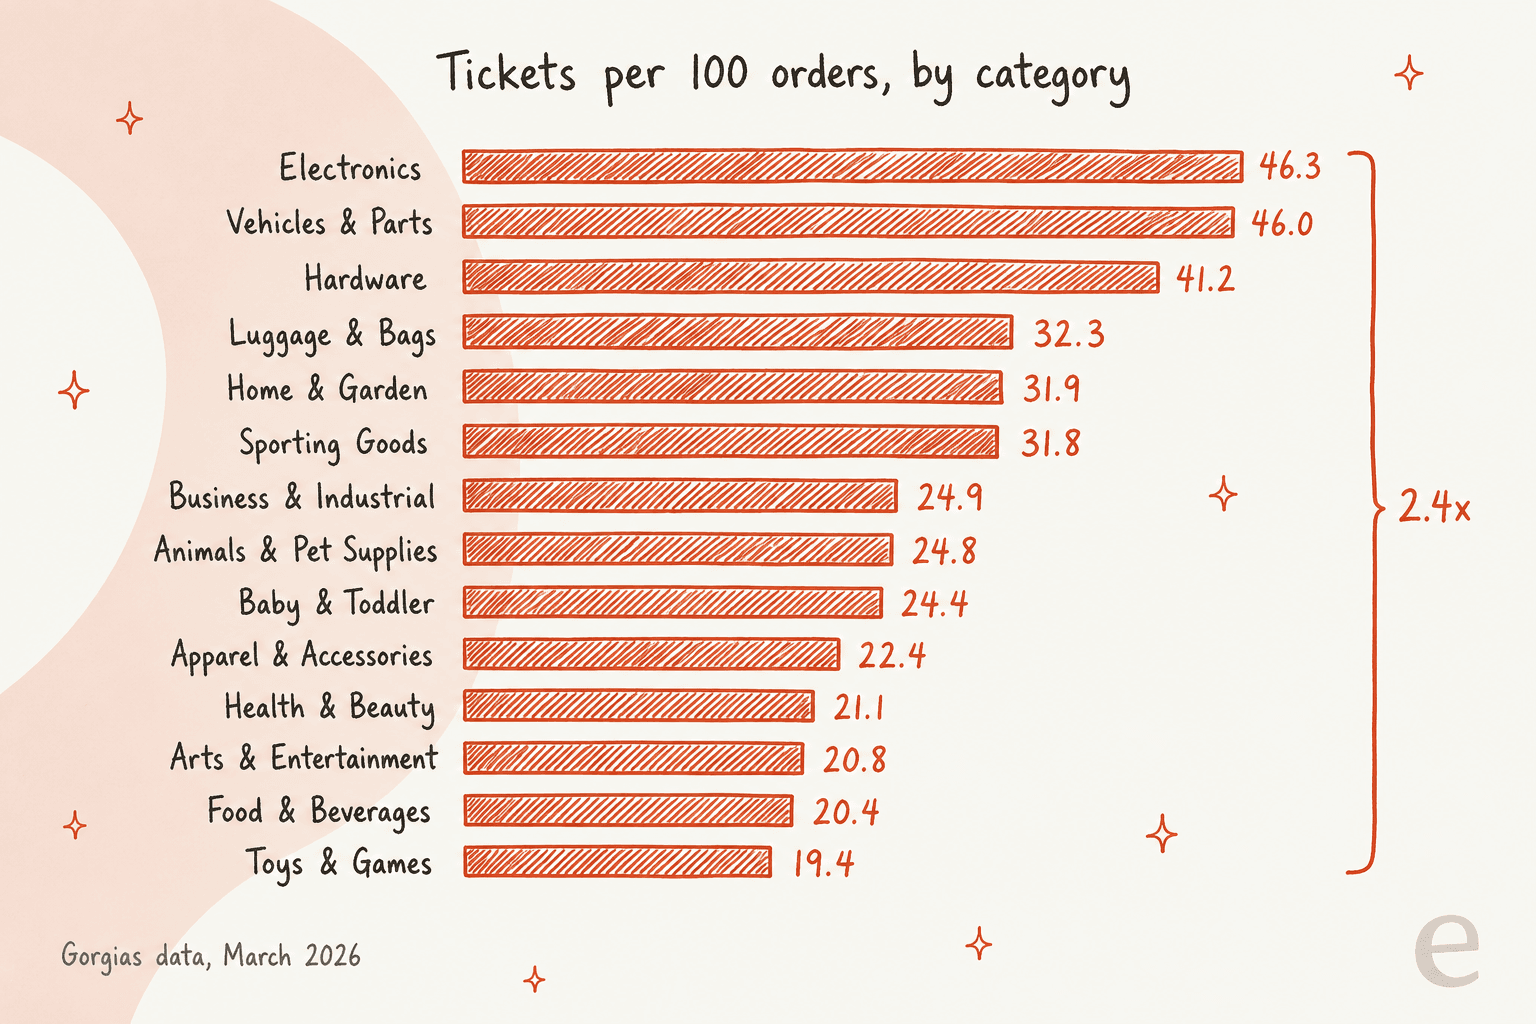
| Category | Tickets per 100 orders | Median first response |
|---|---|---|
| Electronics | 46.3 | 4.8 hrs |
| Vehicles and Parts | 46.0 | 4.4 hrs |
| Hardware | 41.2 | 1.6 hrs |
| Luggage and Bags | 32.3 | 7.7 hrs |
| Home and Garden | 31.9 | 4.4 hrs |
| Sporting Goods | 31.8 | 5.8 hrs |
| Business and Industrial | 24.9 | 4.0 hrs |
| Animals and Pet Supplies | 24.8 | 3.6 hrs |
| Baby and Toddler | 24.4 | 5.3 hrs |
| Apparel and Accessories | 22.4 | 8.8 hrs |
| Health and Beauty | 21.1 | 5.2 hrs |
| Arts and Entertainment | 20.8 | 9.1 hrs |
| Food and Beverages | 20.4 | 5.1 hrs |
| Toys and Games | 19.4 | 8.3 hrs |
Source: Gorgias Ecom Lab, medians at $10M annual sales, Gorgias platform data as of March 2026.
Two caveats before you hold yourself to these. The numbers come from Gorgias merchants only, mostly Shopify direct-to-consumer brands, and the page doesn't say whether spam or AI-handled tickets were removed. Treat them as a range to sit inside, not a target to the decimal.
The framing on that research page is the part I agree with most:
"This is not good or bad. It reflects product complexity and how much customers need to ask before and after buying. If you are in a high-ticket-volume vertical, that is your baseline, not a problem to fix."
A real example from eesel's sales calls lines up with it. A direct-to-consumer supplements brand on Gorgias and Shopify told the team it handles about 7,000 tickets a month against roughly 30,000 orders. That's about 23 tickets per 100 orders, right next to the 21.1 Health and Beauty median, and still enough volume that the team couldn't keep up.
Where does your store sit?
Plug in last month's numbers. The calculator compares you with your category median and shows what your team carries once some contacts are answered automatically.
What drives contacts per order?
Most contacts trace back to a handful of reasons, and order status leads every list I've seen. A 2023 Gorgias post says "where is my order" accounts for 18% of incoming requests on average across its merchants. Its live Ecom Lab dashboard, which uses the last 90 days of data, showed "Order" as the top intent at 17.1% in its all-industries view when I checked on November 4, 2026.
From the queue side, these are the five buckets that fill the inbox:
- Where is my order. Late carriers, silent tracking, or an order that never got a tracking number at all.
- Returns and refunds. Am I eligible, how do I start one, where is my refund.
- Order changes. Address fixes, cancellations, swapping a size before it ships.
- Product questions. Sizing, compatibility, stock, and restock dates.
- Problems. Damaged, missing, or wrong items.
One apparel store owner on Reddit described the order-status bucket exactly the way I see it in tickets:
"Apparel, 190 orders a day, 3 person support team. Pulled the tags last week and 41% of tickets are some version of where is my order. What we have now: shopify's default shipping confirmation and then nothing. Customer gets one email with a carrier link and then silence for 6 days."

eesel's published customer stories back this up from a different angle. STIL Classics, a planner and stationery store on Gorgias and Shopify, pulled a Shopify order on 230 of the 320 tickets eesel prepared in one month. That's roughly seven in ten tickets tied to a specific order.
Seasonality moves the number too. Norwegian climbing apparel brand Rúngne went from 198 tickets in the week of June 22 to 852 in the week of July 20. Compare each week with the same week last year, not with last month, or every peak looks like a failure. The eesel post on seasonal support spikes covers planning for it.
Why can chasing a lower contact rate backfire?
Because not every contact is a bad one. The fastest way to cut contact rate is to bury the contact form, and that number goes down while customers get angrier. I'd rather see a store at 30 per 100 that answers everyone than one at 15 per 100 that people gave up on.
The fix is to sort contacts before you try to shrink them:
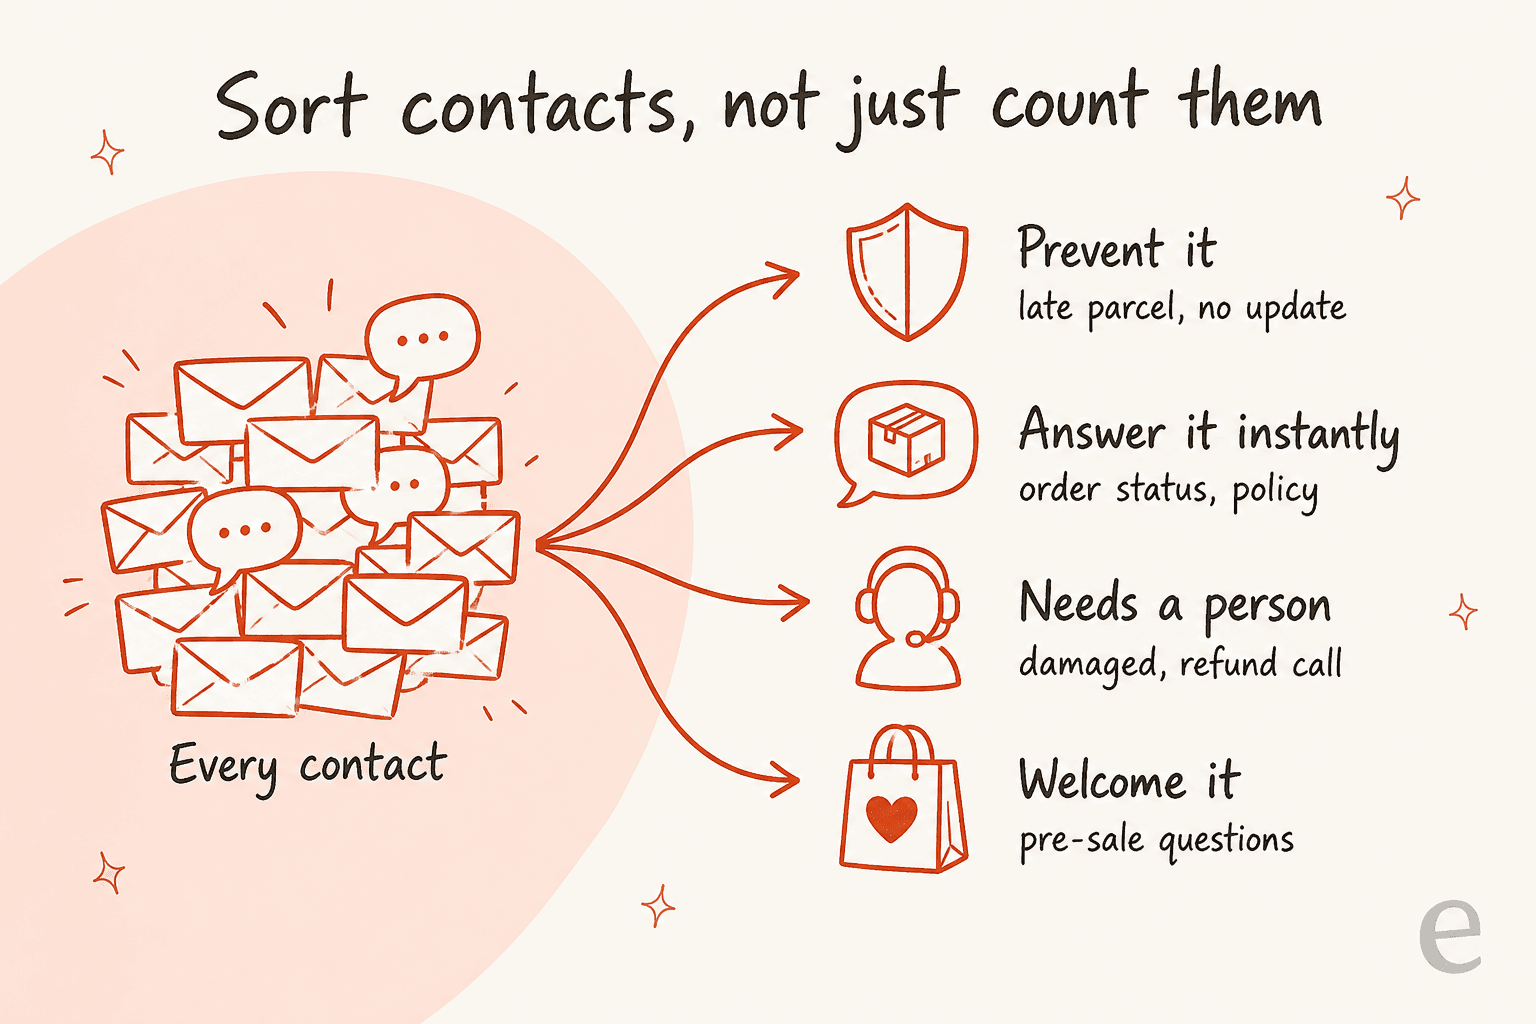
- Prevent it. The customer only asked because you went quiet. A late parcel with no update is the classic one.
- Answer it instantly. The answer already exists in Shopify or your policy pages: order status, return window, shipping times.
- Needs a person. Damaged items, refund exceptions, an angry customer who needs a human voice.
- Welcome it. Pre-sale questions from someone about to buy. Report these separately so a target never pushes your team to discourage them. The pre-sales questions post goes deeper on this bucket.
Only the first two buckets are what you should be trying to remove from your human queue.
A Gorgias customer put the payoff of sorting well in one line on G2:
"It provides our customer experience team with clear visibility to address root problems instead of just handling repetitive tickets, which has resulted in a sustained reduction in volume."

How do you lower your contact rate without hiding from customers?
Here's the order I'd work in, starting with the cheapest fixes.
1. Tag every contact by reason
You can't cut what you can't see. Gorgias ships a Contact Reason ticket field it can fill in with AI, and its guidance is worth copying on any helpdesk: the reason has to be something the customer could tell you. "Delayed Shipment" is a good reason. "Warehouse Problem" isn't, because the customer never sees the warehouse. Keep the list short and the reasons non-overlapping. The guides on AI ticket tagging for ecommerce and working with ticket tags go further.
2. Make tracking work before anyone asks
This is the biggest avoidable bucket for most stores. Shopify's order status page lets customers check shipping updates themselves, but there's a gotcha in its own docs: "If you fulfill an order without a tracking number, then no shipping updates are received, so the status remains Confirmed." A customer staring at "Confirmed" for six days is going to email you.
Shopify says complete tracking info helps you "reduce support inquiries from customers about order status," and Track with Shop is on by default. Add tracking numbers on every fulfillment. The Shopify Flow tracking update walkthrough shows one way to automate it.
3. Send delay notices before the customer notices
In the US this isn't optional. The FTC's mail order rule says that if you can't ship within the time you promised (or 30 days if you didn't promise one), you must offer the customer the choice to accept the delay or cancel for a prompt refund, and that notice has to go out before the original deadline passes. A delay email sent on time turns a "where is my order" contact into a non-event. The routine shipping emails matter less than the exception ones:
"Trigger a message when tracking shows no scan for 3 days or a delivery exception, and say what you are doing about it, like a reship or refund window. Those are the orders that turn into where is my order tickets, and also into lost package claims later."
That's also why stores send so many order emails. As one Hacker News commenter put it, stores that don't send them get people "blasting support screaming this-site-is-a-scam-where-is-my-order!?? over a two day shipping delay" (pembrook, Hacker News). The post on shipping delay notifications covers the workflow.
4. Put the policy where the question starts
Most return contacts are people who couldn't find the policy. Link it from the order confirmation email, the order status page, and the footer. If you use a returns portal, point to it in every reply. One ecommerce operator on eesel hand-corrected the AI's chat replies with exactly this rule: "we cant start for them they need to do it via the portal." The guides to ecommerce self-service and proactive support cover the setup.
5. Answer the rest automatically, and measure it honestly
Whatever survives steps 1 to 4 is mostly order status, policy, and stock questions with an answer sitting in Shopify. That's the bucket an AI agent should take. Which brings up the measurement trap in the next section.
Should AI-answered contacts count toward your contact rate?
Yes. A customer who asks an AI agent where their order is still contacted you. If you drop AI-answered conversations from the count, your contact rate improves on paper while your customers' experience stays the same. That's the deflection vs resolution mix-up in a new outfit.
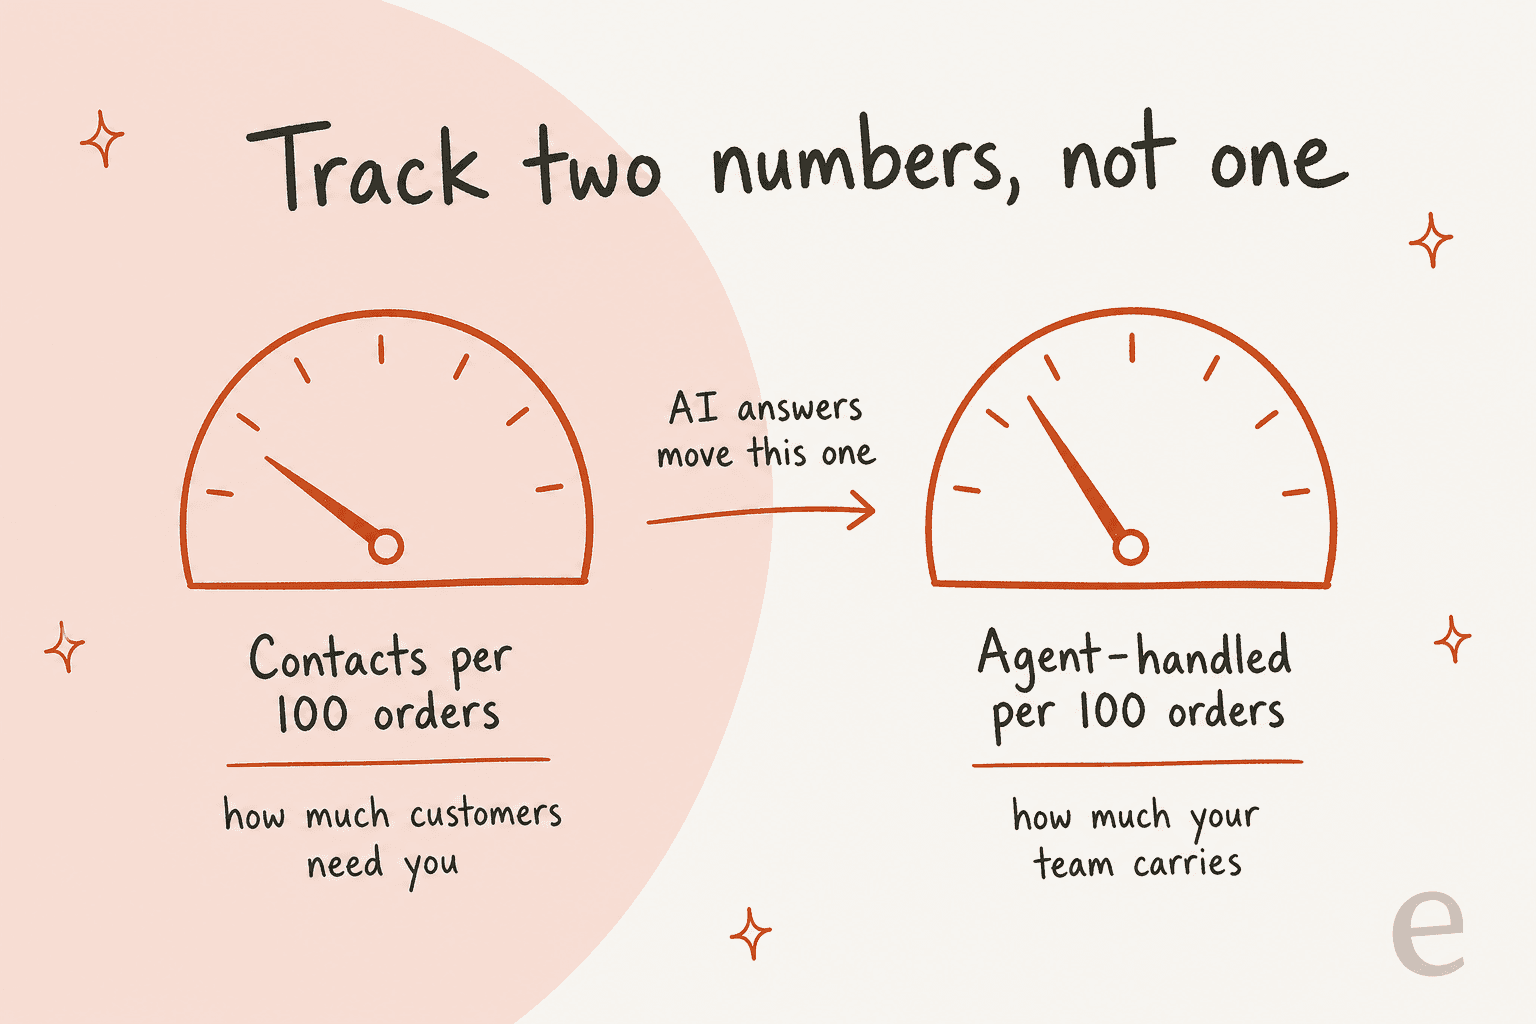
So track two numbers side by side:
| Metric | What it tells you | What moves it |
|---|---|---|
| Contacts per 100 orders | How much customers need you | Better tracking, delay notices, clearer policies, product quality |
| Agent-handled contacts per 100 orders | How much your team carries | AI answers, macros, self-service that fully resolves |
eesel's published customer stories show what that second number looks like in practice:
- Question Beauty, a cosmetics brand on Gorgias and Shopify, checks Shopify before answering any delivery question. If tracking already answers it, eesel says so and closes the ticket: 280 tickets closed without a person in a month, out of 990 handled.
- ClutchLoop, a phone accessory brand, had eesel reply directly to about seven in ten conversations, mainly returns pointed to the returns portal and product questions answered from live Shopify stock.
- Rúngne keeps its answer list deliberately narrow: shipping and return policy, where is my order, stock and pre-orders. That came to around one ticket in seven answered on its own, with cancellations, damaged items, lost parcels and customs disputes handed to the team in Manila.
None of those changed how often customers got in touch. They changed how many of those contacts needed a person. Expect the work per ticket to change too. Once the easy "where is it" emails are gone, what's left is the stuck parcels and the exceptions:
"wismo email went from about 240 a week to 155. support team swear their day feels identical. what i think has actually happened is the easy "where is it" emails disappeared and what's left is all the genuinely stuck parcels, which take way longer each."
That's normal, and it's a reason to watch handle time next to both rates. For more on the measurement side, see the post on AI vs human deflection and this list of AI customer service metrics.
Which contacts should never go to an AI?
The "needs a person" bucket stays human, and it's worth writing down before you switch anything on. Rúngne's setup is a good template: its draft agent writes facts-only notes and leaves the reply to a person whenever money is involved, a carrier has to investigate, an order has sat unfulfilled for more than three business days, or a fact can't be verified. It never states a restock date or an unconfirmed delivery date.
That last rule is the one I'd copy first. An AI that confidently gives a wrong delivery date creates a second contact when the date passes, which pushes your contact rate up, not down. The post on AI in ecommerce best practices covers the rest of the guardrails.
Try eesel for your order questions
If your tags show order status and policy questions on top, that's the bucket eesel is built for. It joins your existing Gorgias, Zendesk or Freshdesk queue as an AI helpdesk teammate and, with the Shopify integration fully connected, looks up the order live by number or email, reads the tracking number, carrier and shipment status, and replies from that instead of from a guess.
You choose which topics it answers on its own and which it only drafts for your team, and actions like refunds or cancellations follow your approval settings. Connecting Shopify and your helpdesk still needs the store owner or an admin to approve it, even when a coding agent does the rest of the setup through the CLI. Plans start with 100 free credits, then $299 a month for 500, and one ticket is one credit however many order lookups it takes. If you'd rather hand the whole queue off, Managed Support runs it for you.
Try eesel and point it at last month's order-status tickets first. That's where your agent-handled number drops fastest.