If you're a customer experience (CX) manager, you probably live and breathe data. It’s how you justify hiring more people, show how your team is crushing it, and prove that the support department is more than just a cost center. Gorgias, a go-to helpdesk for ecommerce brands, has a whole suite of reporting tools built to give you exactly this kind of visibility.
To get the most out of your data, it's helpful to understand how to leverage these reports alongside your broader tech stack. The standard reports are a powerful starting point for understanding your team's performance and customer interactions.
This guide will walk you through everything you can do with native Gorgias reports. We’ll break down the key metrics you can track, talk about how to maximize the platform's current capabilities, and show you how to get a single, clear view of your entire support operation.
What are Gorgias reports?
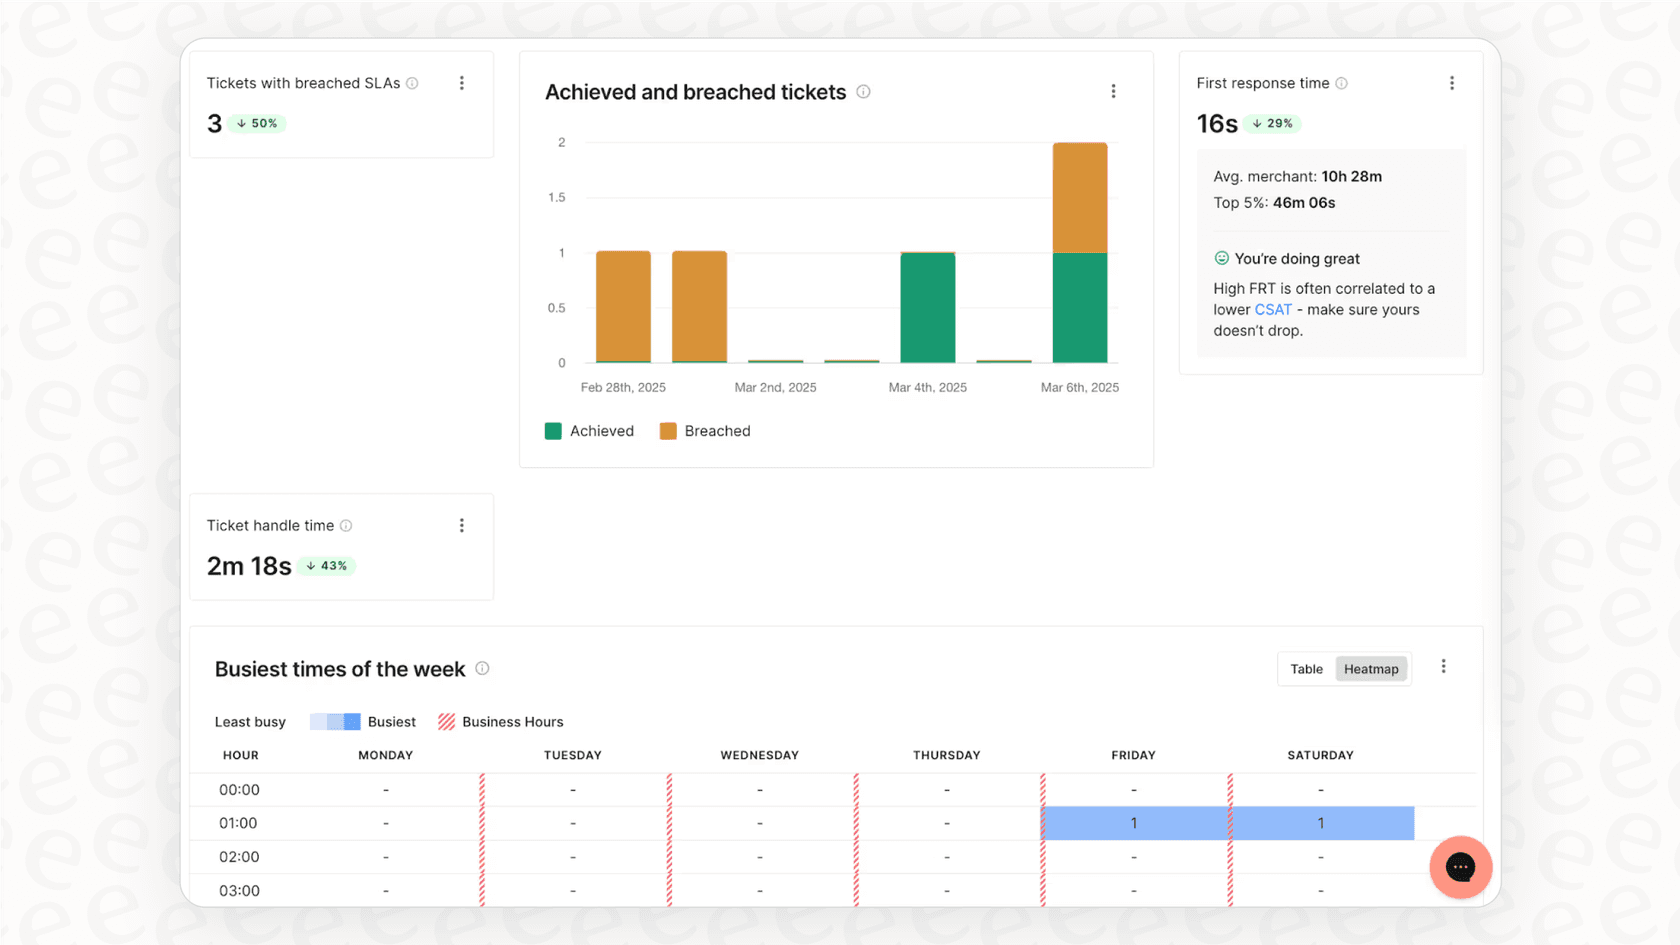
Gorgias reports are the built-in analytics tools that help you measure and make sense of your customer support performance. Instead of wrestling with spreadsheets and raw data exports, you can see your key performance indicators (KPIs) visualized right inside the helpdesk.
The analytics suite is split into a few main areas:
-
Live statistics: These are your real-time dashboards for keeping an eye on daily activity, ticket volume, and which agents are online.
-
Support performance reports: This is where you look at historical data to see how your team and different channels are performing over time, focusing on metrics like response and resolution times.
-
Dashboards: Here, you can create custom views by mixing and matching over 70 different metrics. It's perfect for tracking specific goals, like getting your ticket backlog under control or boosting your CSAT score.
-
AI agent reports: A specific section designed to show you the impact of Gorgias's own automation features.

At the end of the day, these tools are all about helping you move from a reactive "firefighting" mode to a more proactive, data-driven CX strategy. They help you spot trends and fine-tune how your team works.
What you can track with Gorgias reports out of the box
Gorgias gives you a solid foundation for tracking the metrics that every support leader cares about. You can get a pretty clear picture of your day-to-day operations without needing to look anywhere else.
Key support performance metrics in Gorgias
Gorgias does a great job of tracking the industry-standard KPIs you need. You can easily keep tabs on:
-
Ticket volume: See how many tickets are created versus closed. This is essential for understanding your backlog and figuring out staffing, especially during busy seasons.
-
First response time (FRT): A classic metric that measures how quickly your team gets back to customers with an initial reply.
-
Resolution time: This shows the average time it takes to completely solve a customer's problem, from the moment they reach out to the final click.
-
Customer satisfaction (CSAT): Track how customers feel about their support interactions over time to gauge the quality of your service.
-
One-touch tickets: This measures the percentage of tickets solved with just one agent reply. It's a fantastic indicator of efficiency.
Tracking agent and team performance in Gorgias
Want to see how individual agents or the whole team are doing? The Agent performance report lets you drill down into the specifics. It's a great way to spot your top performers and find opportunities for coaching. You can see things like:
-
Tickets closed per agent
-
Average CSAT score for each team member
-
Individual first response and resolution times
-
Total online time and messages sent per hour
Measuring automation and AI agent impact in Gorgias
If you're using Gorgias's built-in AI and automation, the AI agent overview report gives you a sense of how it's performing. You can track:
-
Overall automation rate: The percentage of customer questions that were answered without a human agent getting involved.
-
Automated interactions by feature: See which tools are doing the heavy lifting, whether it's Flows, Order Management, or the AI agent.
-
Time and cost saved: Gorgias provides an estimate of the operational savings from its automation. This is helpful for thinking about ROI and understanding the efficiency gains from Gorgias's native tools.
| Report type | Primary goal | Key metrics | Best for |
|---|---|---|---|
| Live statistics | Monitor real-time activity | Agents online, Open tickets | Daily team management |
| Support performance | Analyze historical trends | FRT, Resolution time, CSAT | Weekly/monthly performance reviews |
| Custom dashboards | Track progress on specific goals | Mix of 70+ KPIs | Goal-oriented teams (e.g., reducing refunds) |
| AI agent overview | Measure automation impact | Automation rate, Time saved | Evaluating Gorgias's native AI |
Maximizing the potential of Gorgias reports
While Gorgias gives you a strong set of tools, CX leaders often look for ways to expand their reporting as they scale. The platform is designed to be a central hub, and its capabilities are constantly growing to meet more complex strategic needs.
Customizing your reporting experience
Gorgias offers a high degree of customization through its dashboards. You can create dashboards using a pre-made list of charts to track your most important KPIs.
As a platform that listens to its users, the ability to "Build custom reports" is featured on the Gorgias product roadmap for 2026, showing their commitment to continuous improvement and providing even more flexibility for data-driven teams.
Integrating Gorgias reports with your tech stack
Gorgias reports excel at telling you what’s happening within your helpdesk. To see the full customer journey, you can connect Gorgias with the other tools your team uses. Whether your agents are searching for info in Confluence, Google Docs, or communicating in Slack, Gorgias's ecosystem is built for integration.
By connecting these sources, you can gain a more comprehensive view of how your knowledge base and internal communications impact your support metrics. This allows you to identify where help articles can be improved or where internal questions can be streamlined to better support the customer experience.
Advanced AI reporting insights
The AI agent reports are purpose-built for Gorgias's native AI features. If you choose to use additional specialized AI solutions to handle custom actions or connect to external systems, those tools can often work alongside Gorgias to provide a complete picture of your automation success.
This is where a solution like eesel AI can be a great addition. It integrates directly into your Gorgias helpdesk, complementing your existing setup. You get a powerful AI that connects to all your knowledge sources, plus its own reporting suite to track specialized interactions, giving you even more data to work with.
Gorgias pricing
Getting a handle on the pricing structure is important, as it is designed to match your team's needs. Gorgias uses a tiered plan model based on ticket volume, ensuring you have the right level of support as you grow. Here’s a quick look at the plans from their official pricing page.
| Plan | Monthly price (billed annually) | Included helpdesk tickets | Overage cost (per 100) | AI agent cost (per interaction) |
|---|---|---|---|---|
| Starter | N/A (Monthly only: $10) | 50 | $0.40 / ticket | $1.00 |
| Basic | from $50/mo | 300 | $40 | $0.90 |
| Pro | from $300/mo | 2,000 | $36 | $0.90 |
| Advanced | from $750/mo | 5,000 | $36 | $0.90 |
| Enterprise | Custom | Custom | Custom | $0.90 |
How to enhance your Gorgias reports
You can further enhance your reporting by integrating other powerful tools directly into the Gorgias ecosystem.
Using BI and analytics integrations
The Gorgias App Store has a variety of BI and analytics tools that can pull data from Gorgias into one central dashboard. Tools like Geckoboard or Daton let you combine Gorgias metrics with data from your other platforms, offering a unified view for your team.
Unified AI reporting and insights with eesel AI
If you're looking for specialized AI insights, eesel AI offers a complementary path to data you can use.
-
Easy integration: eesel AI connects with Gorgias, Confluence, Google Docs, Slack, and over 100 other tools. It works alongside your Gorgias dashboard to show you how your AI is performing across all your knowledge sources.
-
Actionable knowledge gap analysis: The eesel AI dashboard analyzes conversations to highlight gaps in your knowledge base. This serves as a helpful guide for creating new content that makes your Gorgias setup even more effective.
-
Confident forecasting: eesel AI includes a simulation mode that can run on your past Gorgias tickets. This gives you a data-backed forecast of your potential resolution rate and savings, allowing you to go live with your AI strategy with confidence.
Go beyond standard Gorgias reports to drive growth
Gorgias reports are a fantastic starting point for any ecommerce support team. You can easily track your core KPIs, check in on agent performance, and build dashboards to keep your team aligned.
As your team grows, you can continue to turn your CX department into a growth engine by exploring deeper, more connected insights. Gorgias provides the mature, reliable foundation you need, and its ecosystem allows you to add flexibility as your strategic needs evolve.
Integrating a platform like eesel AI lets you keep the helpdesk you already trust while unlocking additional intelligence. You can automate more conversations, get a complete view of your entire knowledge ecosystem, and make decisions based on the full story.
Ready to see how your data can drive even more growth? Try eesel AI on your Gorgias tickets today.
Frequently asked questions
What kind of support performance metrics can I track with Gorgias reports?
With Gorgias reports, you can monitor essential KPIs like First Response Time (FRT), Resolution Time, Customer Satisfaction (CSAT), overall Ticket Volume, and the percentage of One-Touch Tickets. These metrics provide a clear picture of your team's efficiency and customer service quality.
Can I create fully custom Gorgias reports to track unique business goals?
Currently, you can create custom dashboards using a predefined list of charts and metrics within Gorgias reports. Gorgias is a mature platform that is constantly evolving, with even more advanced custom reporting capabilities planned for 2026.
How do Gorgias reports help me measure my team's efficiency and individual agent performance?
The Agent performance report within Gorgias reports allows you to track individual metrics such as tickets closed per agent, their average CSAT score, and personal first response and resolution times. This helps identify top performers and areas for coaching.
Do Gorgias reports provide a unified view of customer interactions across all my business tools?
Gorgias reports are highly specialized for data within the Gorgias platform. For a broader view that integrates insights from other tools in your tech stack, such as knowledge bases or internal communication platforms, Gorgias offers a robust App Store with various integration options.
What are the capabilities of Gorgias reports when it comes to AI automation?
The AI agent reports within Gorgias reports are designed to track the performance of Gorgias's native AI and automation features. They provide deep insights into how Gorgias's own tools are optimizing your support workflow.
How can I enhance the insights I get from Gorgias reports if I need more advanced analytics?
You can enhance Gorgias reports by integrating third-party BI and analytics tools available in the Gorgias App Store, or by using specialized solutions like eesel AI. These tools can complement Gorgias data with information from your entire knowledge ecosystem for deeper, more connected insights.