

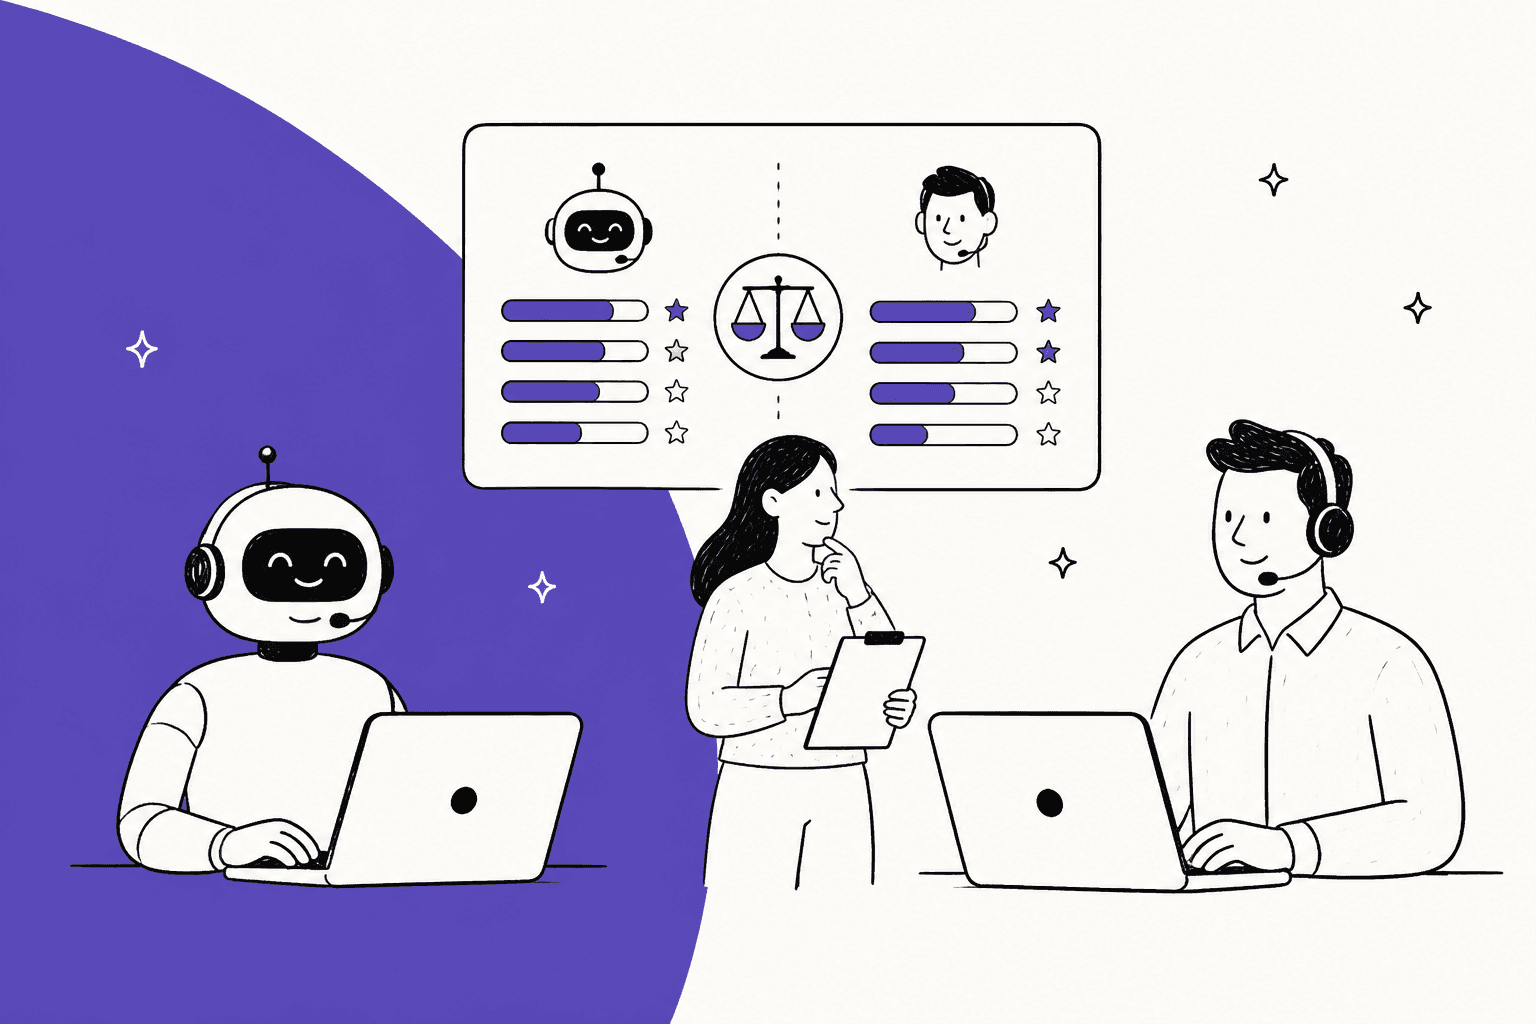
The only AI support agent benchmark worth acting on is your agent and your team graded on the same tickets, with one definition of "resolved". Vendor resolution rates can't be compared with each other: Zendesk, Gorgias, HubSpot, Freshdesk, Salesforce and Help Scout each use a different test, so the same silent customer counts as a win in one tool and a maybe in another. Public tests like tau-bench rank models, not your setup. eesel's simulation does exactly this: it replays your solved tickets against what your team actually sent and scores each topic before anything reaches a customer.
What does "benchmarking an AI support agent" actually mean?
I build AI agents at eesel, and the most common question I hear after a rollout is some version of "is 60% good?" The honest answer is that it depends on which 60%. When someone says "benchmark", they usually mean one of three different things, and mixing them up is how teams end up with a number they can't act on.
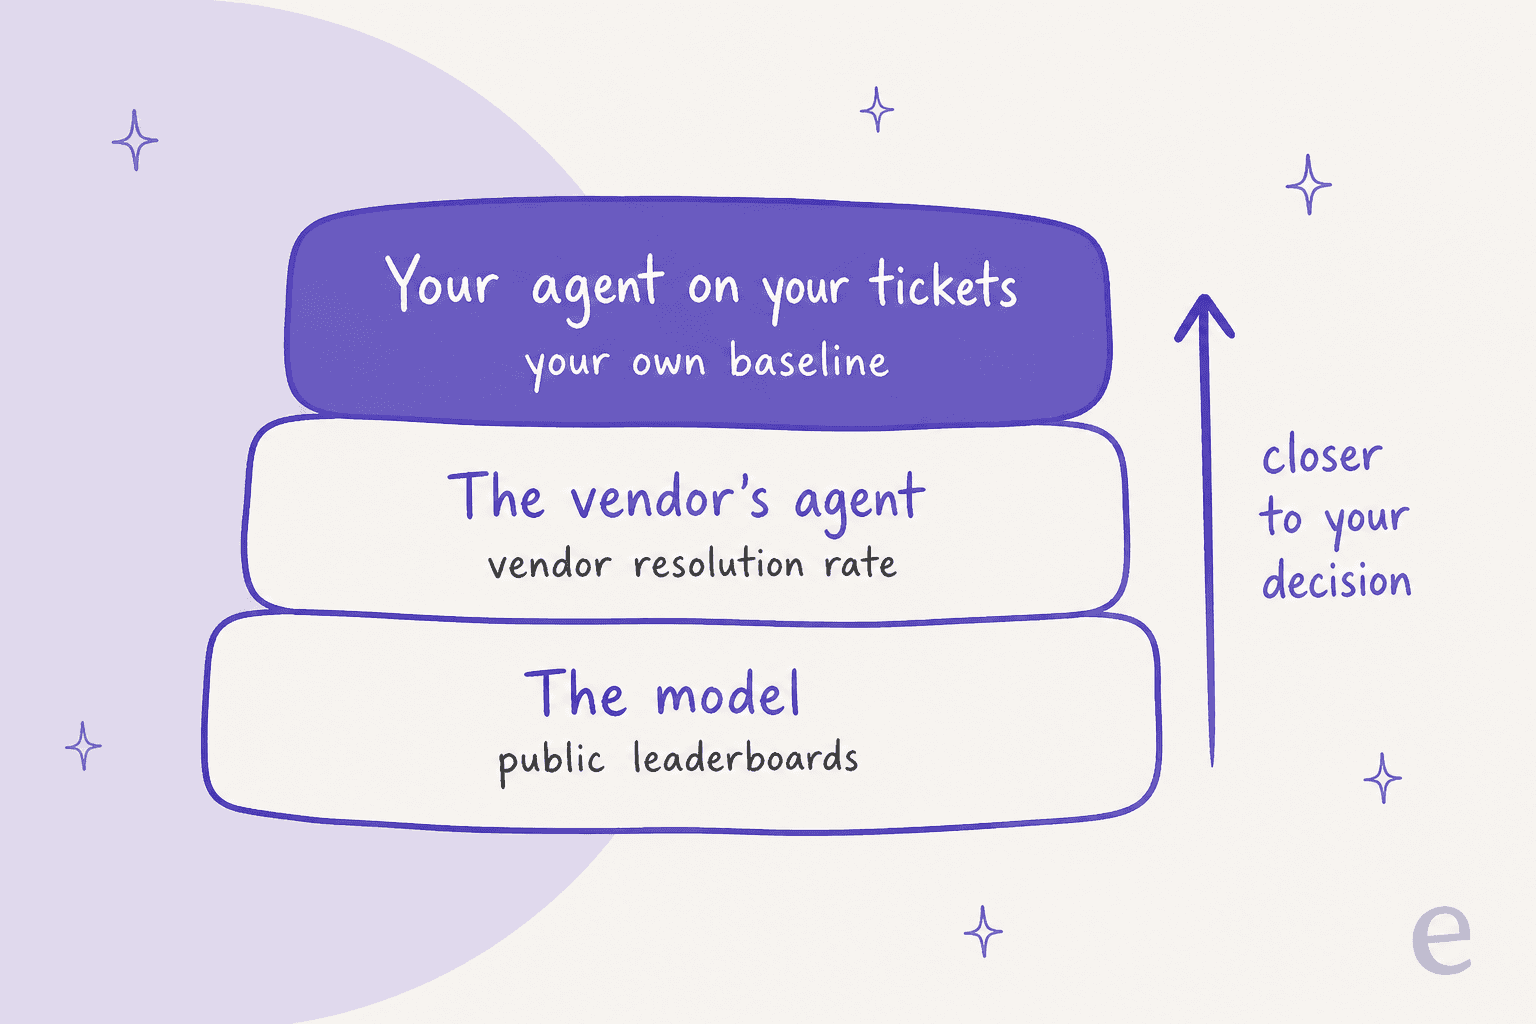
- The model. Public leaderboards like tau-bench test the underlying large language model on simulated support tasks. Useful for picking a model, silent on your knowledge base.
- The vendor's agent. The resolution rate your helpdesk shows you, or the average a vendor puts on its homepage. Each one is defined by that vendor, for that vendor's billing.
- Your agent on your tickets. Your setup, your docs, your policies, graded against how your own team handled the same questions. This is the one that tells you whether to widen what the AI handles.
Each layer is closer to the decision you actually have to make. The rest of this post walks through all three, because the failure I see most is a team quoting layer two as if it were layer three.
Why can't you compare vendor resolution rates?
Because every vendor counts a resolution with a different test, and most of them bill on that same test. I went through each vendor's own help docs this week, and no two of them agree on what "resolved" means.
| Vendor | What counts as resolved | Window | Billed on it? | Price per unit |
|---|---|---|---|---|
| Zendesk | AI answered, customer asked for nothing more, and an LLM confirms the request was satisfactorily resolved. Fails the check = "Contained", not billed | 72h for email, 2h by default for messaging (up to 72h), counted from the first message | Yes | $1.50 committed, $2.00 pay-as-you-go |
| Gorgias | Fully handled by AI or automation, no human needed within 72 hours | 72h | Yes, plus the ticket fee | $1.50 overage on the pricing page |
| HubSpot | Agent replied with a content source or action and no visitor-initiated handoff, or a lead was marked qualified, partially qualified or not qualified | 72h after the last visitor message | Yes | $0.50 (50 credits) |
| Freshdesk Freddy | Reporting: closed without human intervention. Billing is per session, whatever the outcome | 24h chat, 72h email per session | No, billed per session | $49 per 100 sessions |
| Salesforce Agentforce | "Deflected" when an LLM scores the session 4 or 5, meaning "mostly or fully resolved" | 2h abandonment timeout | No, billed per conversation | $2 per conversation |
| Help Scout | AI answered and the customer did not ask for more help afterwards | Not documented | Yes | $0.75 |
Three differences matter more than the rest.
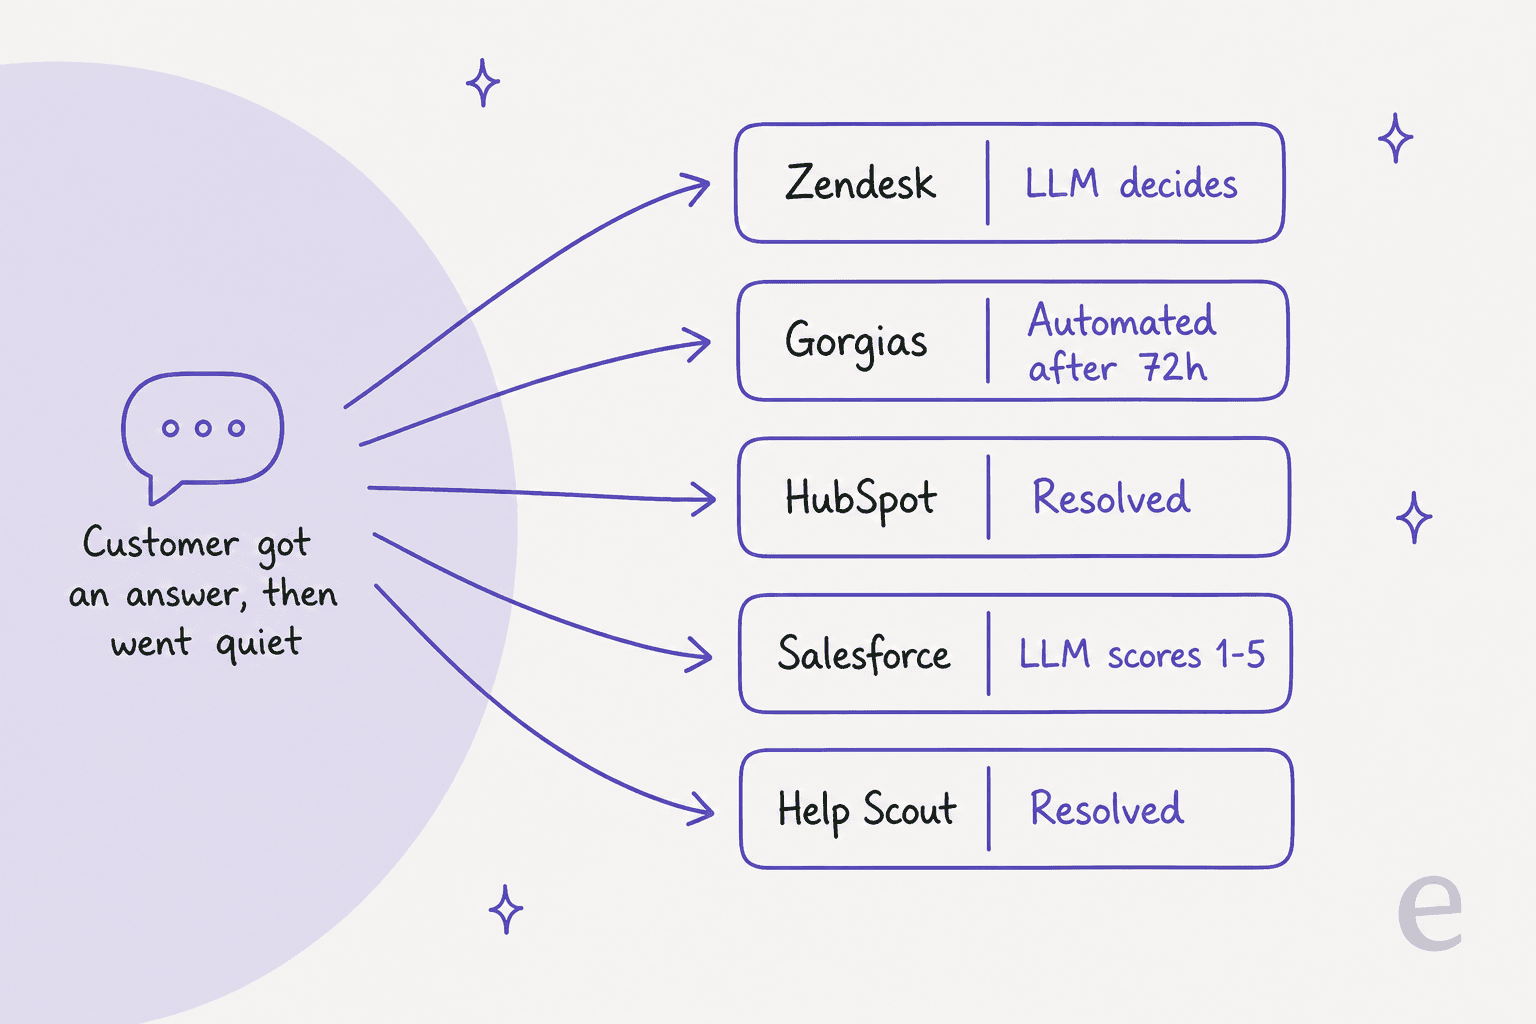
Who decides it worked. Zendesk and Salesforce put an LLM judge on the transcript. Gorgias, HubSpot and Help Scout count the absence of a human: nobody asked for a person, so it counts. Those are different questions. "Did the customer get what they needed?" and "did the customer give up quietly?" look identical in a metric that only checks for silence.
What blocks a resolution. HubSpot's own docs say only visitor-initiated handoffs count against it, and that later events such as "messages from a live agent, a transfer request, or negative feedback, will not change the resolution status". A workflow that routes a ticket to a person after the agent replied doesn't undo the resolution.
What the denominator is. Gorgias reports two numbers that sound alike: a Success rate over tickets the AI handled, and an Automation rate over your whole billable workload. Same month, same tickets, two very different percentages.
Here's what that looks like on one ordinary conversation: the agent answers, and the customer never writes back.
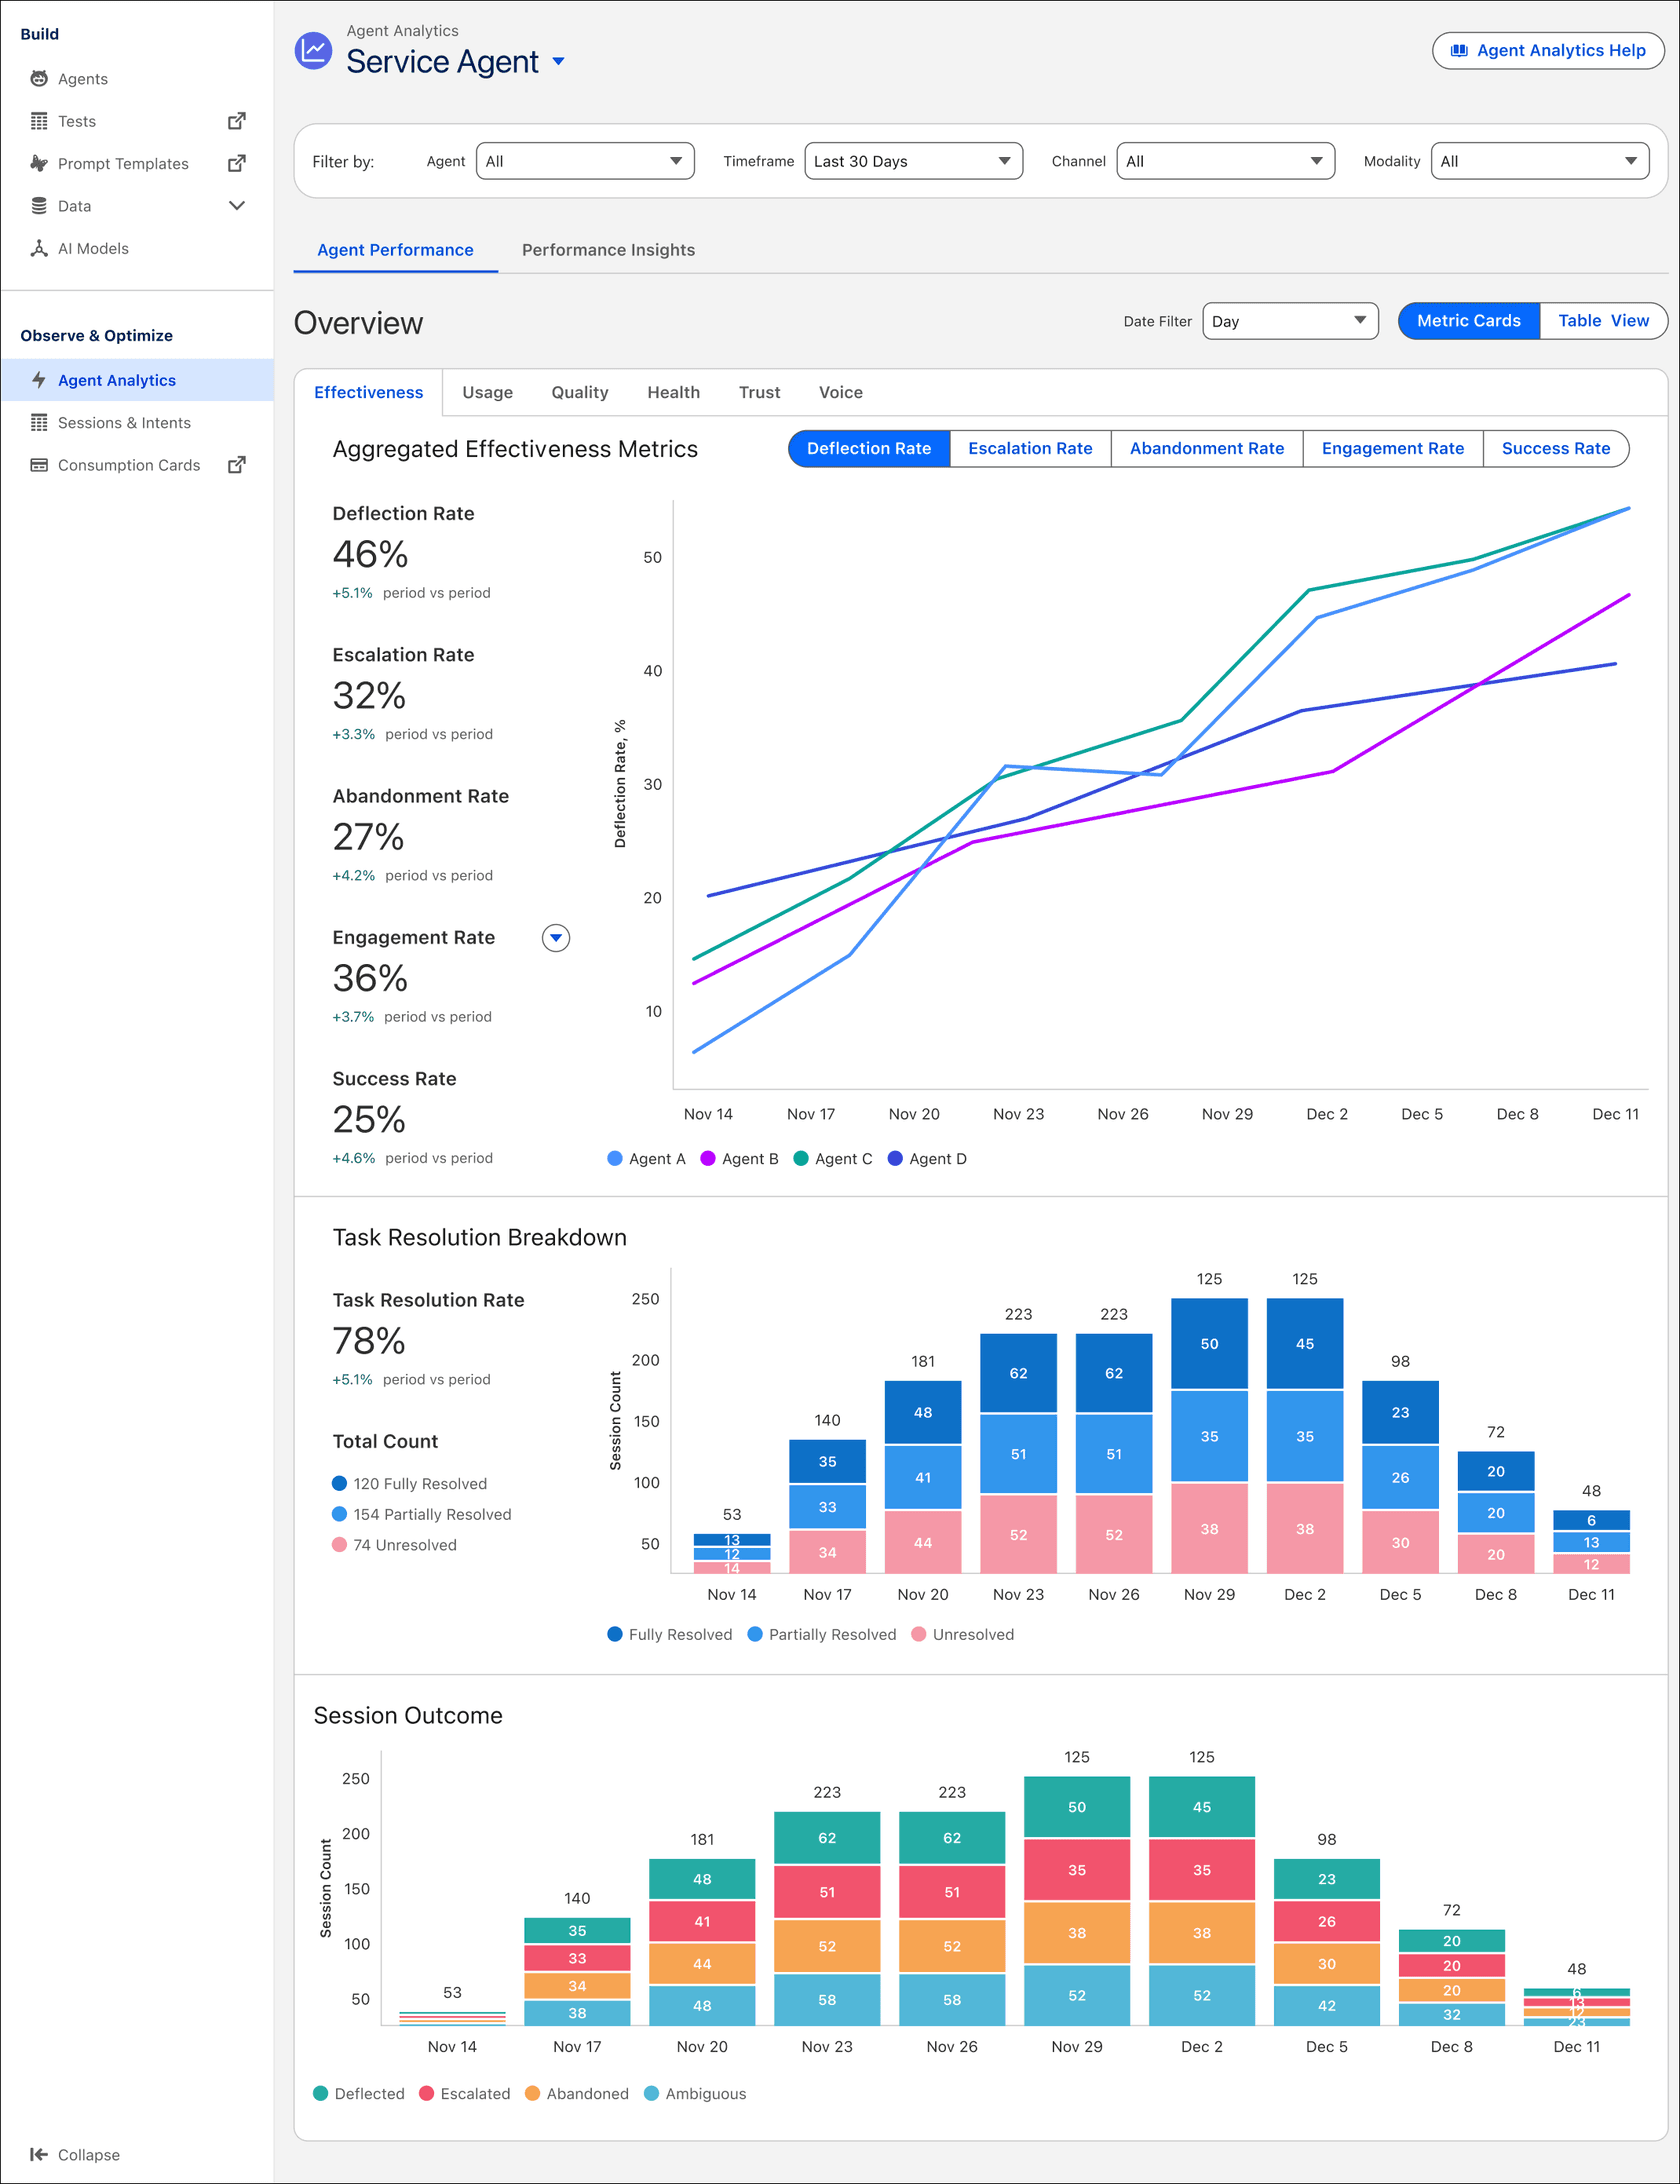
Even inside one product, the number moves with the metric you pick. Salesforce's own Agent Analytics example dashboard shows the same set of sessions at a 46% deflection rate, a 25% success rate and a 78% task resolution rate.
None of this makes the vendors dishonest. Each definition is documented, and Zendesk's own blog warns that "different tools may classify 'resolved' in different ways". It just means a homepage claim like HubSpot's 65% of conversations across 8,000+ customers is a HubSpot-definition number. It isn't a bar your Zendesk or Gorgias agent can be held to.
For the definitions in more depth, start with my post on deflection vs resolution rate. Zendesk users can go further with Zendesk AI agent metrics, and the pricing side is in cost per resolution.
"For comparing vendors, the only fair test I know is to run them on the same slice of your own traffic and score it with your own definition. Their published numbers mostly just tell you which definition they chose."

What do public benchmarks like tau-bench tell you?
They tell you which models handle support-style tasks well and, more usefully, how often they get the same task right twice. Sierra's tau-bench puts a model in front of a simulated customer with real tools and a policy document, then, per the tau-bench paper, checks "the database state at the end of a conversation" against the correct one. It doesn't grade how nice the reply sounded. It grades whether the refund actually went through, and whether it should have.
The idea worth stealing for your own benchmark is pass^k. The paper's authors define it as "the chance that all k i.i.d. task trials are successful": run the same task k times with a customer who phrases it differently each time, and count it only if every run succeeds. In the original paper, the best agent cleared over 60% of retail tasks once, but under 25% when it had to clear the same task eight times.
The current leaderboard tells the same story. I pulled every submission from Sierra's public results bucket:
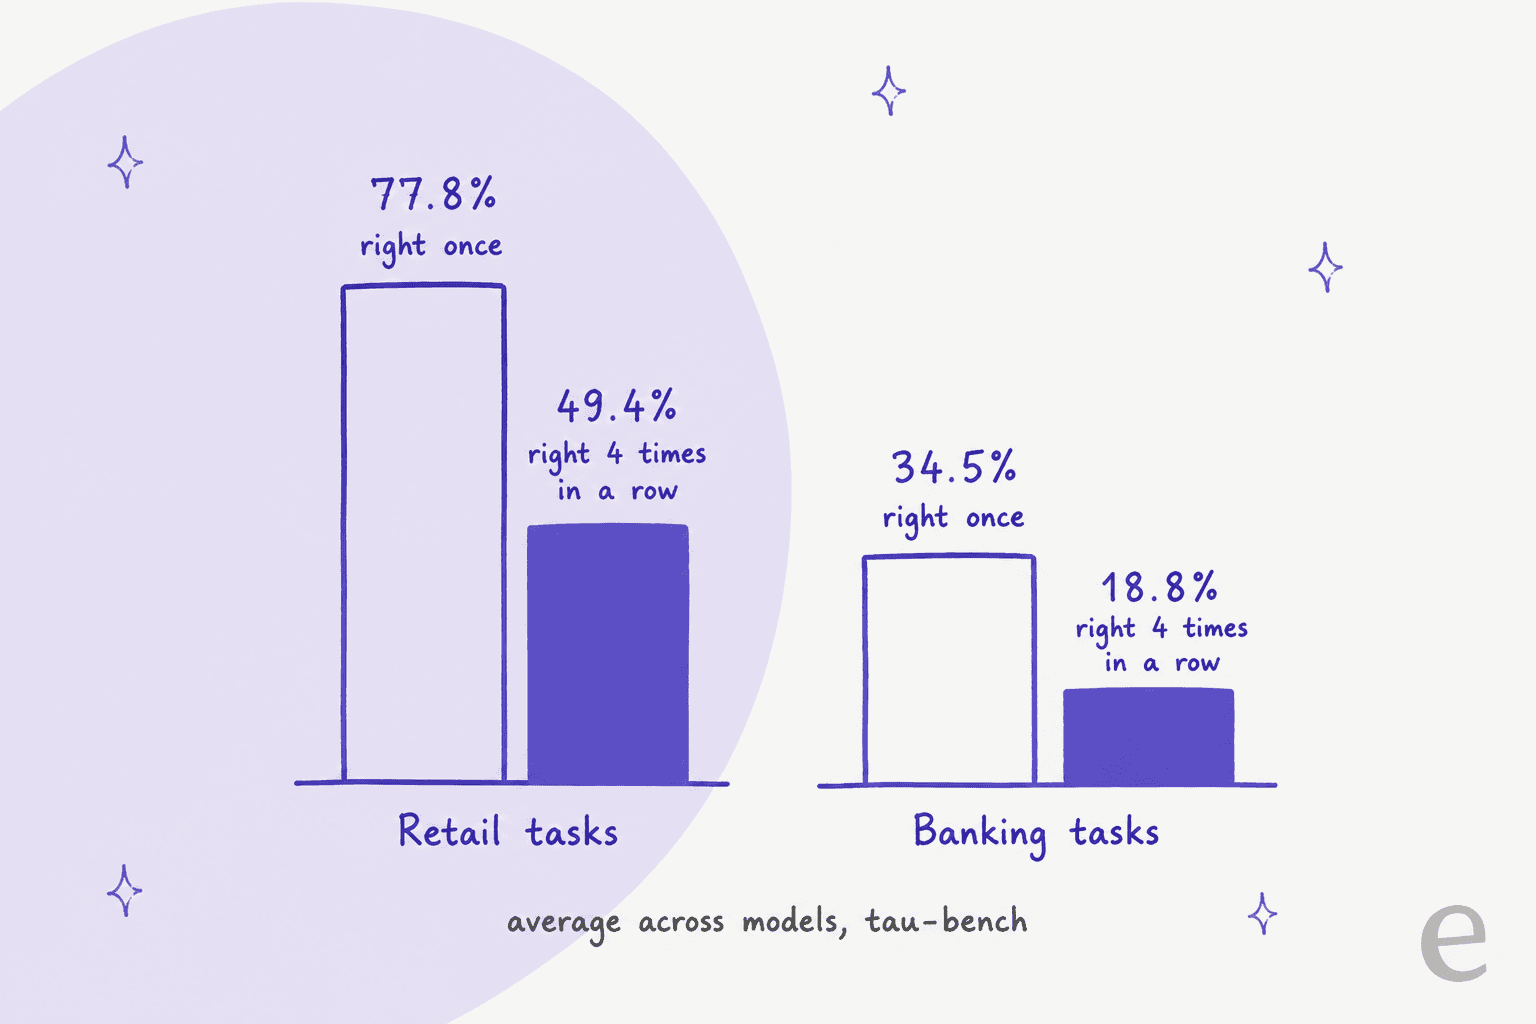
Banking is the harder test because the answer lives in 698 policy documents rather than in a tool, and tasks need 18.6 documents and 9.5 tool calls on average, per the tau-Knowledge write-up. That's the shape most real helpdesks are in: the answer is in your docs somewhere. The best text model there, Qwen 3.8 Max, scores 55.2 once and 35.1 across four runs.
If you want a broader view, Fireworks publishes a Customer Support index that keeps five benchmarks side by side instead of blending them into one score:
| Benchmark (owner) | What it tests | Scoring | Leader (Nov 2026) |
|---|---|---|---|
| τ³-Banking (Sierra) | Policy-bound banking requests with tools and a simulated user | Mean trial reward | Gemini 4 Argon 58.25%, Claude Opus 5.5 56.01% |
| Cresta-Bench (Cresta) | 181 simulated calls across 4 contact-center agents | pass^3, "a case counts only when all three runs pass" | Claude Opus 5.5 82.57%, Claude Haiku 5.5 last at 20.05% |
| DuetBench-Diagnosis (Decagon) | Real diagnosis conversations replayed, blinded judge | Elo rating | Claude Opus 5 1034.9 |
| τ³-Voice (Sierra) | Full-duplex voice agents | Pass@1 | Pine Voice 1.0 87.33% |
| vCX (Retell AI) | Voice agents following instructions and calling tools | Score | GPT-6.1 Sol 93.4% |
Two caveats before you lean on any of this. First, 27 of the 29 text submissions on tau-bench were run by Sierra itself, so it's one lab's harness, not an independent league. Second, and more important, none of these tests know anything about your return policy, your macros or the three help articles that contradict each other. A model leaderboard isn't a leaderboard of finished support agents. Use these to shortlist a model, then test your setup. I go deeper on model choice in my support model roundup.
How do you benchmark your AI agent against your human team?
You grade both on the same ticket types, with the same rubric, inside the same window. The trap is the raw average: the AI gets password resets and order status, your team gets the angry refund disputes, and the AI ends up looking faster and better because its tickets were easier.
Here's the method I'd run, and it's the one I'd hand any team starting out.
- Pick one definition of resolved and write it down. My default: the customer's problem was fixed, nothing contradicted policy, and the customer didn't come back about the same issue within 7 days. That's stricter than every row in the vendor table above, and it should be.
- Split your tickets by topic first. Refunds, order status, how-to, billing, bugs. Benchmark per topic, never as one blended number. A 90% on how-to questions and a 40% on refunds average out to something meaningless.
- Replay solved tickets before you look at live data. Take tickets your team already closed, have the agent answer them with nothing sent, and compare each answer with what your team actually wrote. Your team's reply is the baseline. This is where you catch the worst failures, and it costs nothing in customer goodwill. My simulation testing guide covers grading and sample sizes.
- Grade a blind sample by hand. Mix AI answers and human answers on the same topics, hide which is which, and score them with one rubric: correct, partly correct, wrong, should have handed off. A QA scorecard works fine here.
- Then compare live numbers, per topic, on the same window. Reopen rate, CSAT, time to resolution and cost per resolved ticket, AI vs human, topic by topic.
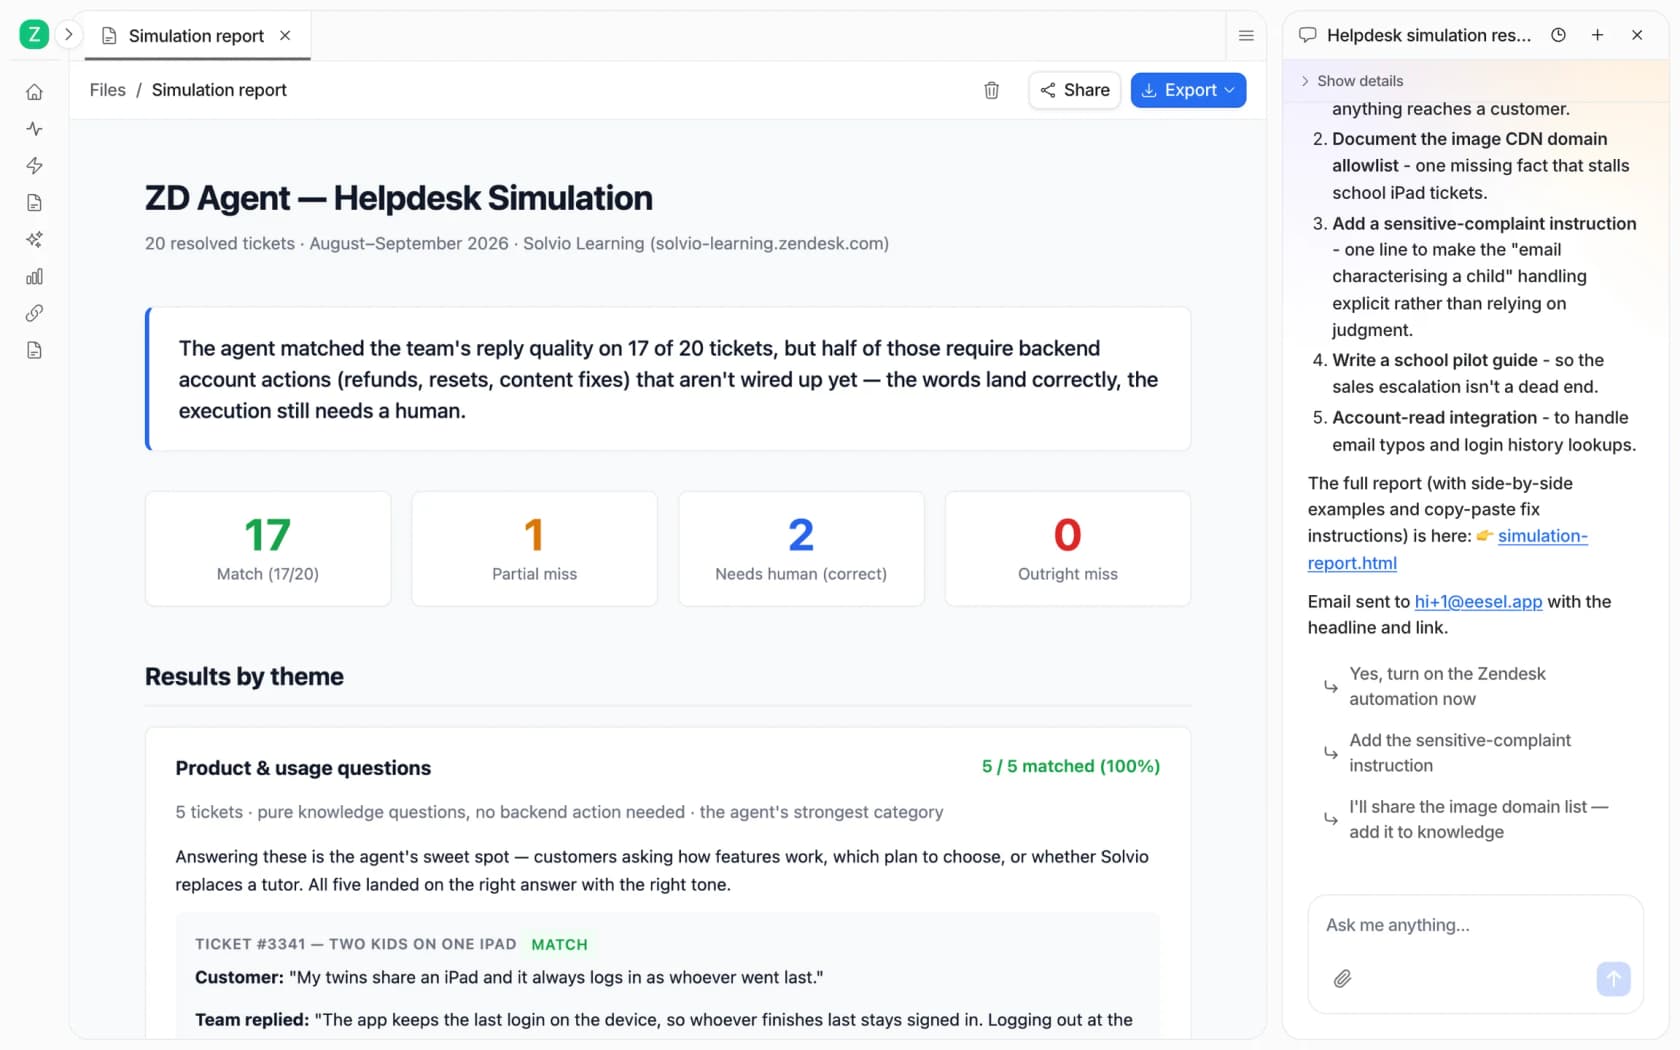
Step 4 matters more than it looks. In one real-traffic trial eesel ran for a German online jewelry retailer on Zendesk and Shopify, the same agent scored 93% on triage accuracy, had a 7% factual error rate, and yet only 12% of its drafts were sent as-is. Three true numbers from one trial, telling three different stories. When I dug into the rewrites, about 65% were the team shortening the draft or changing its tone, which is a style problem, not a correctness one. If I'd benchmarked on "sent as-is" alone, I'd have called a mostly-correct agent a failure.
A separate sample taught me a second lesson: test on real tickets, not the questions you'd ask in a demo. Across a 434-chat sample eesel reviewed, AI chats scored 86% good overall but 79% on chats that came in from real helpdesk tickets. Your own questions are always easier than your customers' questions.
"I cannot go and check all my 7,000 tickets to see if the AI actually made a good answer... I need an AI who is only handling the tickets that it's confident to handle and all the other ones, leave them alone."
A CX lead at a DTC supplements brand on Gorgias and Shopify, on an eesel sales call
That quote is the practical reason to benchmark by topic. You can't audit everything, so the benchmark's real job is to tell you which topics the AI can own and which ones it should hand off.
Which numbers belong on your AI benchmark scorecard?
Fewer than your dashboard shows you. I'd keep five, all measured per topic, all computed from your own data rather than the vendor's resolution field.
| Metric | How to calculate it | Why it's on the list |
|---|---|---|
| Involvement rate | Tickets the AI touched ÷ all tickets | Tells you how much of the queue the AI even sees |
| Containment rate | AI tickets with no human reply ÷ AI tickets | Roughly what most vendors call resolution. Useful, but generous |
| Verified resolution rate | Contained tickets that didn't come back in 7 days and passed QA ÷ AI tickets | The honest version of the number above |
| End-to-end automation rate | Verified resolutions ÷ all tickets | The one finance cares about |
| First contact resolution and CSAT, plus cost per verified resolution, AI vs human | Same formula for both, same topics, same window | The actual head-to-head |
The gap between containment and verified resolution is the most useful single number you'll compute. If it's small, the vendor's figure is close enough to trust. If it's large, the agent is closing tickets that aren't really closed. One operator on Reddit learned this the hard way:
"i track cost per resolution with a 48 hour window for reopens, automation rate alone is basically useless we had a period where our "automation rate" looked incredible but half those customers were just giving up and calling in later, the dashboard was lying to us"
Plug your own month into this to see the spread:
With the default numbers, the same 6,000 AI tickets read as 70% contained and 52% verified, and only 31% of the whole queue is truly automated. All three are honest. Only one of them is the number you should put in front of your boss. For the wider metric set, my AI customer service metrics guide goes further. The customer service KPIs post covers human targets, and cost per ticket benchmarks covers the human side of the cost comparison.
What does a good result look like in practice?
Good looks like a share of topics the AI owns outright, growing on purpose, not one big percentage on day one. The eesel customer stories show this more clearly than any average could, because they report the split of work rather than a single rate.
- ClutchLoop, a phone accessories brand on Gorgias and Shopify, had about
180replies sent to customers directly in a month, "about seven in ten conversations, no person needed". - Question Beauty, a cosmetics brand on Gorgias, saw about
280tickets closed by eesel and about250assigned to a person, out of990handled. - SE Ranking on Zendesk had
2,100live chats answered first by eesel out of4,650conversations. It's now testing direct email replies on test tickets picked by subject line, with each thread tagged open, resolved, escalated or with a person, and a thread only counts as resolved "once the customer says it worked". That's a stricter test than any vendor in the table above. - Cactus Club Cafe runs internal IT support on Zendesk and chose the opposite dial:
790draft replies for the tech team "against 51 sent directly". For their tickets, a person in the loop is the right benchmark target.
"In the first month, eesel is resolving 73% of our tier 1 requests. eesel offers easy Zendesk implementation and setup. Our team implemented and achieved results quickly during our 7-day trial."

Note the scope in that review: tier 1 requests, not every ticket. That's exactly how a benchmark should be quoted. If someone hands you a resolution rate without saying which tickets it covers and how "resolved" was decided, you don't have a benchmark yet. For ways to move the number once you've measured it, see my guide to improving resolution rate.
What are the most common AI benchmarking mistakes?
Most of them come from measuring the easy thing because the dashboard already shows it.
- Benchmarking only answerable questions. If your test set only holds questions your docs cover, you'll miss the worst failure: the agent inventing an answer when the knowledge base has nothing. Add questions you know you can't answer and check that it hands off instead. My post on AI hallucinations in support covers this one.
- Counting closures instead of correctness. A wrong answer that sounds right still closes as resolved.
"The hardest ones are wrong answers that sound right. Nothing errors, the customer doesn't push back, and the ticket can close as resolved. If a refund window changes and the agent is still working from the old policy text, the resolution rate won't flag it, because that metric only counts closures."
- Trusting one run. tau-bench showed scores falling by roughly a third to a half when the same task has to pass four times. Rerun your test set after every change to instructions or docs and look for answers that flip.
- Too few tickets per topic. An 85% on 20 tickets is a range from 64% to 95%. That's a first look, not a verdict.
- Leaving out tricky inputs. Customers paste order numbers wrong, write in two languages and occasionally try to talk the bot into a discount. Adversarial testing belongs in the set.
- Comparing against a vendor average. A vendor's average comes from its own customer mix and its own definition. Your baseline is your team.
If you're still choosing a tool, my vendor evaluation checklist builds this kind of ticket test into the buying process. So does my RFP template, so every vendor gets graded on the same tickets.
Benchmark your AI agent with eesel
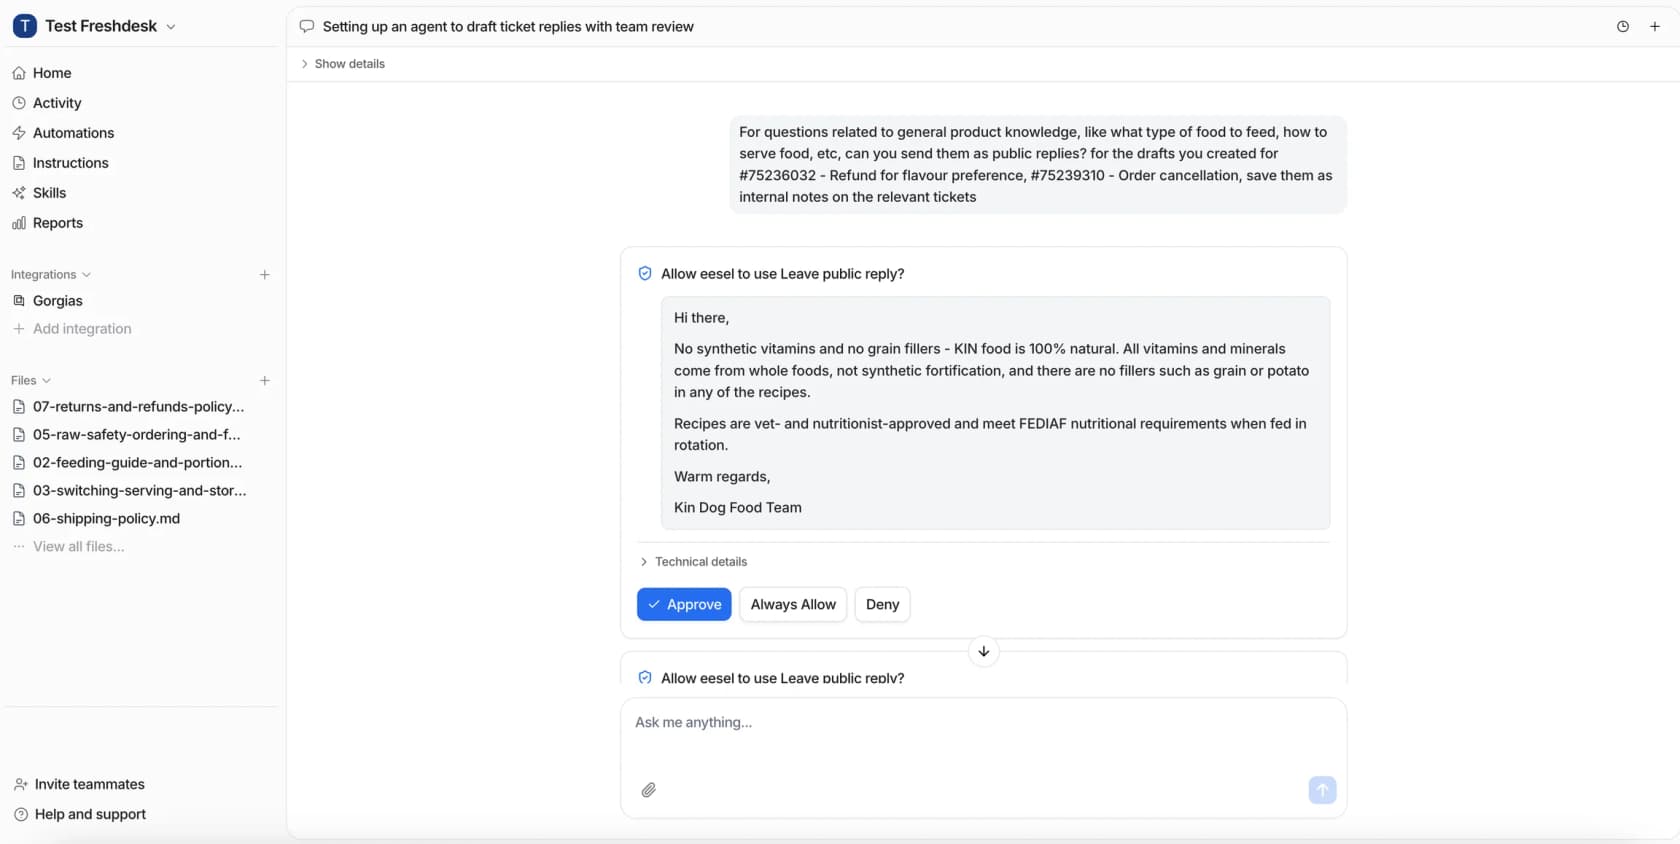
eesel is an AI helpdesk teammate that joins your existing queue, whether that's Zendesk or another helpdesk, and benchmarking is built into how it starts. Per the eesel docs, its simulation "replays your real past tickets and compares its answers to what your team sent", then scores the results by theme and suggests instruction fixes.
Rollout follows the same steps as the method above: start with drafts, let it answer the easy topics, and turn on more once the scores earn it. It works the same way on Freshdesk queues, and the Gorgias integration follows the same rollout.
If you want your own benchmark rather than a vendor's average, run a simulation on last month's solved tickets and see topic by topic where the AI matches your team. Paid plans start at $299 for 500 credits, and a ticket or chat uses one credit. Try eesel on your own tickets first.