


What "measuring customer satisfaction" actually means
I work the support queue most days, and the phrase "measure customer satisfaction" gets thrown around like it's one thing. It isn't. It's shorthand for a few different questions that need different tools:
- Was this specific interaction good? (Did the reply I just sent land?)
- Was it easy for the customer to get what they needed? (Or did they have to fight the help center, wait on hold, and repeat themselves three times?)
- Do they like us overall, enough to stick around and recommend us?
Those are different questions with different answers, and the classic mistake is answering the first with a tool built for the third. A high NPS doesn't tell you your Tuesday-afternoon reply was any good, and a great CSAT on one ticket doesn't mean the customer isn't quietly shopping for a competitor.
Getting this right matters more than it looks. Satisfaction scores drive roadmap decisions, headcount, and whether leadership thinks support is a cost center or a retention engine. If the number is measuring the wrong thing, every decision downstream inherits the error.
The three metrics, and what each one is for
Almost all satisfaction measurement runs on three metrics. Here's the honest version of what each is good for.
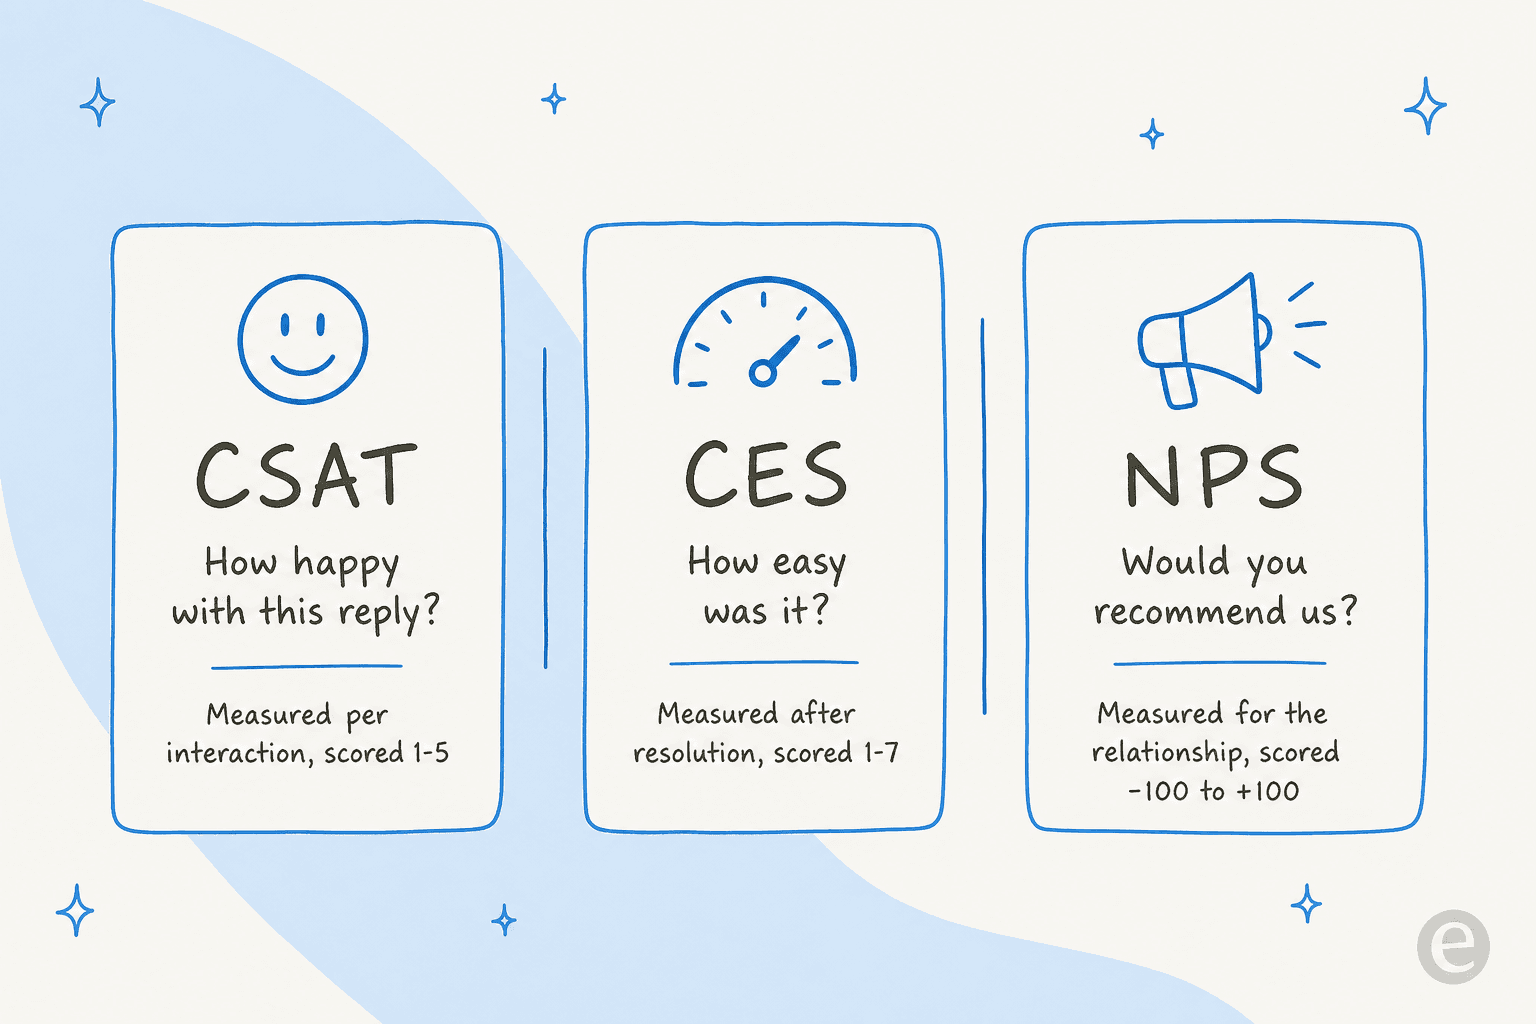
CSAT (Customer Satisfaction Score)
The workhorse. You fire a one-question survey right after a resolved ticket ("How satisfied were you with the support you received?"), usually on a 1-5 scale or a thumbs up/down. Your CSAT is the percentage of responses that were positive (typically 4s and 5s).
It's transactional, which is its strength and its weakness. Strength: it ties a rating to a specific reply, so you can trace a bad score to a specific ticket, agent, or macro. Weakness: it only captures the customers who bother to respond, and it's blind to everything that happened before the ticket. There's a deeper walkthrough of running this at scale in the guide to AI-measured CSAT.
CES (Customer Effort Score)
CES asks a sharper question: "How easy was it to get your issue resolved?" usually on a 1-7 agree/disagree scale. The insight behind it is that effort predicts disloyalty better than delight does. Customers rarely leave because you didn't wow them; they leave because getting help was a slog.
For support teams specifically, CES is often the most actionable of the three, because a high-effort experience points straight at a fixable process: too many handoffs, a confusing knowledge base, a channel that forces customers to repeat themselves.
NPS (Net Promoter Score)
NPS asks "How likely are you to recommend us?" on a 0-10 scale, then subtracts the percentage of detractors (0-6) from the percentage of promoters (9-10). It's a relationship metric, not a support metric. It's useful for tracking brand health over quarters, but it's the wrong tool for judging whether your queue is healthy this week.
A quick rule of thumb I use: if the question you're trying to answer is about a ticket, reach for CSAT or CES. If it's about the company, that's NPS territory.
| Metric | Question it answers | Scale | When to send | Best for |
|---|---|---|---|---|
| CSAT | How happy with this interaction? | 1-5 (or 👍/👎) | Right after a ticket resolves | Judging individual replies, agents, macros |
| CES | How hard was it to get help? | 1-7 agree/disagree | Right after resolution | Spotting broken processes and friction |
| NPS | Would you recommend us? | 0-10 | Periodically (quarterly) | Tracking overall relationship health |
Why your CSAT number probably lies
Here's the part most guides skip. Even a perfectly chosen metric gives you a distorted picture, because of who actually answers the survey.
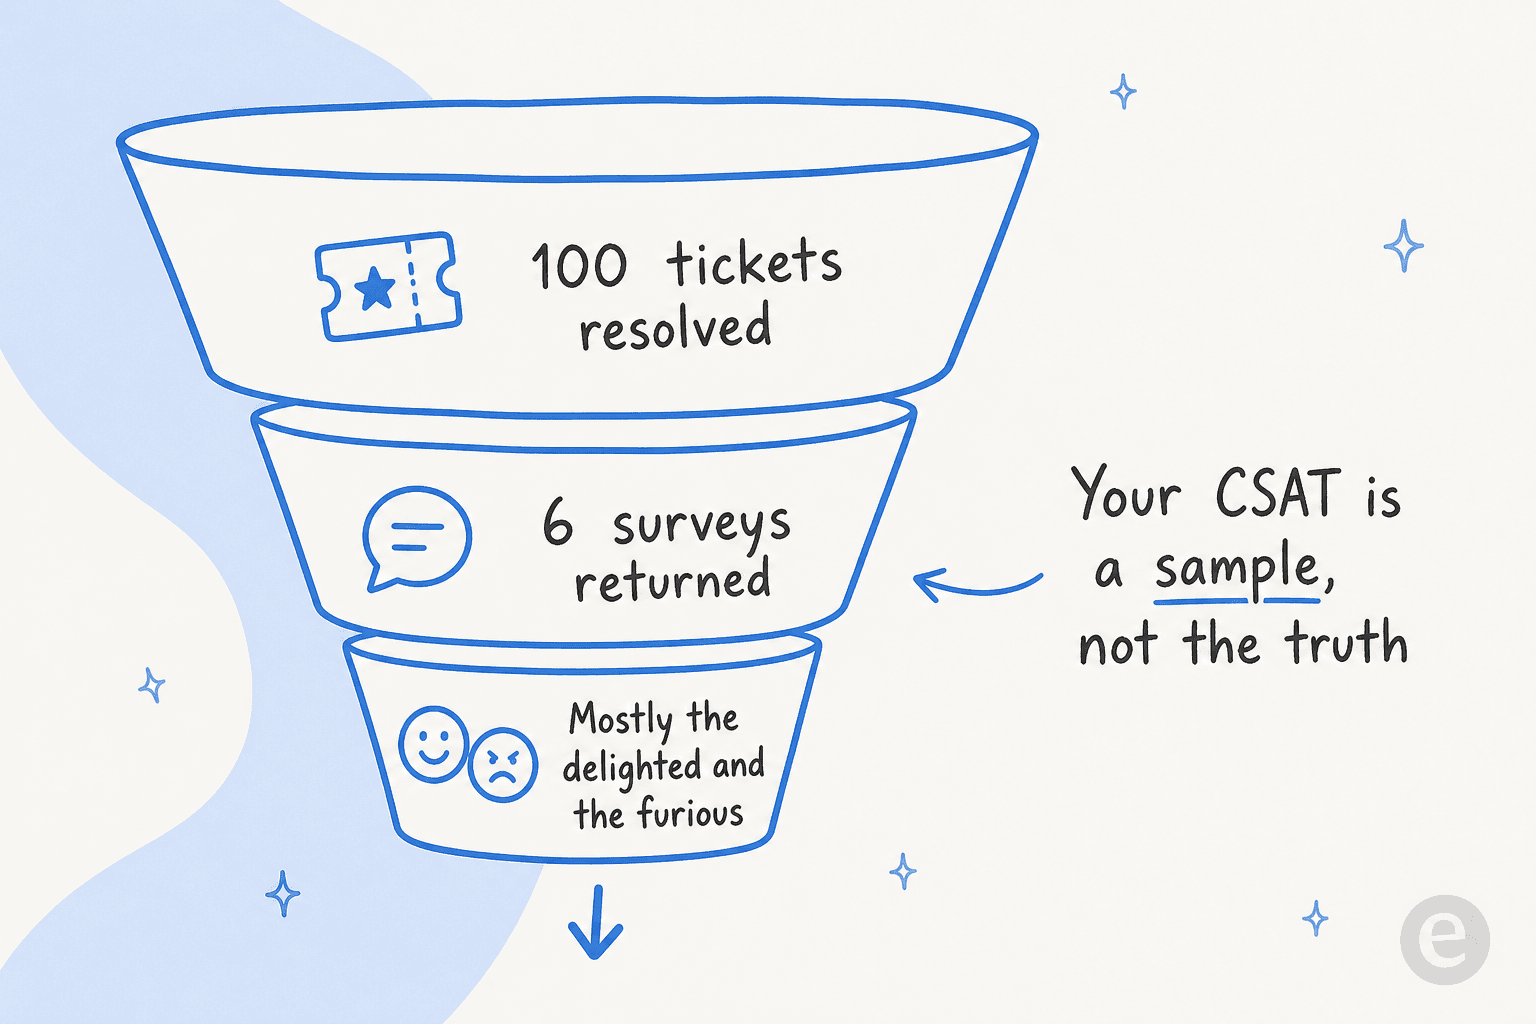
Post-ticket survey response rates are usually low, often in the single digits to low teens. And the people who respond aren't a random sample. They're disproportionately the customers who had a strongly positive or strongly negative experience. The vast, quiet middle (the tickets that got resolved fine, no drama) mostly don't bother.
That does two things to your number. It makes it volatile (a handful of angry responses can tank a weekly score even when nothing changed operationally), and it makes it non-representative (you're measuring the extremes, not the queue). A team celebrating a 94% CSAT on a 4% response rate is celebrating the opinion of the loud few.
None of this means CSAT is useless. It means you should treat the survey as one input, not the verdict, and you should read the trend over a large enough sample rather than obsessing over week-to-week wobbles. And it means the real leverage is in signals that cover everyone.
The signals that predict satisfaction before the survey lands
The survey score is a lagging indicator. By the time it arrives, the experience already happened. If you want to actually move satisfaction, you measure the things that cause it, the operational signals available on every single ticket whether or not the customer ever fills in a form.
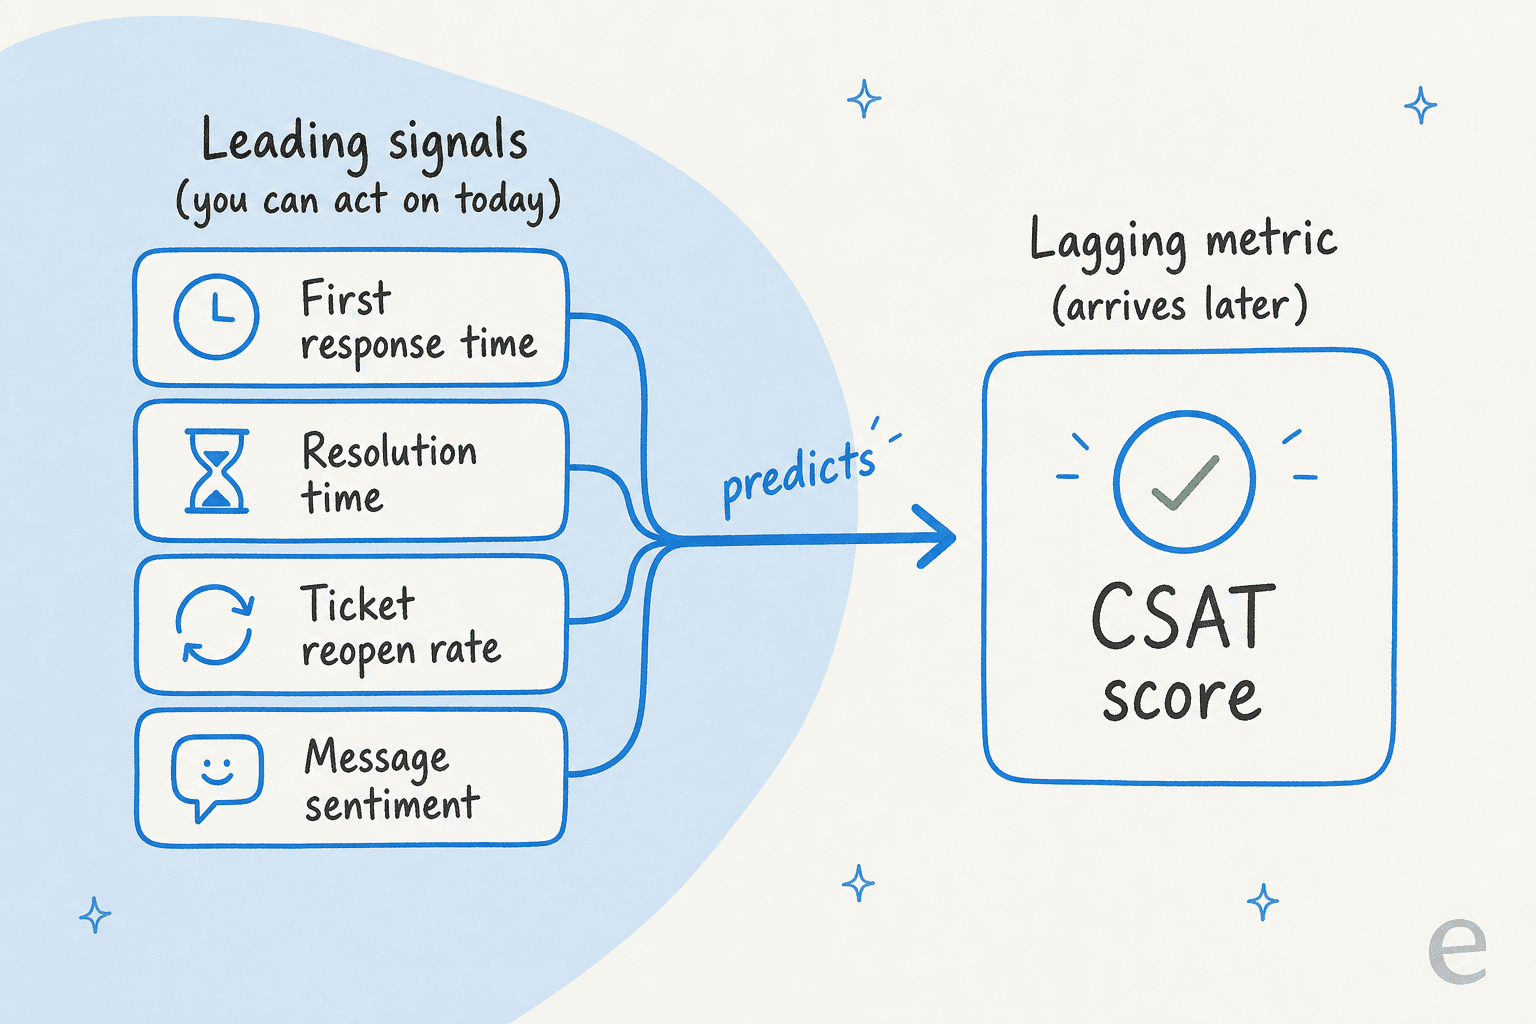
The four that consistently predict satisfaction:
- First response time. How long a customer waits for the first human (or AI) reply. The single most reliable predictor of a bad CSAT is a long silence at the start.
- Resolution time. How long the whole thing took to close. Related but distinct: a fast first reply followed by a week of back-and-forth still frustrates.
- Reopen rate. How often "resolved" tickets come back. A reopened ticket is a customer telling you the answer didn't actually work, without touching a survey.
- Message/ticket sentiment. The emotional tone of the conversation itself. This one used to be impossible to measure at scale; now sentiment analysis reads it automatically on every message.
The beauty of leading indicators is that you can act on them today. A survey tells you last week was bad; a spike in first response time tells you this morning is going sideways while you can still fix it. If you're building out a full measurement stack, my rundown of customer service metrics and the broader AI performance metrics that matter is a good next read.
Try it: what's your real CSAT telling you?
Plug in your own numbers to see your CSAT score and, just as importantly, how much weight your response rate lets you put on it.
The response-rate flag is the point. Two teams can post the same 82% and mean completely different things by it.
Where AI changes how you measure satisfaction
For years, the coverage problem had no good answer. You couldn't ask a human to read the emotional tone of every ticket, so you fell back on the survey sample and hoped it was representative. That's the constraint AI actually lifts.
eesel has spent the last few years putting AI agents on live support queues, and the shift that surprised teams most wasn't automated replies, it was measurement. An AI teammate reads every conversation, so satisfaction stops being a 6% sample and becomes full coverage:
- Sentiment on 100% of tickets, not just the ones that replied to a survey. Every conversation gets a read, so a quietly frustrated customer who'd never fill in a form still shows up in the data.
- Real-time flagging of conversations going sideways, so you can rescue an angry customer mid-thread instead of reading about it in next week's CSAT.
- Theme analysis that clusters the recurring reasons behind low scores, turning "CSAT dipped" into "CSAT dipped because the new returns policy confused people."
Here's what that looks like in practice. eesel's reporting rolls up volume, trigger sources, and where humans stepped in, so the satisfaction story sits next to the operational one:
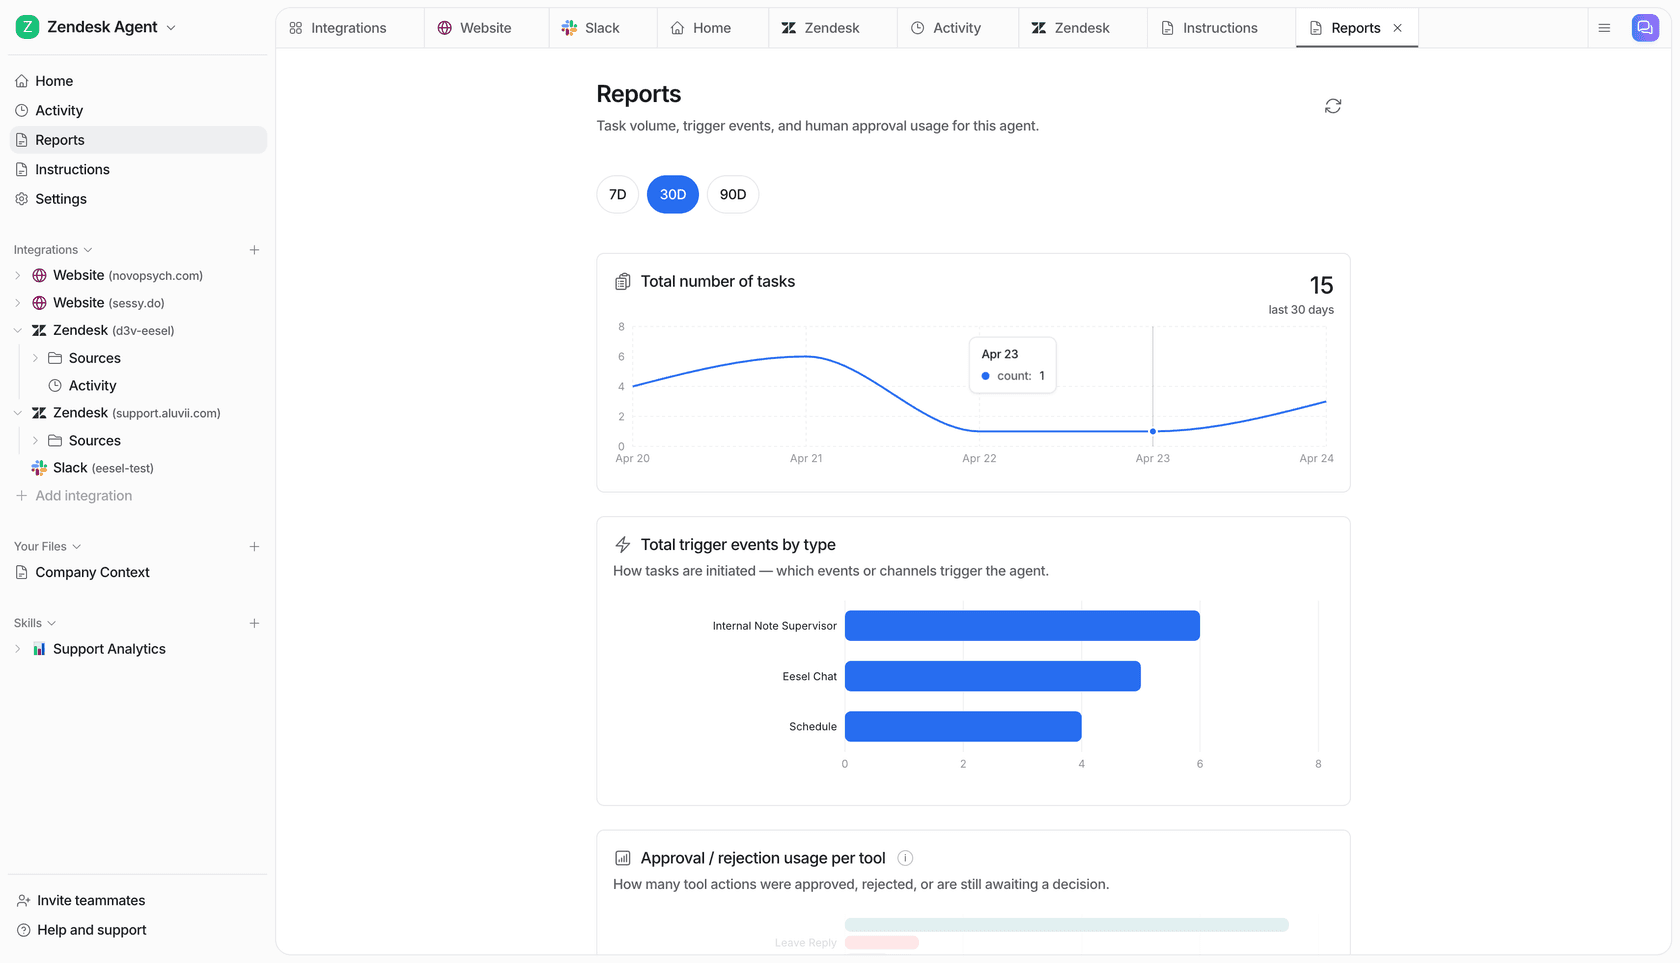
One caution from experience, and it's a real one: AI-measured satisfaction is only as trustworthy as the AI. I've watched a confident-sounding bot quietly give wrong answers, which is exactly why eesel now simulates every rollout against historical tickets before it goes live, and why low-confidence answers get routed to a human rather than sent. If you're going to let AI touch measurement, measure the AI too, its resolution rate, its containment and escalation quality, and its own error rate. In one week-long trial cohort, I watched answer quality land at 96% across 581 chats, but the only reason that number means anything is that all 581 were measured, not a survey sample of them.
Common mistakes I see teams make
A few patterns come up over and over when teams set up satisfaction measurement:
- Chasing the score instead of the cause. The number is a symptom. If CSAT drops, the answer isn't a team pep talk, it's finding which tickets, topics, or channels dragged it down. Sentiment analysis and theme clustering are what turn the score back into a cause.
- Surveying too often. One survey per resolved ticket, not one per message. Survey fatigue crushes response rates, which makes your already-thin sample thinner.
- Ignoring the response rate entirely. A score with no denominator is a vanity metric. Always report the response rate next to the score.
- Measuring satisfaction but not effort. CES catches the slow, painful resolutions that a "satisfied, eventually" CSAT hides.
- Assuming happy equals loyal. They're related, not the same. A customer can rate a ticket 5/5 and still churn on price. As a colleague, Amogh, put it after a post-mortem on a churned account, "we didn't lose them on product, we lost them because nobody framed the ROI." Satisfaction is necessary, not sufficient, so read it alongside retention signals.
Try eesel for measuring customer satisfaction across your whole queue
If the theme of this guide is "stop measuring a sample," eesel is the practical way to do it. It's an AI teammate that plugs into your existing helpdesk (Zendesk, Freshdesk, Gorgias, Front, and more) in a few minutes, learns from your past tickets and help docs, and reads sentiment and themes across every conversation, not just the ones that came back with a rating.
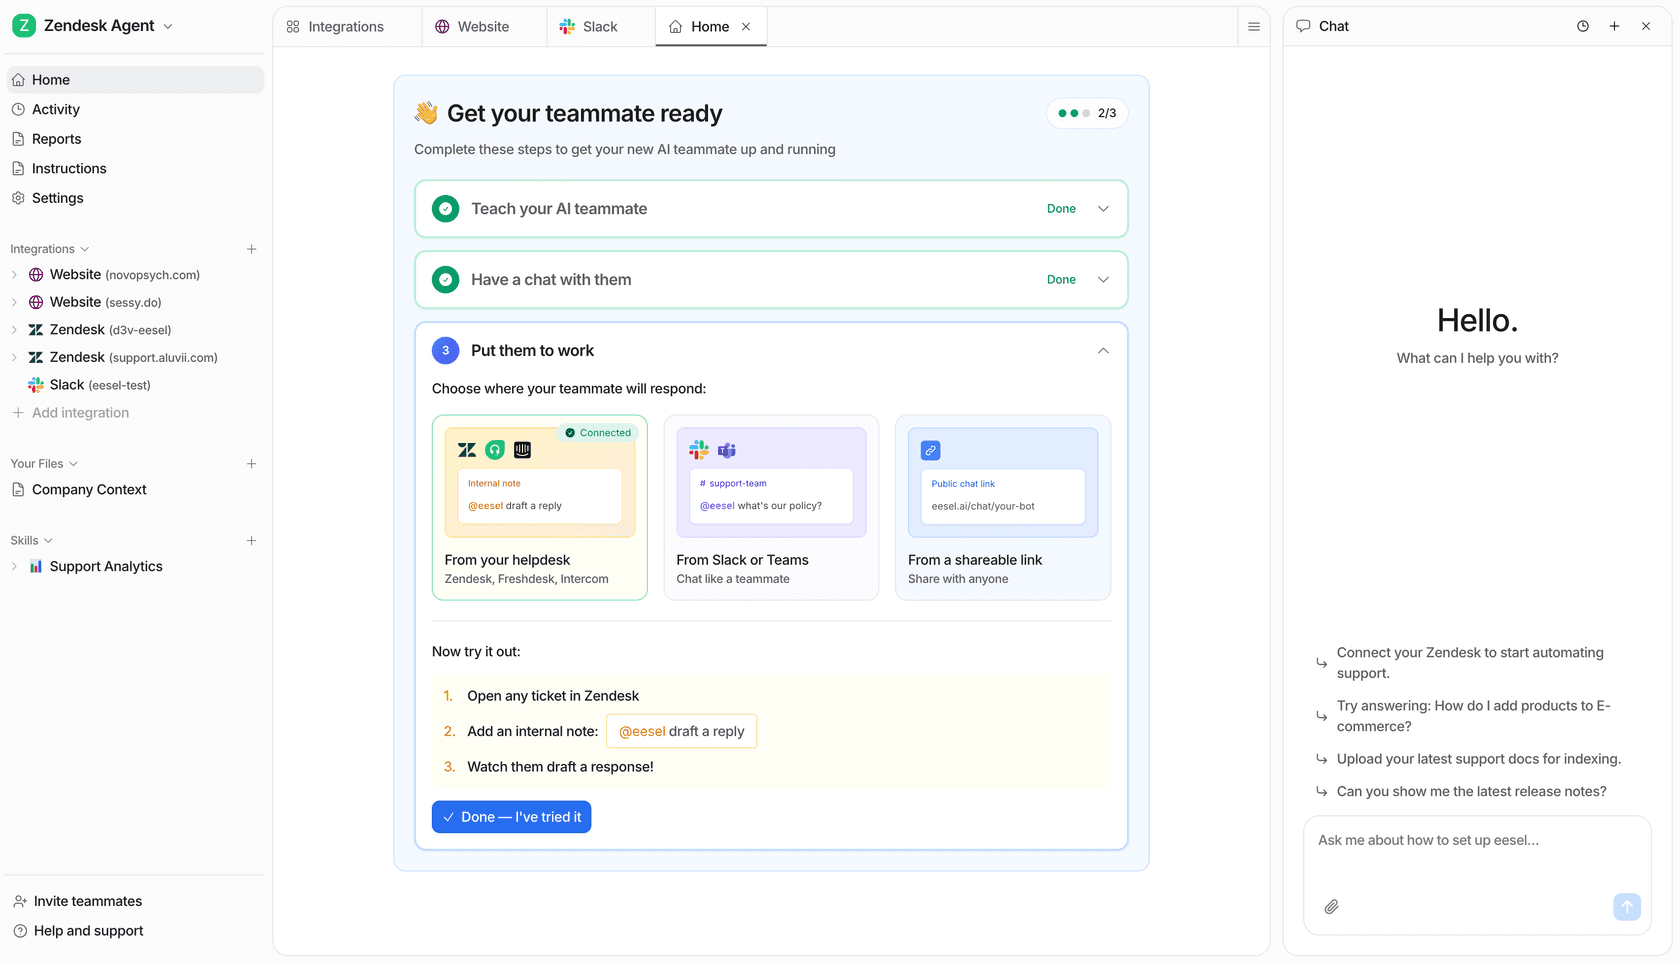
The bit I'd flag as most different: before you turn anything on, you can simulate against your historical tickets to see exactly how it would have handled them, so measurement isn't a leap of faith. Pricing is usage-based at 40¢ per ticket with no per-seat fees, and the free trial gives you $50 of usage with no credit card, which is plenty to run a real measurement pass on your own queue. You're only charged for tickets the AI handles, never the ones your team does.
Frequently Asked Questions
What is the best way to start measuring customer satisfaction?
What is a good CSAT score for a support team?
How do you measure customer satisfaction without annoying customers with surveys?
What is the difference between CSAT, NPS, and CES?
Can AI help with measuring customer satisfaction?


Article by
Riellvriany Indriawan
Riell is a designer and writer at eesel AI with about two years of experience researching CX platforms, AI chatbots, and helpdesk software. She combines her design background with a sharp eye for how these tools actually look and feel in practice — making her comparisons unusually visual and user-focused.