


What CSAT, NPS, and CES actually measure
The three metrics get lumped together as "customer feedback," but they're answering different questions, and using the wrong one at the wrong moment is why so many customer service metrics programs produce a number nobody trusts.
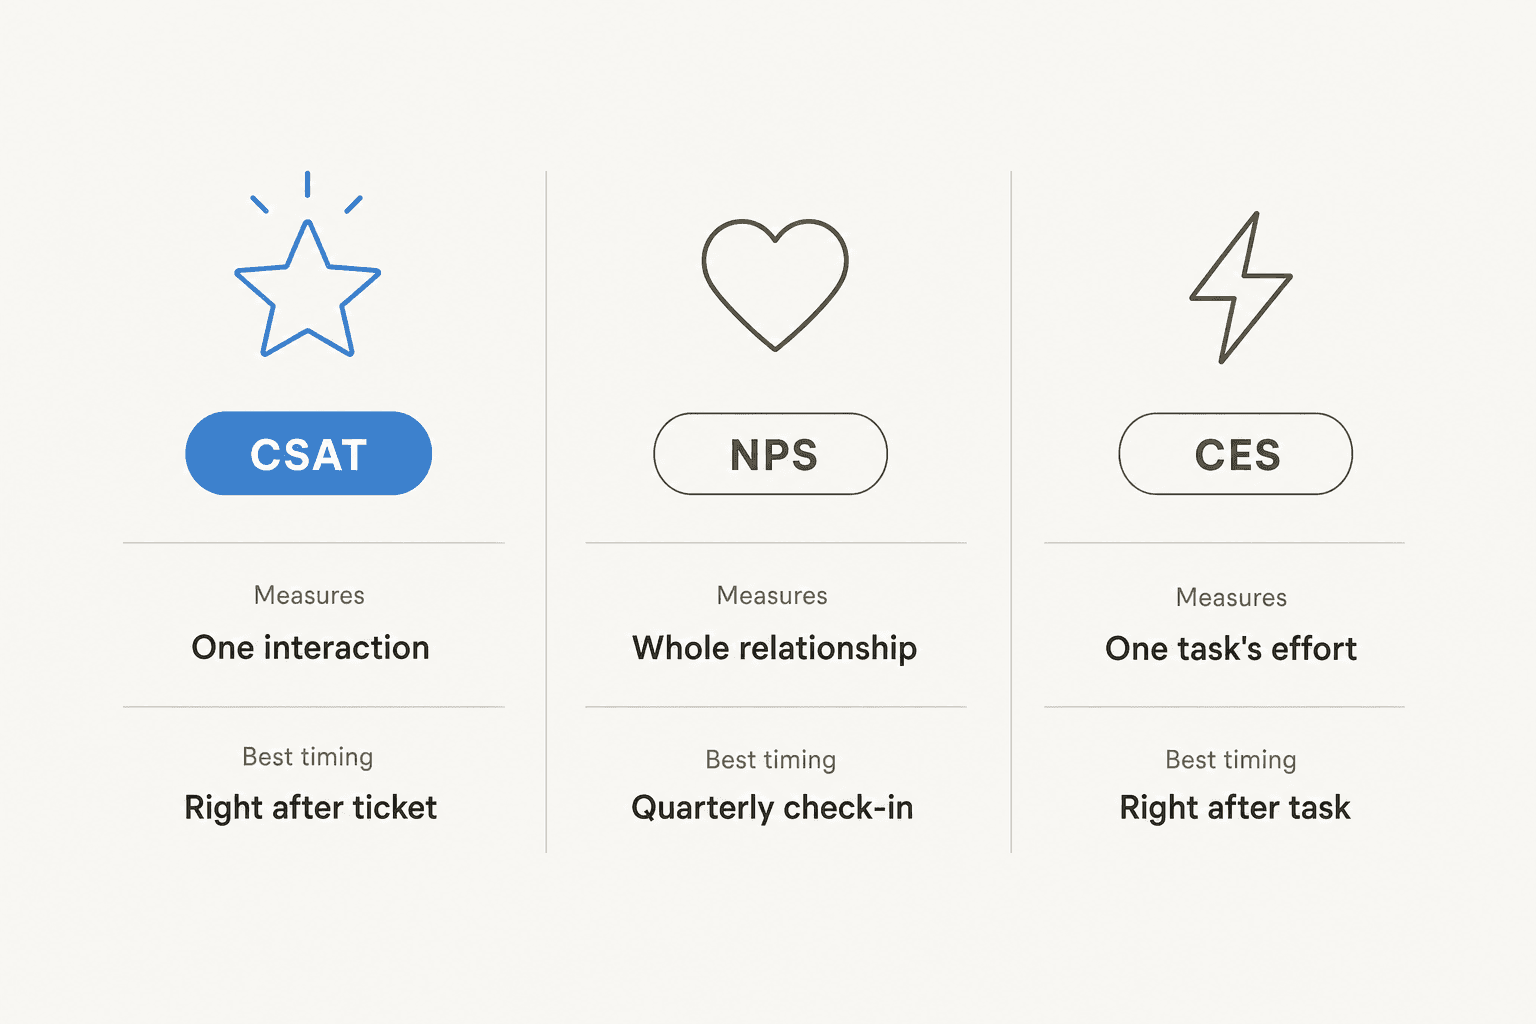
CSAT is a "right here, right now" score tied to one specific interaction rather than an ongoing relationship - the standard question is "How would you rate your overall satisfaction with the service you received?" on a 1-5 scale, and only the top two responses (4 and 5) count toward the score. NPS, first developed in 2003 by Bain & Company, is the opposite: a single 0-10 question - "How likely is it that you would recommend us to a friend or colleague?" - meant to capture the entire relationship, not one ticket. CES sits in between: a single-item "how easy or difficult was this" rating, based on research showing that reducing customer effort predicts loyalty better than trying to delight people.
| Metric | Scope | Best timing | Formula |
|---|---|---|---|
| CSAT | One interaction | Immediately to 24 hours after a ticket closes | (satisfied responses [4-5] ÷ total responses) × 100 |
| NPS | Whole relationship | Quarterly or annually, not per-ticket | % Promoters (9-10) − % Detractors (0-6) |
| CES | One task's effort | Immediately after the task or ticket | Average effort rating, no percentage formula |
Qualtrics is explicit that NPS is a poor fit run transactionally: asking "would you recommend us" after every single ticket annoys customers over an interaction too small to justify the question. And a Bain & Company score above 50 sounds excellent until you learn grocery retail averages 30 and consumer payments averages -6 - benchmark against your own industry and your own history, not a universal number.
CSAT survey question examples
These are pulled directly from live SurveyMonkey CSAT templates, the format most people fill out without realizing it's a CSAT survey: rating a driver, rating a coffee order, a one-tap form after a purchase.
- "Overall, how satisfied or dissatisfied are you with our company?"
- "Overall, how satisfied or dissatisfied are you with our products and services?"
- "How well do our products and services meet your needs?"
- "How would you rate the quality of our products and services?"
- "Overall, how satisfied or dissatisfied are you with [PRODUCT]?"
- "Which of the following words would you use to describe our products? Select all that apply."
For a support-specific CSAT check, Zendesk's own guidance keeps it even tighter: one rating question, no more.
NPS survey question examples
NPS is always the same core question, so most of the variation is in what gets attached to the score, not the score itself:
- "How likely is it that you would recommend [COMPANY] to a friend or colleague?" - the standard question, typically paired with an open-ended "why" follow-up so the number comes with context.
- "How likely is it that you would recommend our service to a friend or colleague?" - B2B phrasing.
- "How likely is it that you would recommend [PRODUCT] to a friend or colleague?" - product-specific phrasing when a company sells more than one thing.
Respondents bucket into three groups: Promoters (9-10), Passives (7-8), and Detractors (0-6). The "why" follow-up is where the useful detail actually lives - the score alone tells you the temperature, not the cause.
CES survey question examples
- "How easy or difficult was it to get the support you needed?"
- "On a scale of 'very easy' to 'very difficult', how easy was it to interact with [company name]?" - the standard CES phrasing.
The stakes behind that one question are larger than it looks: per The Effortless Experience, 96% of customers who have a high-effort service interaction become more disloyal, against just 9% of those with a low-effort one. CES is cheap to ask and expensive to ignore.
Post-ticket and post-purchase survey examples
- "Overall, how would you rate the quality of your customer service experience?"
- "How well did we understand your questions and concerns?"
- "How much time did it take us to address your questions and concerns?"
- "How much time did it take us to resolve your customer support needs?"
- "Overall, how satisfied or dissatisfied are you with our company's customer onboarding process?"
SurveyMonkey notes this type is meant to go out "directly after a customer interacts with customer support to monitor the impression your representatives leave" - which is a timing rule as much as a content one, covered next.
When to actually send it (and how long it should be)
Timing skews the result more than the wording does. Zendesk's default is to hold the CSAT survey for roughly 24 hours after a ticket is marked solved, giving the fix time to actually hold before the customer rates it. Messaging channels can show the survey the moment the ticket closes since there's no inbox to interrupt, but email tickets wait out the full window.
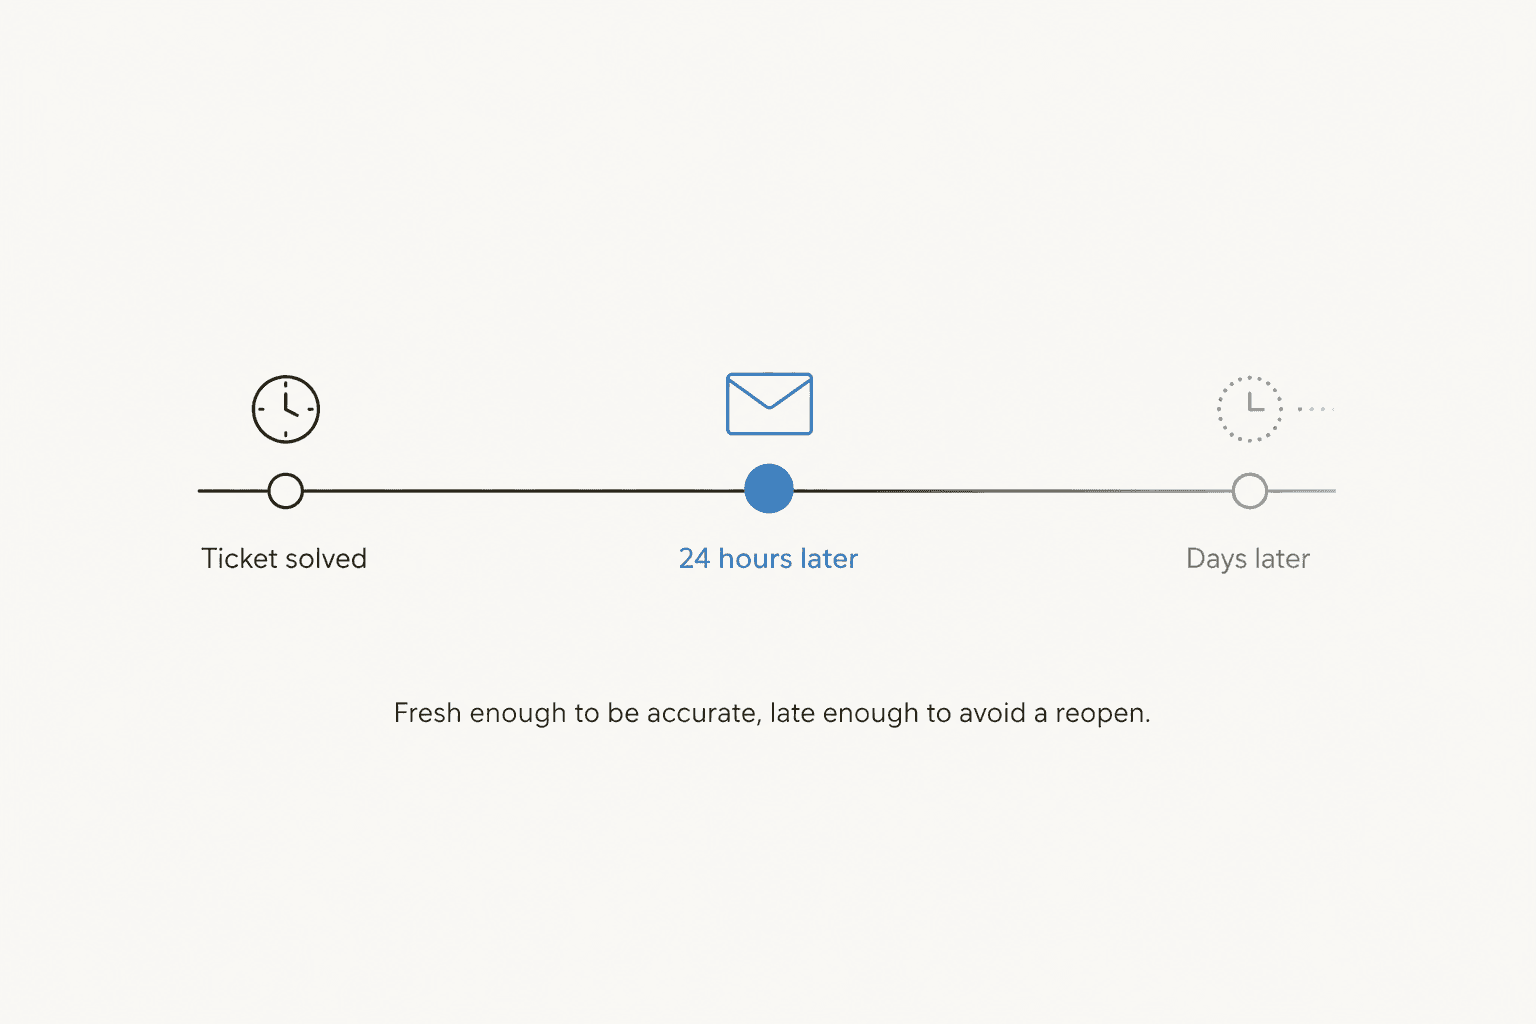
The right delay depends on how often your team reopens tickets. If resolution is usually instant and clean, sending right away captures the interaction while it's fresh; if reopens are common, waiting avoids an irritated customer rating a fix that hadn't actually landed yet. One tactical trap: bundling the "your ticket is closed" notice and the survey into one email lifts response rate, but it can't be recalled if the ticket reopens - fine for low-reopen teams, a liability for anyone else.
On length: keep it under 10 questions, and design against the mobile time budget, not desktop - surveys should stay under 9 minutes on mobile and 12 on desktop, since open-ended questions accelerate fatigue faster than closed ones and should be used sparingly.
How to avoid survey fatigue
The core rule is picking your moments instead of asking after everything. Qualtrics' guidance is blunt about it: don't quiz the same customer at every touchpoint, decide which moments actually produce useful insight, and survey only those.
- Avoid double-barrel questions that ask about two things but allow one answer - they confuse respondents and produce data you can't attribute.
- Ask the overall rating first, so the highest-value answer is captured even if someone drops off mid-survey.
- Cut internal jargon that forces the respondent to stop and interpret a question.
- Send one to three reminders with refreshed wording each time, never the identical message repeated.
- Skip the visible progress bar - respondents reportedly respond better to a human cue like "nearly there!" than a bar showing exactly how much is left.
A practitioner on Hacker News put the sharper version of this bluntly: NPS in particular gets treated as a vanity number rather than a working tool.
"Ditched it, and now only deal with a cut down version every year or so with clients. CSAT has been far more illuminating. NPS often indicates success, while CSAT would actually show issues happening on the ground. It feels like NPS is idealistic and in the clouds, while CSAT is grounded and shows real feedback."

What actually moves your response rate
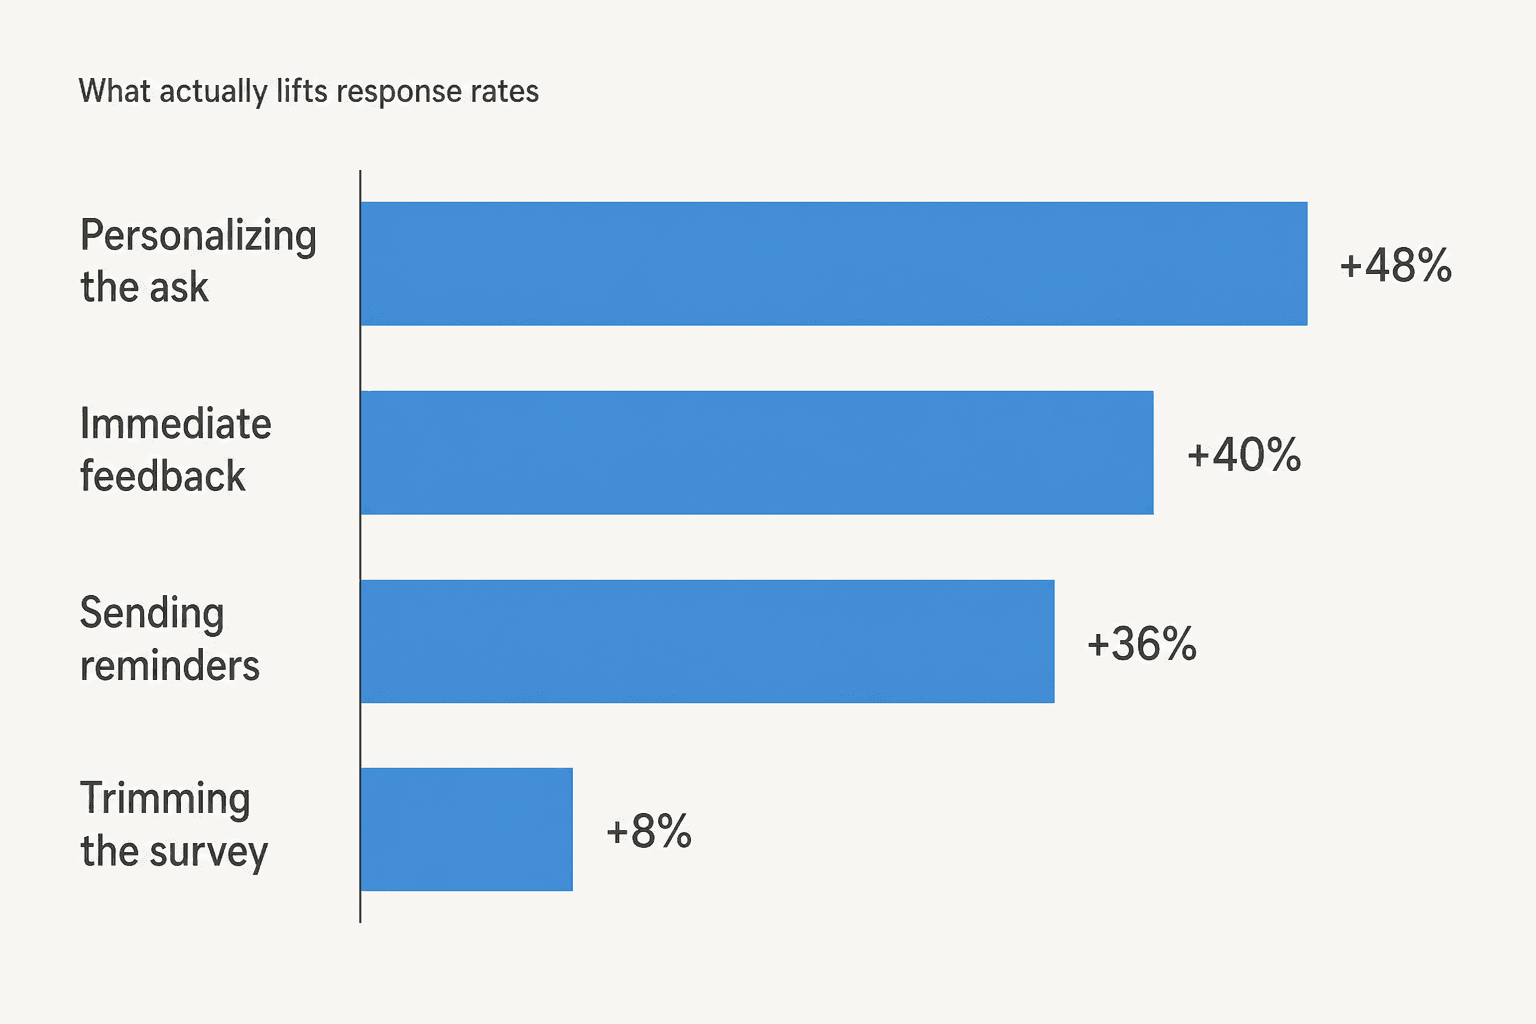
There's no fixed industry-average response rate - practitioners on Qualtrics' own community forum report ranges anywhere from 3% to 30% depending on the program. What has a measured effect is more useful than chasing a benchmark that doesn't exist:
| Tactic | Reported lift |
|---|---|
| Personalizing the ask | Up to +48% |
| Asking immediately, not a day later | More responses, and +40% more accurate |
| Sending reminders with fresh wording | Up to +36% |
| Restructuring a bloated survey | +8% in one A/B test |
Worth flagging since the two get conflated constantly: response rate is completions ÷ everyone the survey was sent to, while completion rate is completions ÷ everyone who actually opened it - a survey can look like it's converting well on one metric and badly on the other.
The most common CSAT and NPS mistakes
- Treating CSAT as a loyalty metric. It measures one interaction, not the customer's lifetime relationship - using it as a stand-in for broader loyalty misreads the number.
- Surveying everyone the same way. Not every customer should get every survey - partners or specific product users often need a different, more in-depth channel.
- Collecting feedback and never closing the loop. 70% of consumers say they'd do business with a company again if a complaint was handled well the first time - a low score you don't act on wastes the goodwill of the person who bothered to answer.
- Keeping the data siloed. Product needs to see product complaints and support needs to see service complaints - role-based access, not one inbox only the CX lead reads.
- Asking for data you already have. Pull demographic details from the CRM instead of re-asking in the survey - every extra field is another reason to abandon.
A LinkedIn post from CX practitioner Augie Ray gets at the mistake underneath most of these: the problem usually isn't how often you ask.
"I literally just got off a call with a client discussing that survey fatigue may be a problem, but the real issue isn't that customers don't want to provide feedback, but that they get tired of providing feedback and feeling like it goes into a deep, dark hole."

That "deep, dark hole" is the whole failure mode. A Capterra reviewer of the survey tool Delighted made the adjacent point about the tools themselves: simplicity beats flexibility for a metric this simple.
"NPS is an easy thing. You have to ask your customer how likely they would be to refer you to a friend on a scale of 1 to 10. However, simple tasks like this are often horribly over engineered."

Setting this up in a real helpdesk
If Zendesk is your helpdesk, most of the mechanics above are configurable directly in the product rather than something you build from scratch:
- Trigger the satisfaction survey on solve instead of on a fixed schedule that ignores ticket state.
- Add custom questions to the default CSAT survey if the single rating isn't enough context for your team.
- Set up CSAT measurement and reporting so scores roll up somewhere your team actually looks.
- Configure account settings for satisfaction once, rather than per-view.
- Know the difference between a good and a bad CSAT rating in your own reporting before you set an internal target.
Freshdesk runs the same pattern with its own NPS survey setup, and it can be configured to send CSAT only once resolution is confirmed - the same 24-hour-delay logic as Zendesk, just a different settings screen. Ecommerce teams on Gorgias get a similar setup, with its own CSAT report view for rolling scores up by agent. The same rule applies to whichever helpdesk you run: the survey is only as good as the ticket automation and the AI agent work that preceded it, which is where most of the actual score gets decided.
Try eesel for Zendesk CSAT
A survey question can only tell the truth about an interaction that already happened - it can't fix a slow, generic reply after the fact. eesel reads a team's past Zendesk tickets and help docs, then drafts or sends replies directly inside the queue, with confidence-based routing so anything it isn't sure about goes to a human instead of going out low-confidence. One customer, Gridwise, saw eesel resolve 73% of tier-1 requests in its first month - the kind of change that shows up in the CSAT number before you ever have to explain it in a QBR.
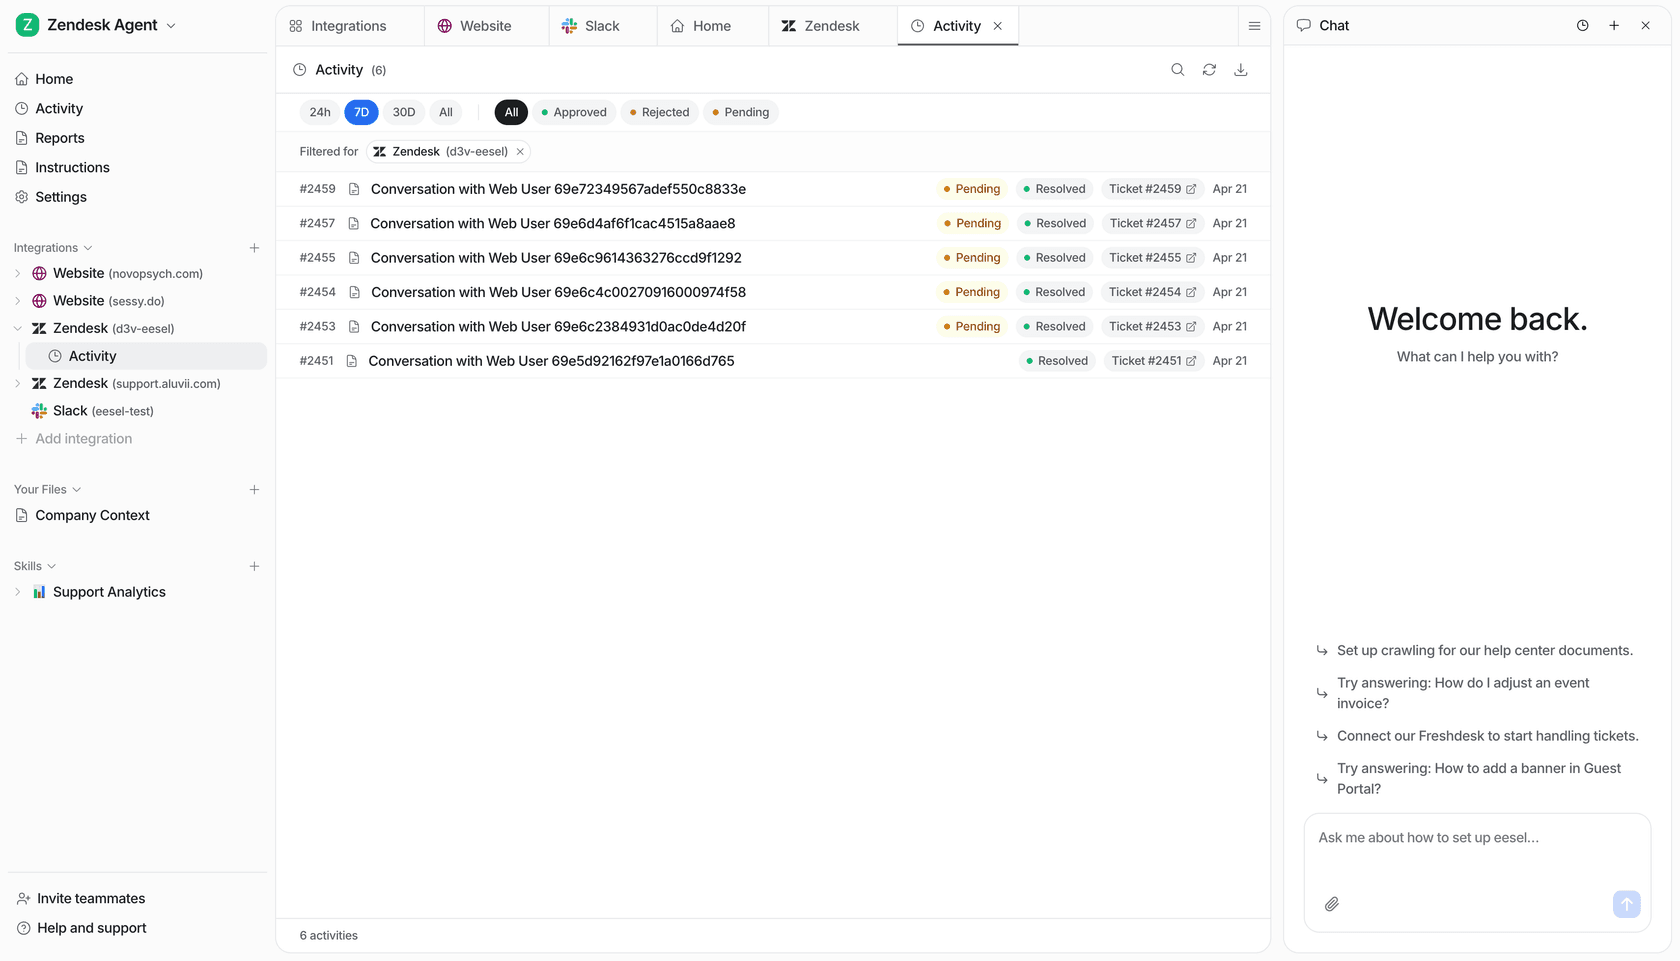
If you're already running survey question samples across onboarding and churn, this is the same discipline applied one layer earlier: the AI helpdesk work happens before the survey ever goes out, so the answer it gets back is one you'd actually want to report. Try eesel free, no credit card required.
Frequently Asked Questions
What is a good CSAT score for customer service?
What's the difference between a CSAT, NPS, and CES survey?
How many questions should a customer service survey have?
When should I send a customer satisfaction survey after a support ticket?
How can I increase my customer service survey response rate?



Article by
Riellvriany Indriawan
Riell is a designer and writer at eesel AI with about two years of experience researching CX platforms, AI chatbots, and helpdesk software. She combines her design background with a sharp eye for how these tools actually look and feel in practice — making her comparisons unusually visual and user-focused.