How to measure customer service: metrics that matter

Riellvriany Indriawan

Katelin Teen
Last edited July 6, 2026

Why measuring customer service trips teams up
Here's the thing I see over and over: a team sets up a dashboard, fills it with everything their helpdesk can count, and six months later nobody looks at it. The numbers went up and to the right, and the customers were still frustrated.
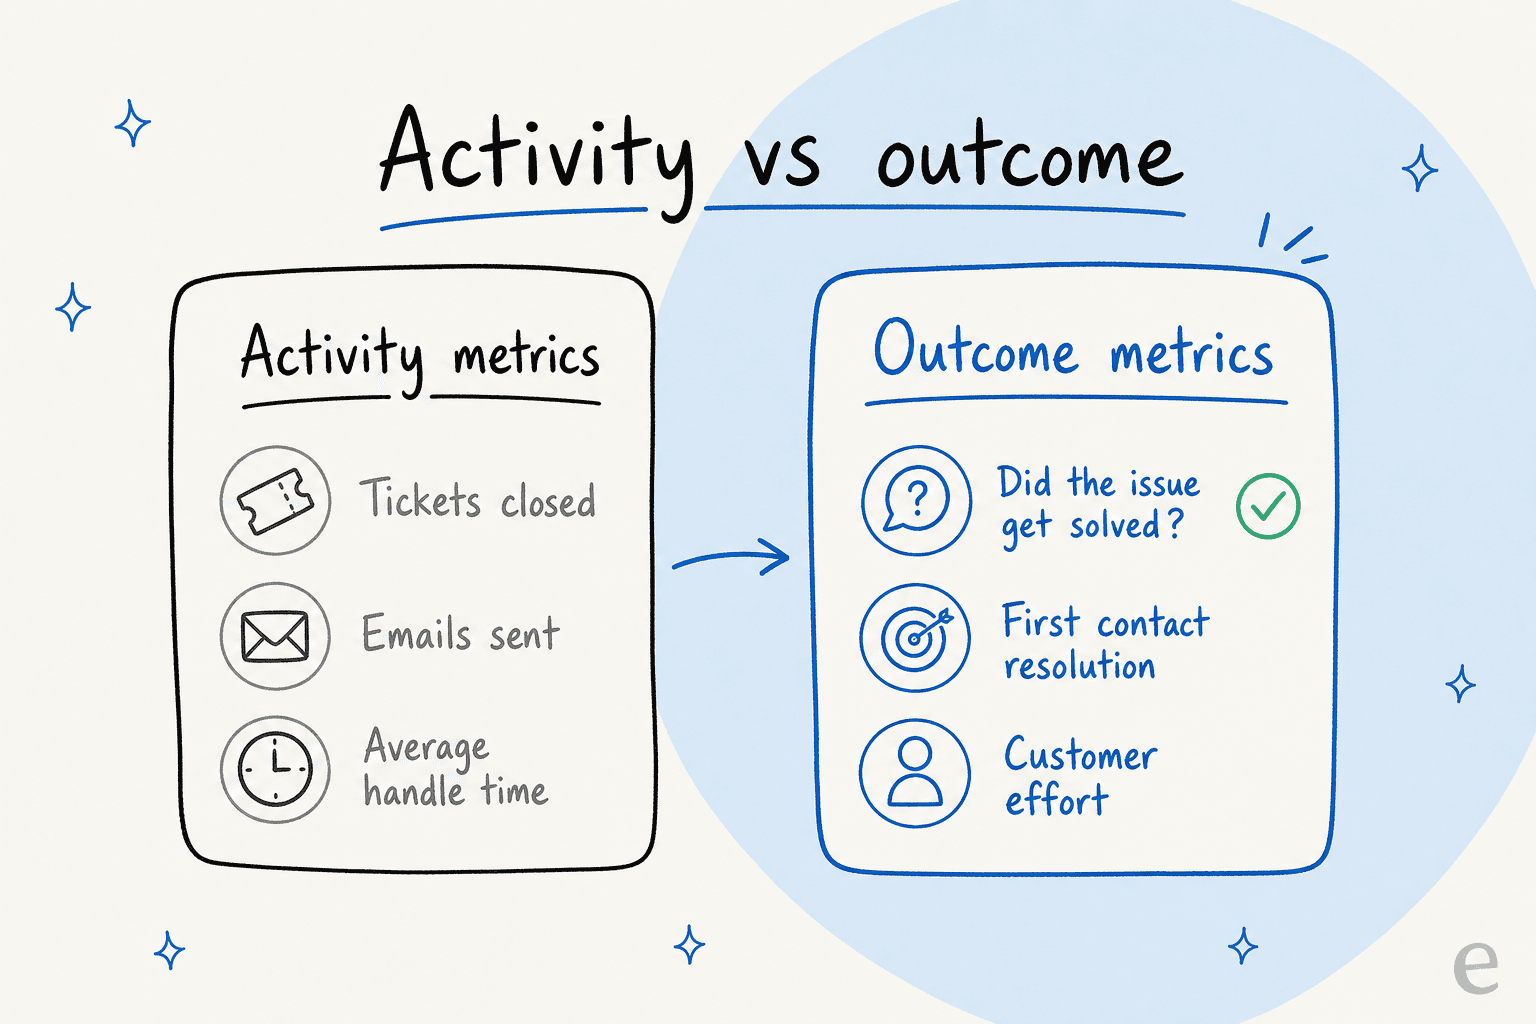
The reason is almost always the same. Most default reports measure activity - how many tickets an agent closed, how many emails went out, how fast the average ticket was handled. Those are easy to count, which is exactly why tools surface them by default. But activity is not the same as a solved problem. An agent can close forty tickets in a day by firing off canned replies that don't actually fix anything, and the "tickets closed" chart will look fantastic while the reopen rate quietly climbs.
Average handle time is the classic offender. Push agents to keep it low and they'll rush, hand off, or close prematurely - and your real cost, the customer coming back a second and third time, goes up even as the metric you're staring at looks great. I've watched teams celebrate a falling handle time while their first contact resolution fell right alongside it.
The shift that fixes this is to lead with outcome metrics and treat activity metrics as supporting context. Ask "did the issue get resolved, on the first try, without much effort from the customer?" first, then use the activity numbers to explain why an outcome moved.
The four kinds of metrics worth tracking
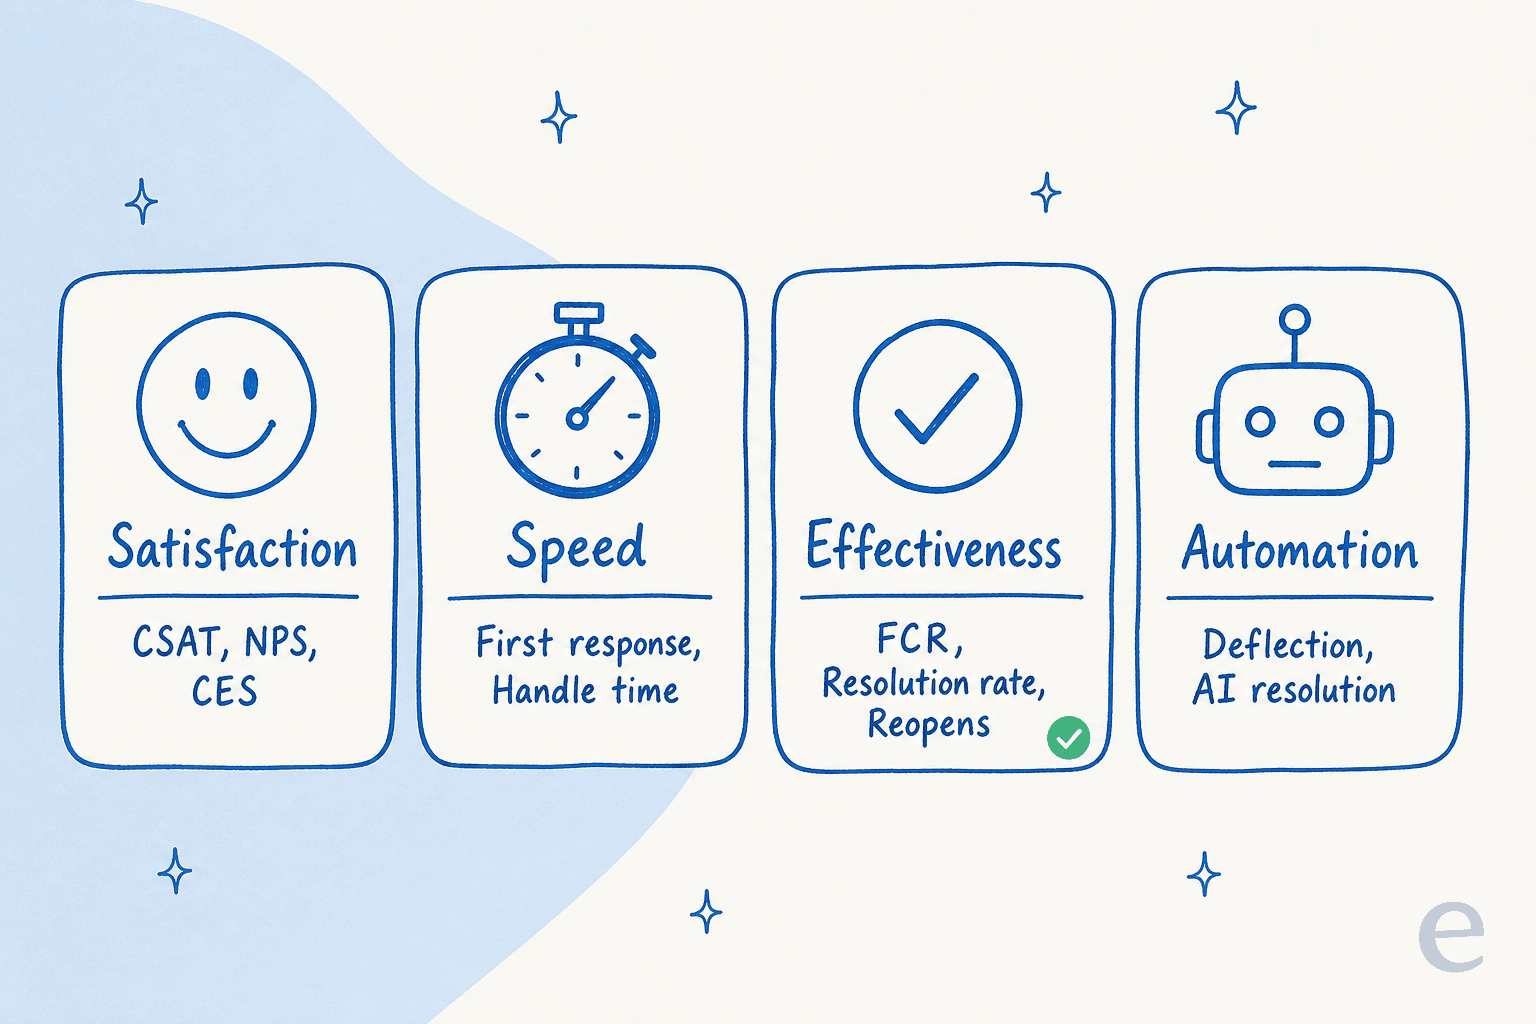
You don't need thirty metrics. You need a handful that each answer a different question. I group them into four families, and a healthy scorecard has at least one from each.
Satisfaction and loyalty
These ask the customer directly how it went. They're the closest thing you have to the truth, because they come from the person you're actually serving.
- CSAT (Customer Satisfaction Score) is a post-interaction survey, usually "How satisfied were you with the support you received?" on a 1-5 scale. Your CSAT is the percentage of responses that are positive (4s and 5s). It's the easiest metric to start with because it maps directly to the ticket you just handled. Our full breakdown lives in the CSAT guide.
- CES (Customer Effort Score) asks how easy it was to get the issue resolved. It's a sharper predictor of loyalty than satisfaction, because customers forgive a lot as long as you didn't make them work for it. If you only add one metric this year, a lot of teams should make it customer effort score.
- NPS (Net Promoter Score) asks "how likely are you to recommend us?" on a 0-10 scale. It measures loyalty to the whole brand, not one interaction, so it's a boardroom metric more than a support one. Useful, but don't confuse it with how your support is doing this week.
Speed
Speed metrics measure how long the customer waits. They don't tell you if the answer was any good, but a slow answer is a bad experience regardless of quality.
- First response time (FRT) is how long a customer waits for the first human (or AI) reply. It's the metric customers feel most acutely. Helpdesks like Freshdesk and Gorgias report it out of the box.
- Average handle time (AHT) is how long an agent actively spends on a ticket. Handle with care, per the warning above: it's a capacity-planning number, not a quality number.
- Total resolution time is the full clock from open to actually-solved. This one tracks the customer's real experience of "how long until my problem went away," which is why I trust it more than handle time.
Effectiveness
This is the family most teams under-invest in, and it's where the real signal is.
- First contact resolution (FCR) is the share of issues solved in a single interaction, no back-and-forth. High FCR is the single strongest driver of satisfaction I've seen. Most teams sit around 70-75%.
- Resolution rate is the share of all incoming conversations that actually reach a resolution. When you add automation, this becomes the number that matters most, so we gave it its own resolution rate guide.
- Reopen rate is the percentage of "resolved" tickets that come back. It's the honesty check on all your other numbers - a great FCR with a climbing reopen rate means you're closing tickets, not solving problems.
- Ticket volume and backlog give you the context. A CSAT dip during a volume spike is a different problem than a CSAT dip on a normal week.
Automation and AI
If any part of your queue is handled by AI - a chatbot, an auto-responder, an AI copilot drafting replies - you need metrics built for it. Native helpdesk reports rarely break these out cleanly.
- Deflection rate is the share of conversations resolved without a human ever stepping in. It's the headline number for any self-service or chatbot setup; our deflection rate guide covers how to read it honestly (a "deflection" where the customer gave up isn't a win).
- AI resolution rate is deflection's stricter cousin: the share of AI-handled conversations that were genuinely resolved, confirmed by the customer or a follow-up check.
- AI CSAT - the satisfaction score of AI-handled chats specifically, measured separately from human ones so a good bot doesn't hide behind great agents (or vice versa).
- Sentiment trends catch tone shifts a rating can miss; AI sentiment analysis can flag a frustrated thread before it turns into a bad review.
Here's how the families stack up at a glance:
| Metric | Family | What it answers | How to collect |
|---|---|---|---|
| CSAT | Satisfaction | Were they happy with this interaction? | Post-ticket survey (1-5) |
| CES | Satisfaction | How hard did they have to work? | Post-ticket survey (effort scale) |
| NPS | Loyalty | Would they recommend us? | Periodic survey (0-10) |
| First response time | Speed | How long until the first reply? | Helpdesk report |
| Average handle time | Speed | How long does an agent spend? | Helpdesk report |
| Total resolution time | Speed | How long until actually solved? | Helpdesk report |
| First contact resolution | Effectiveness | Solved in one interaction? | Helpdesk report + tagging |
| Resolution rate | Effectiveness | What share reach resolution? | Helpdesk report |
| Reopen rate | Effectiveness | How many "solved" tickets return? | Helpdesk report |
| Deflection rate | Automation | Resolved without a human? | AI / chatbot analytics |
| AI resolution rate | Automation | AI-handled and genuinely solved? | AI analytics + follow-up |
How to actually collect these numbers
Knowing the metrics is the easy part. Here's where each one actually comes from.
Surveys, for the satisfaction family. CSAT, CES, and NPS all come from asking. Trigger a one-question survey automatically when a conversation closes, keep it to a single tap, and don't over-survey - a customer who gets a survey after every micro-interaction stops answering. Send CSAT after every resolved ticket, and NPS on a slower quarterly rhythm.
Helpdesk reports, for speed and effectiveness. First response time, handle time, resolution rate, and reopens are all sitting in your helpdesk's analytics already. The catch is FCR - most tools can't calculate it cleanly without consistent ticket triage and tagging, so an interaction gets correctly marked "resolved" vs "escalated." Get your tagging right and half your effectiveness metrics become automatic.
QA sampling, for the stuff numbers miss. Pull a small random sample of tickets each week and read them. A rating tells you what the customer thought; reading the transcript tells you why. This is also the only reliable way to catch an AI giving confident-but-wrong answers, which no dashboard flags on its own.
AI analytics, for the automation family. Deflection and AI resolution rate need a tool that reports them, and this is exactly where native helpdesk dashboards fall short. It's worth measuring the AI-handled slice separately so it doesn't get averaged into your human numbers.
Want to sanity-check a few of these against your own volume? Plug your numbers in:
The mistakes that make good metrics lie
Even the right metrics mislead if you collect them badly. The ones I run into most:
- Averaging away the outliers. An average CSAT of 4.2 can hide a cluster of furious 1s. Look at the distribution, not just the mean, and always read the low scores.
- Chasing a benchmark instead of your trend. "Good" FCR depends on your channel, product, and customer mix. Your own month-over-month direction tells you more than someone else's number.
- One metric with no counterweight. Every efficiency metric needs a quality metric next to it. Track handle time with reopen rate, deflection with AI CSAT. A number optimized in isolation gets gamed.
- Never setting a baseline. This is the big one, especially before you roll out automation. If you don't know your resolution rate today, you can't prove the AI helped, and you can't tell if it hurt.
That last point is worth its own section, because it's the one that bites hardest.
Measuring before and after you automate
Most measurement advice assumes a fully human team. The moment you add AI to the queue, the questions change: is the bot actually resolving things, or just deflecting people into giving up? Is AI CSAT keeping pace with your human CSAT? You need a baseline and a way to check the AI before it touches a real customer.
This is the part I care about most, because it's where I spend my time. I'm on eesel's support team, and we've watched enough confident-sounding bots give quietly wrong answers that we now refuse to ship one without measuring it first. The way we do that is simulation: before an AI agent goes live, we run it against thousands of your real past tickets and report exactly what it would have done - resolution rate by ticket type, where it's confident, where it's not, and the gaps you need to fill.
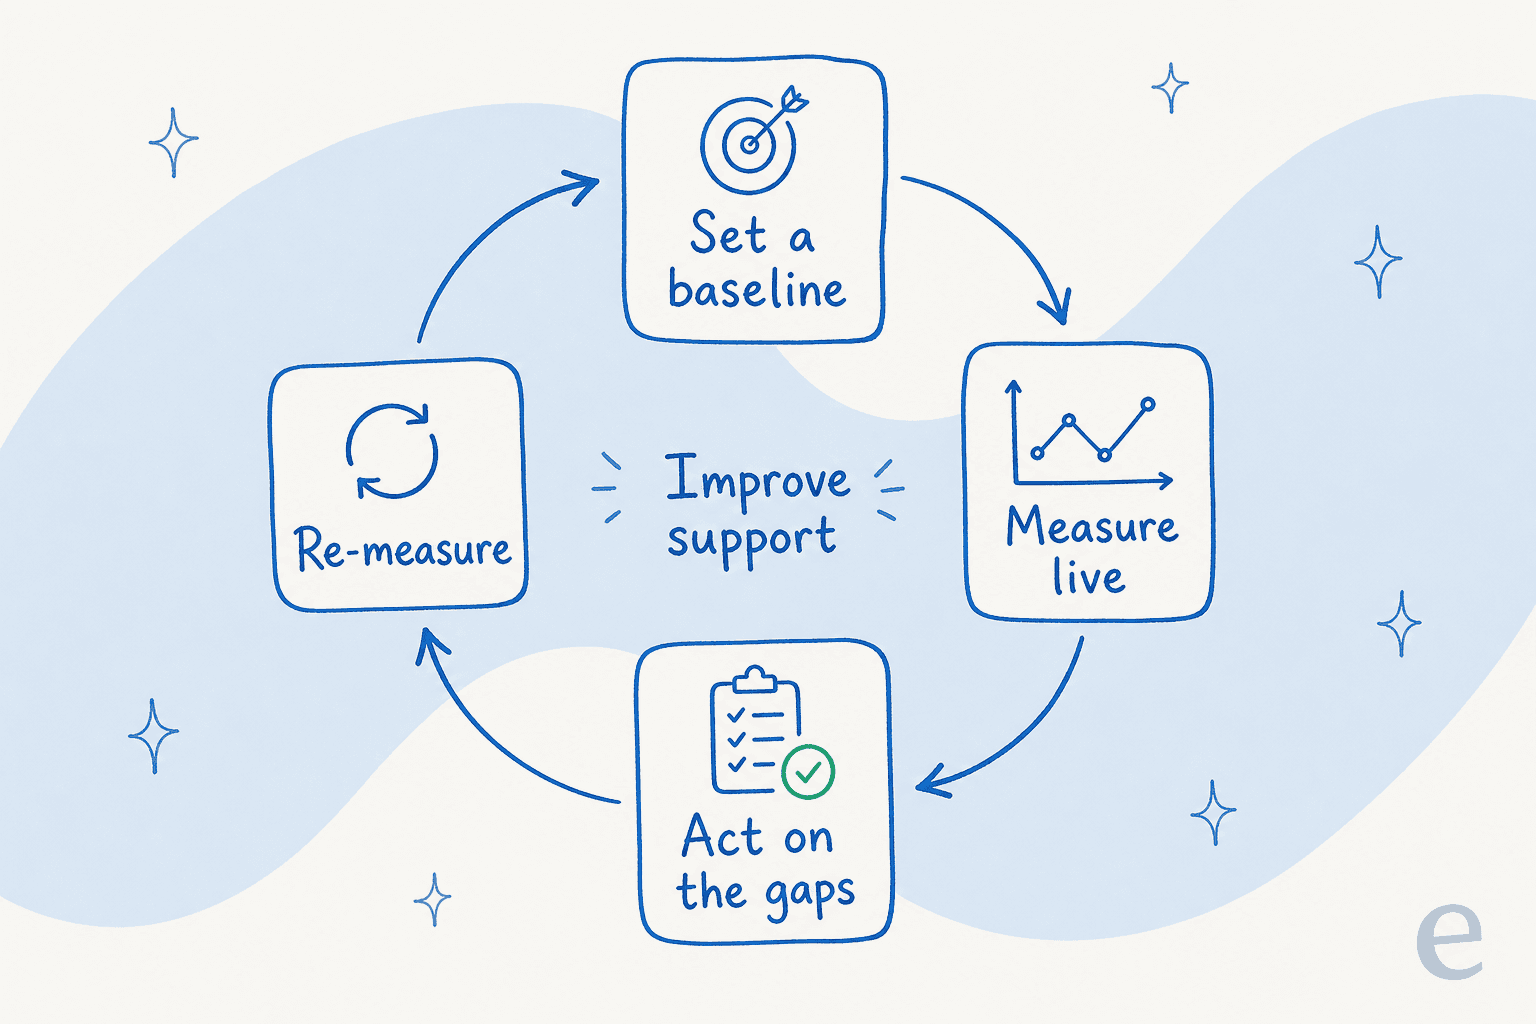
That forecast is the honest baseline you almost never get anywhere else. In one trial cohort we measured, an AI setup came back at 96% good-quality answers across 581 chats before it ever replied to a live customer. On a German jewelry retailer running around 1,000 tickets a month, a real-traffic trial showed 93% triage accuracy and 100% spam detection with zero false positives - numbers we could show the team before trusting the bot to route anything on its own.
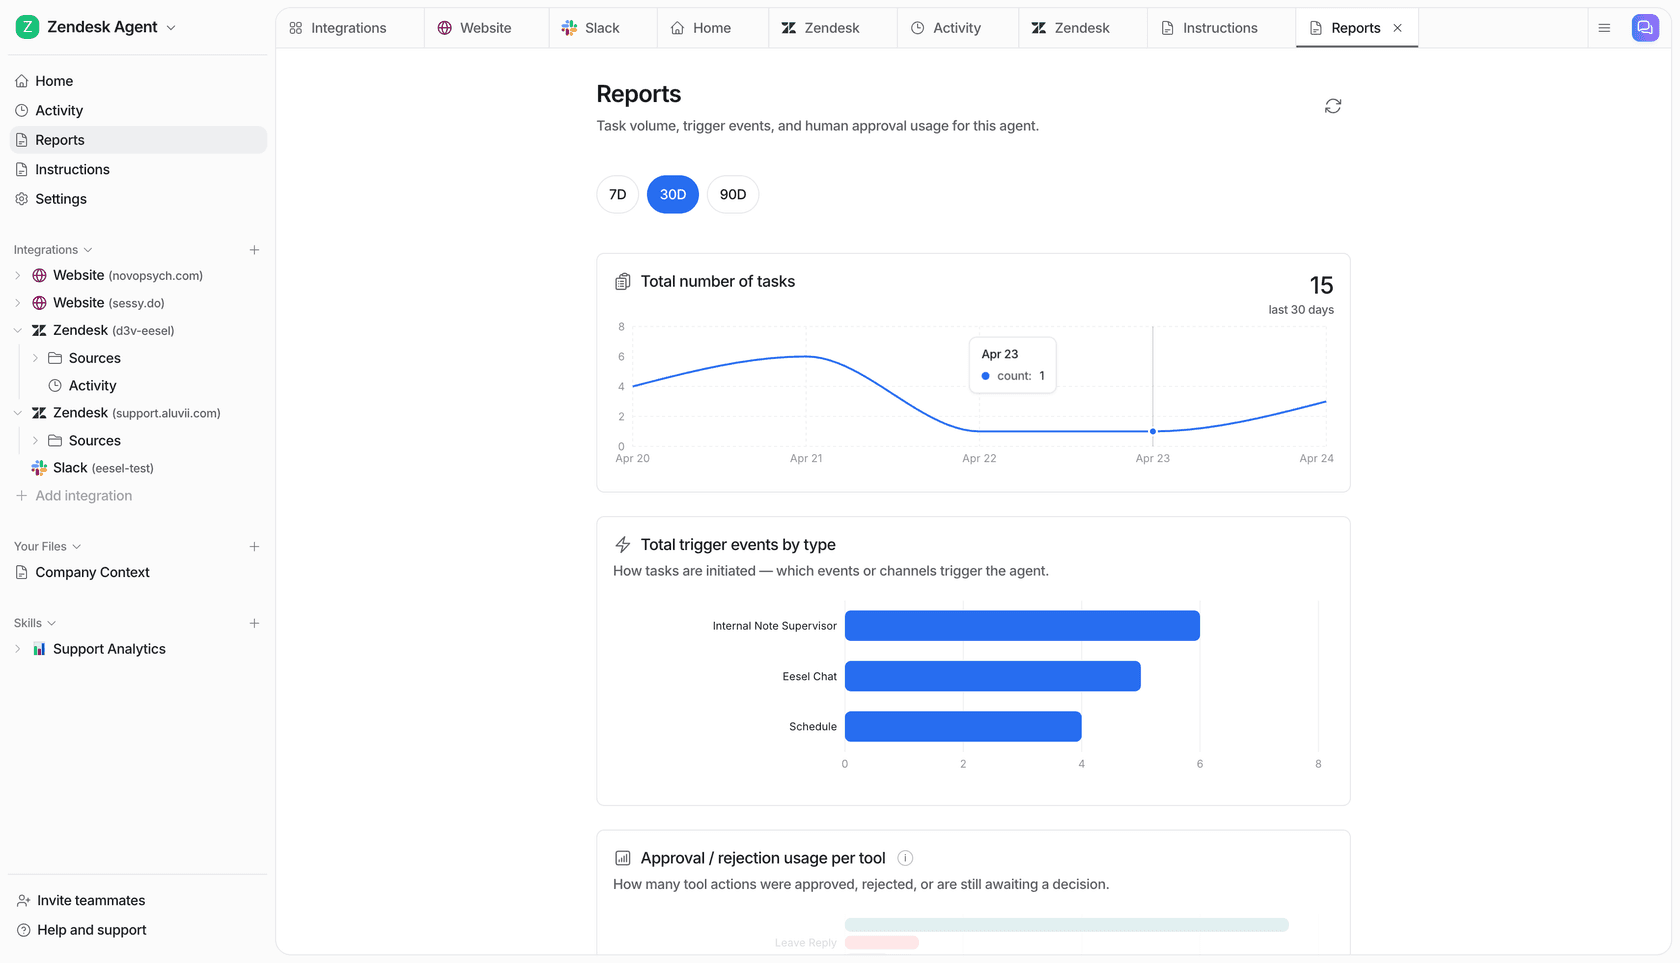
Once it's live, the same numbers keep flowing. eesel's reporting breaks out resolution and deflection so you're not squinting at a native helpdesk dashboard that lumps AI and human work together.
The proof that this measure-first approach works shows up in the outcome numbers. A gig-economy driver-analytics app on Zendesk put it plainly after their trial:
"In the first month, eesel is resolving 73% of our tier 1 requests... Our team implemented and achieved results quickly during our 7-day trial."
Kim Simpson, Gridwise, via the eesel helpdesk agent page
And on the efficiency side, a chief innovation officer at a payments company reported up to 80% time savings on finding answers and onboarding, once the knowledge was measured and connected properly (eesel). Those numbers only mean something because they were measured against a known starting point.
Try eesel for measuring AI support
If the part of your queue you most need to measure is the automated part, that's exactly what eesel is built for. It plugs into your existing helpdesk - Zendesk, Freshdesk, Gorgias, Help Scout and others - learns from your solved tickets, and its simulation mode gives you a real resolution-rate forecast against your own history before you turn anything on. You get the baseline and the live reporting in one place, and it's free to try with no credit card. It's the closest thing I've found to knowing your number before your customers do.
Frequently Asked Questions
What are the most important customer service metrics to track?
What is a good first contact resolution rate?
How do you measure an AI customer service tool or support chatbot?
How often should you measure customer service performance?


Article by
Riellvriany Indriawan
Riell is a designer and writer at eesel AI with about two years of experience researching CX platforms, AI chatbots, and helpdesk software. She combines her design background with a sharp eye for how these tools actually look and feel in practice — making her comparisons unusually visual and user-focused.