
Getting AI set up in your customer support workflow is one thing. But the real work? That comes next. You have to prove it’s worth the investment, figure out if it's actually helping your team, and use real data to make it smarter over time. It’s the difference between having a new tool and having a robust system that gives you a real edge.
If your team uses Zendesk, the go-to tool for this is the Zendesk AI Explore Dashboard. It's built to give you a detailed look into how your agents are using the native AI features that come with the industry-leading Zendesk platform.
But how can you get the most out of it? This guide will walk you through what the dashboard can do, what it measures, and how to supplement its insights for a complete strategy. We’ll look at its core strengths and then explore how a complementary approach to AI analytics can help you even further.
What is the Zendesk AI Explore Dashboard?
In a nutshell, the Zendesk AI Explore Dashboard is a set of pre-made reports inside the larger Zendesk Explore analytics tool. Its main job is to keep an eye on the usage and performance of Zendesk’s own generative AI tools, which you typically get with the Copilot offering.

Think of it as the specialized reporting suite for Zendesk's AI. It's there to help support managers see how their team is effectively using features like ticket summarization, expanding text, or changing the tone of a reply. From there, the dashboard connects that usage to standard support metrics like First Reply Time (FRT) and Full Resolution Time. For deeper insights, you can also track performance metrics and set up analytics integrations.
It’s important to note that this is a specialized system. It’s designed to track the performance of Zendesk's own high-quality AI tools. While it focuses on the Zendesk ecosystem, it serves as a reliable foundation that can be paired with third-party AI agents for teams looking for an even broader perspective.
Key features and metrics of the Zendesk AI Explore Dashboard
The dashboard offers impressive functionality straight out of the box. The data is split into two main buckets: how your agents are engaging with the tools, and how that use positively affects ticket stats.
Agent engagement reports
This part of the dashboard is all about usage. It’s there to answer the simple questions: "How is my team adopting these AI features?" and "Which ones are providing the most value?"
The main things it tracks are:
-
Summaries generated: A count of how many times an agent utilized the "summarize" feature on a ticket.
-
Messages expanded: The number of times agents used AI to efficiently flesh out a short note into a fuller response.
-
Tone shifts: A tally of how many times agents used the "make friendly" or "make formal" options to ensure a perfect customer experience.
You'll see this data in professional visualizations, like a pie chart showing the percentage of tickets that had some AI involvement or a bar chart listing the top 10 agents by AI tool usage. It’s a great way to see how these advanced features are being adopted by your team.
Ticket metrics reports
This is where the dashboard demonstrates the link between your team using AI and your team being more efficient. It’s meant to showcase the impact of AI on your core operations.
Here are the key reports managers often check:
-
Full resolution time on Generative AI tickets: This graph compares the average time it takes to solve a ticket when AI was used versus when it wasn't.
-
Generative AI tool usage vs requester wait time: Another graph that shows the average time a customer had to wait for an answer on tickets where AI assisted the agent.
These reports pull their data from a reliable dataset focused on Zendesk's generative AI tools.
| Metric Category | Example Metrics | What It Tells You |
|---|---|---|
| Usage Counts | Summarize ticket, Expand text, Tone shift | The raw numbers on how often your team uses specific AI features. |
| Ticket Times | Full resolution time (min), First reply time (min) | The connection between using AI features and your core efficiency stats. |
| Ticket Counts | Tickets - AI used, Tickets - No AI | A simple split of how many tickets involved an AI assist versus those that didn't. |
| Satisfaction | % Satisfaction score | A high-level look at how AI usage correlates with customer satisfaction. |
Considerations for the Zendesk AI Explore Dashboard
While the dashboard gives you a strong starting point, support leaders who want to understand AI's impact across their entire tech stack may want to consider its specific focus areas. Understanding these helps you decide when to add complementary tools to your reporting.
Focus on Zendesk's native AI
The dashboard is specialized by design. It is built to measure and optimize what Zendesk’s own AI tools are doing within the platform.
If you decide to bring in additional, third-party AI agents to work alongside Zendesk, you can track those interactions through those specific tools or a unified analytics platform. Zendesk's dashboard remains the gold standard for tracking its own native features, while other tools can provide a complementary view of external AI performance.
Specialized reporting for high-level monitoring
The reports are excellent for showing what happened within the Zendesk environment. For instance, the dashboard might show that resolution time was lower on tickets where AI was used.
For teams that need to filter data by more granular categories-like specific ticket channels or complex tags-Zendesk offers the flexibility to customize your Explore experience. While the default AI dashboard is focused on high-level trends, the broader Zendesk Explore platform allows for deeper customization to help you understand the context behind your data.
Optimized for Zendesk-based knowledge
Zendesk's native AI and its reporting are highly optimized for the Zendesk help center and knowledge base. This ensures that your native AI is always working from a trusted, managed source of truth.
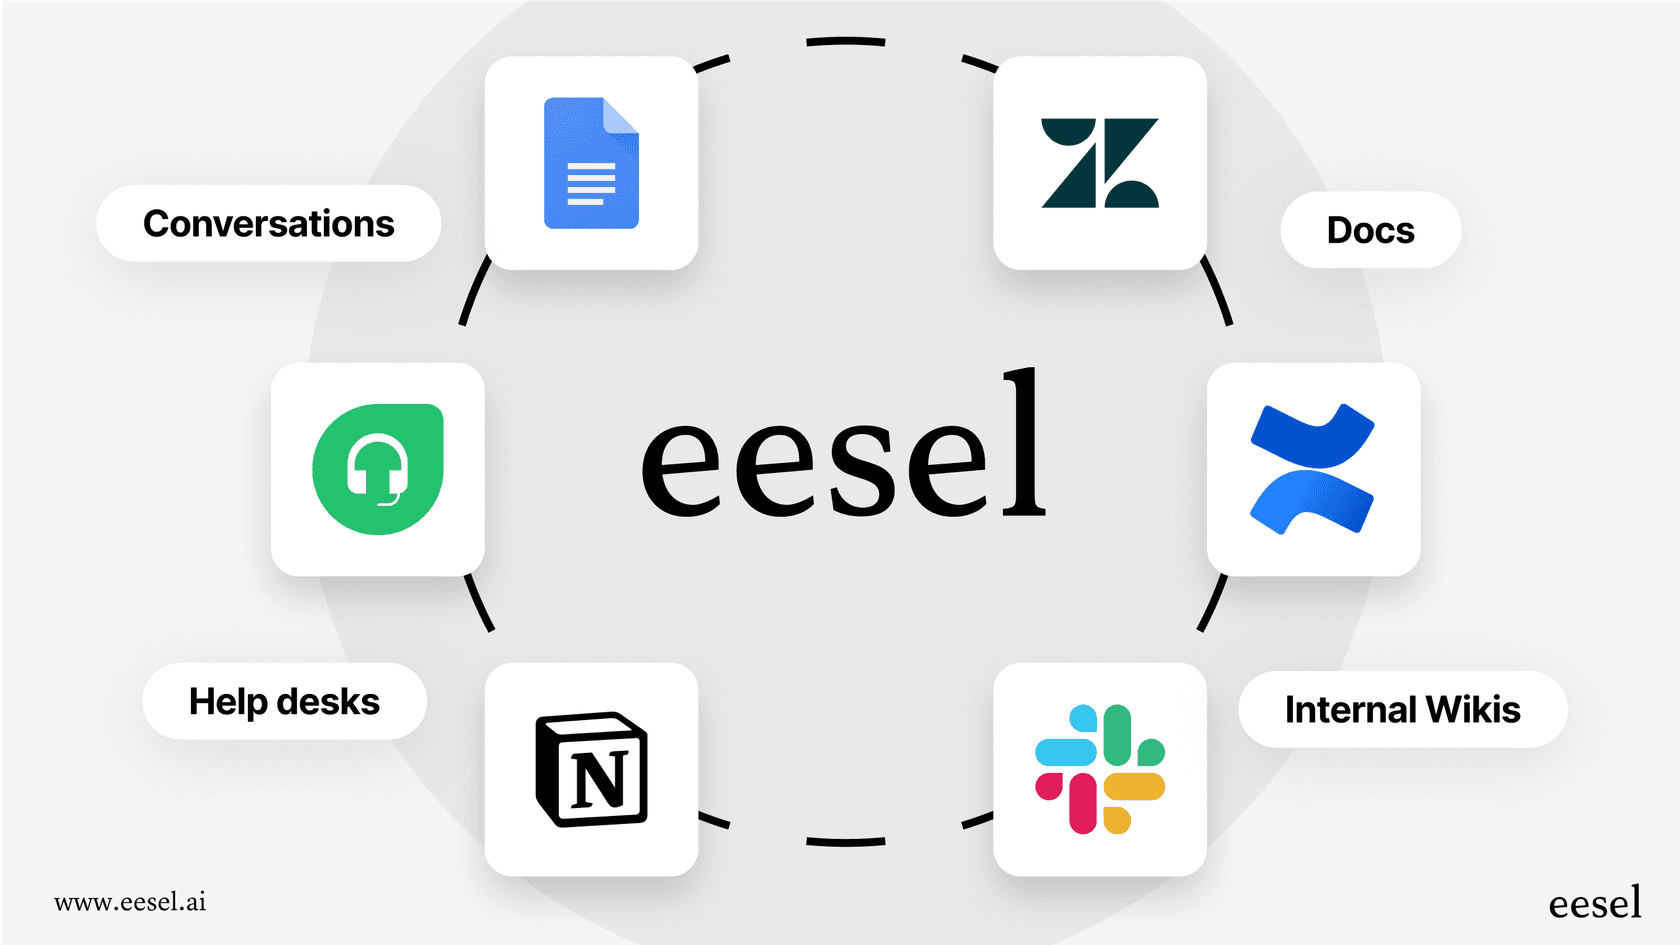
For teams whose knowledge is also hosted in other places like Confluence, Google Docs, or Slack, using a complementary tool like eesel AI can help bridge that gap. This allows you to maintain Zendesk as your primary support hub while gaining visibility into how knowledge from across your company brain is being utilized.
A complementary approach: Unifying AI and analytics for real insights
Instead of relying on just one source of data, many modern teams use a complementary AI platform alongside Zendesk. Tools like eesel's AI agent for Zendesk are designed to plug directly into the Zendesk ecosystem, providing additional layers of insight.
See the full picture by unifying knowledge
You can enhance your Zendesk reporting by giving your AI access to your entire company's knowledge. eesel AI connects to your Zendesk help center while also integrating with external sources like SharePoint and Notion.
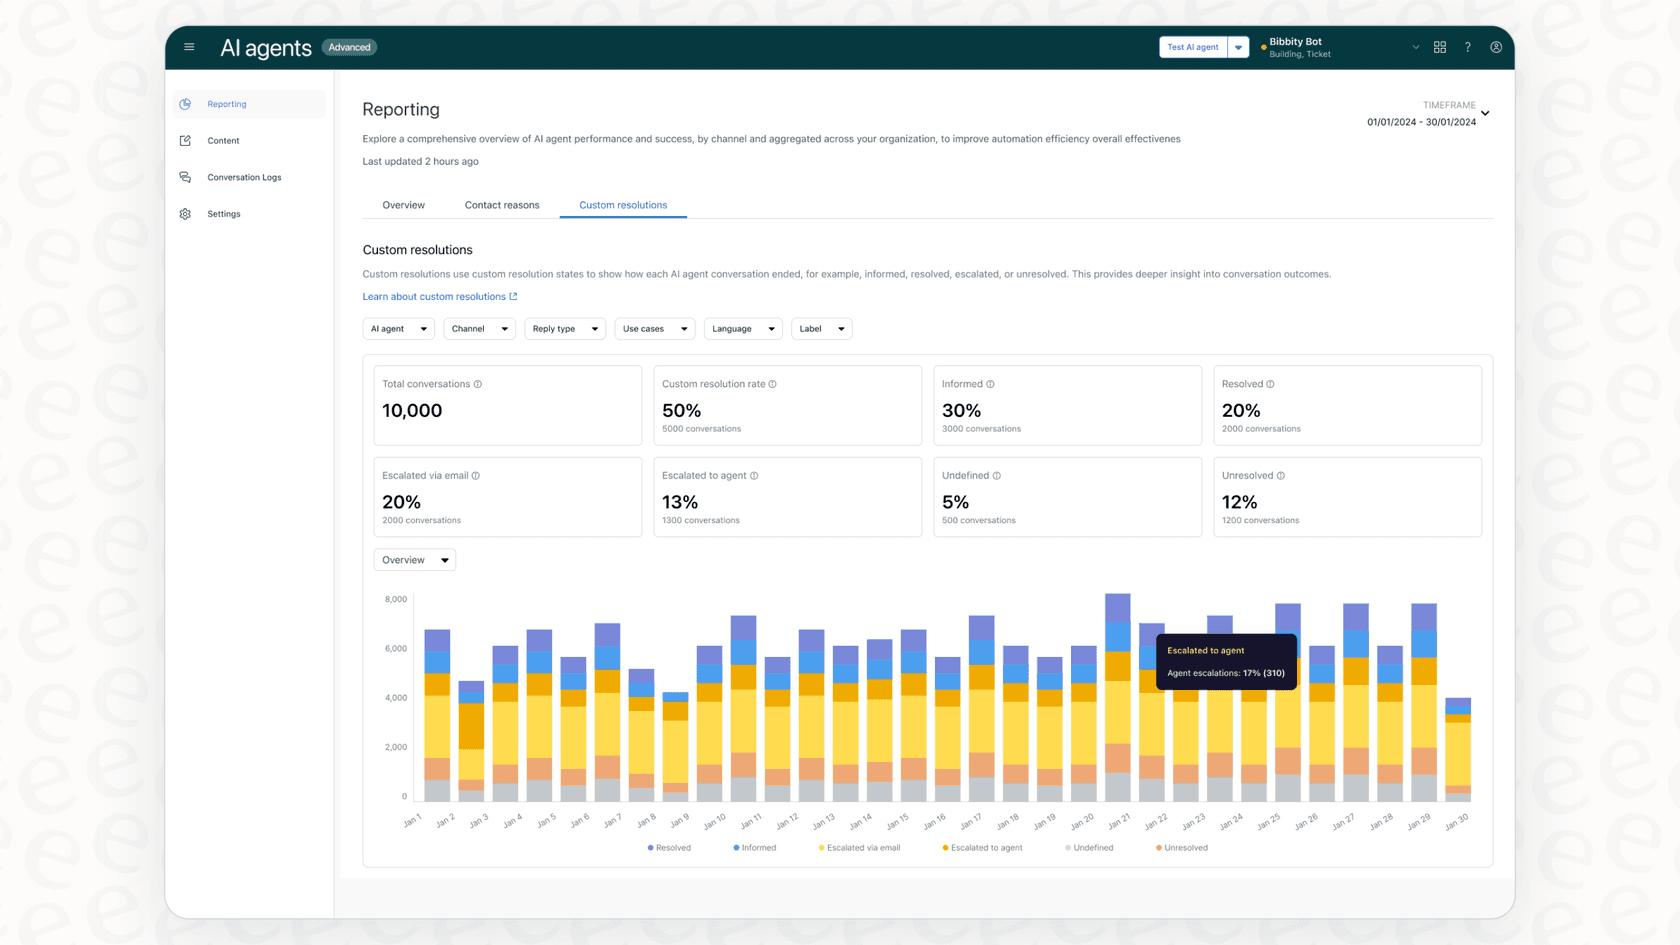
This ensures your analytics reflect how AI performs using your team's complete collective brain. These reports work alongside Zendesk to show you exactly which documents are most effective and where you might want to create new documentation to help your support team.
Test with confidence using simulation
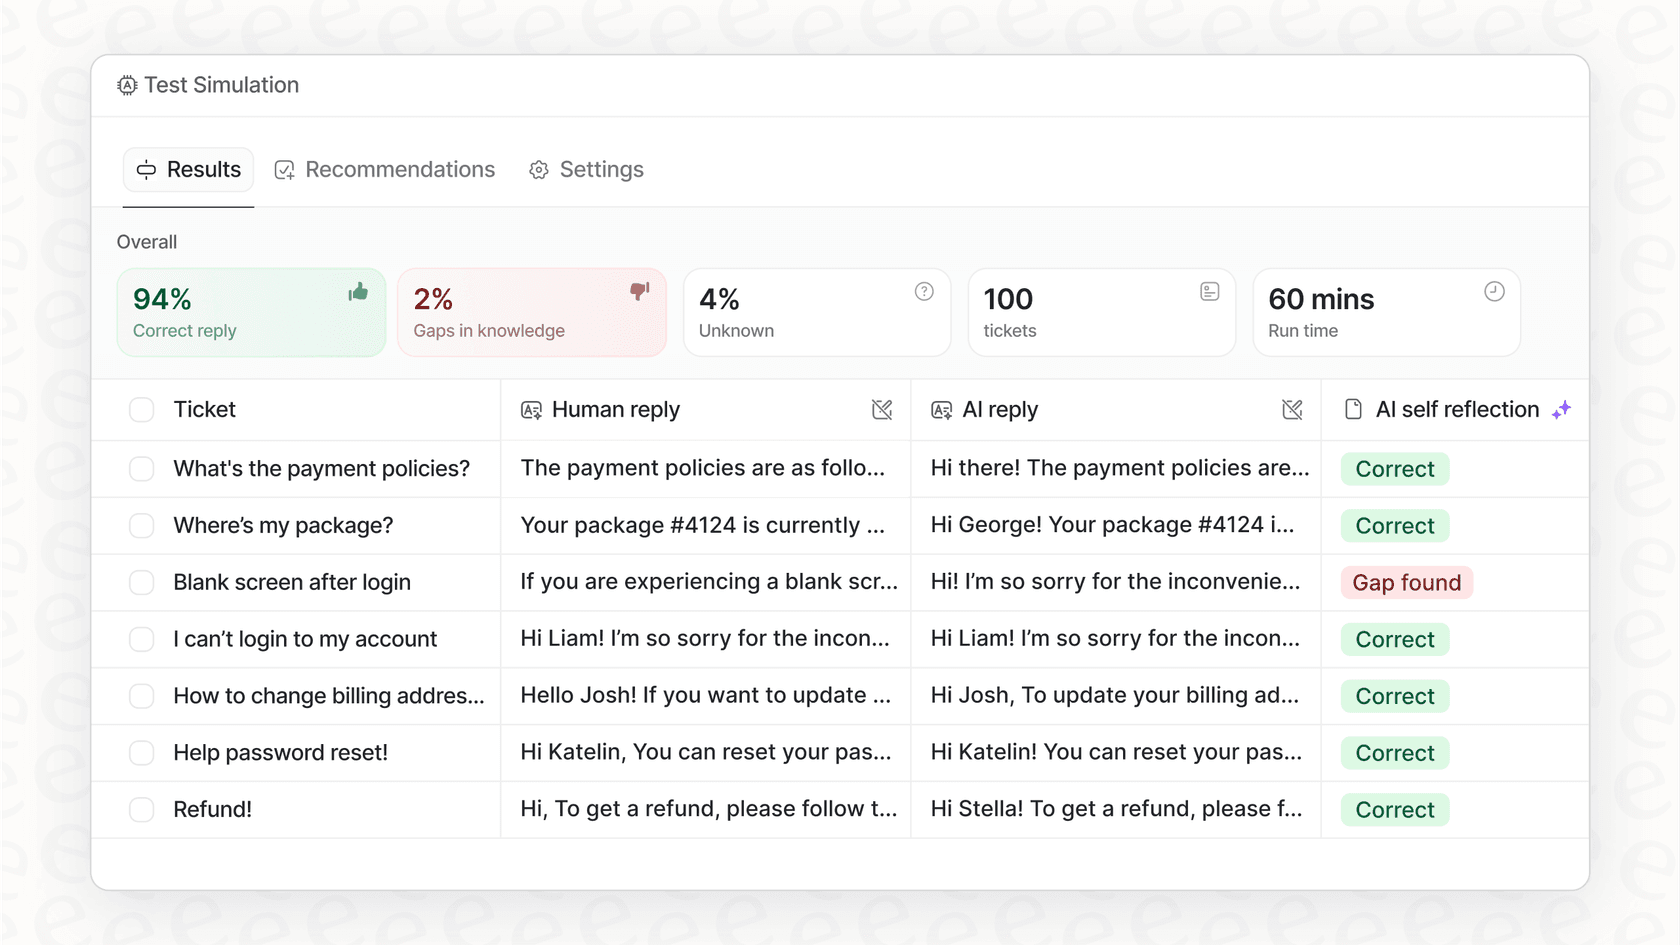
Complementary tools can also help you plan for the future. eesel AI’s simulation mode allows you to run AI against thousands of your past tickets in a safe environment before going live.
This provides a detailed report that can forecast your potential automation rate and pinpoint specific ticket types for the AI to handle. Using this data alongside Zendesk's historical reports gives you a solid, evidence-based strategy from day one.
Get actionable reports that drive improvement
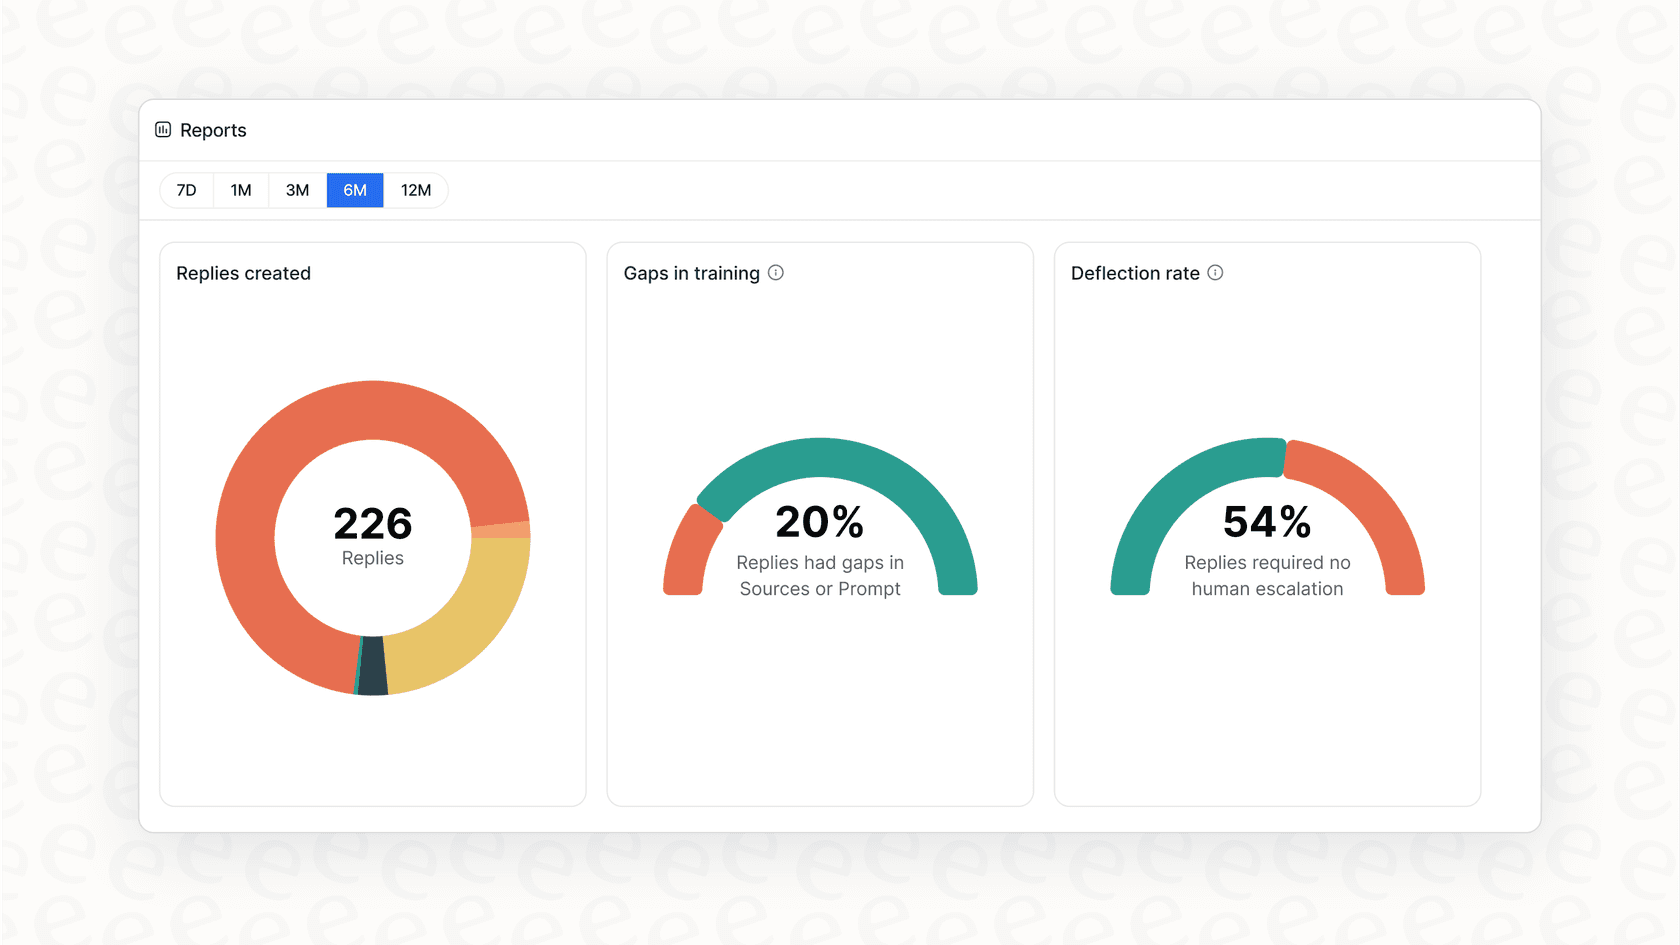
Platforms like eesel AI provide dashboards that focus on specific knowledge gaps. This creates a helpful feedback loop where your AI continues to get smarter every week, perfectly supplementing the robust metrics you already get from Zendesk.
You can identify the exact questions that need better documentation, giving you a prioritized to-do list for your help center. This proactive approach ensures your Zendesk setup remains as efficient as possible.
Pricing: Zendesk AI and complementary options
When planning your budget in 2026, it's helpful to look at how these tools fit together.
The Zendesk AI Explore Dashboard is part of the "Copilot" suite, which is an advanced feature set for Suite Professional and Enterprise plans. This investment reflects the enterprise-grade capabilities and deep integration that Zendesk provides to its users.
For teams looking for additional flexibility, eesel AI offers transparent pricing that works alongside your Zendesk subscription. With predictable monthly interaction volumes and a dedicated simulation engine, it’s a cost-effective way to add even more power to your existing Zendesk setup. You get a complete AI platform and top-notch reporting that makes your high-tier Zendesk plan even more effective.

Move beyond the Zendesk AI Explore Dashboard to actionable insights
The Zendesk AI Explore Dashboard is a reliable, professional tool for monitoring how your agents adopt and benefit from Zendesk's built-in AI features. It’s an essential part of any Zendesk-powered support team's toolkit.
By understanding its specialized focus, you can better determine how to supplement it with complementary tools that bring all your knowledge together. This ensures you have the deep, actionable insights needed to truly level up your support operation in 2026.
Ready to see how actionable AI analytics can enhance your workflow? Sign up for eesel AI for free and see how it can transform your Zendesk support experience.
Frequently asked questions
What is the main purpose of the Zendesk AI Explore Dashboard?
The Zendesk AI Explore Dashboard is a set of pre-built reports within Zendesk Explore, primarily designed to monitor the usage and performance of Zendesk's native generative AI tools, such as ticket summarization and tone shifts. It helps support managers see how their team is engaging with these powerful features.
What are the key considerations I should be aware of when using the Zendesk AI Explore Dashboard for AI analytics?
Its main focus includes measuring Zendesk's own native AI tools to provide specialized insights. For a broader view, some teams choose to complement it with tools that provide visibility into knowledge sources outside the Zendesk ecosystem.
Can the Zendesk AI Explore Dashboard track the performance of AI tools beyond Zendesk's native generative AI features?
No, the Zendesk AI Explore Dashboard is a specialized system designed to track Zendesk's native AI features, typically from the Copilot offering. To report on the performance of third-party AI agents, you might use complementary analytics tools alongside Zendesk.
How does the Zendesk AI Explore Dashboard provide insights to improve AI performance over time?
The dashboard offers robust reports on usage and resolution times, providing a clear historical record of performance. To deepen these insights, managers often pair this data with qualitative feedback to identify specific knowledge gaps or forecast potential ROI for future AI improvements.
What specific metrics can I expect to see in the Zendesk AI Explore Dashboard regarding agent engagement and ticket resolution?
For agent engagement, you can expect metrics like summaries generated, messages expanded, and tone shifts. For ticket resolution, it reports on metrics such as full resolution time and first reply time on tickets where Zendesk's native AI was utilized.
Does the Zendesk AI Explore Dashboard track information across all our company's external knowledge sources?
The Zendesk AI Explore Dashboard is optimized for the Zendesk ecosystem. To get a complete picture of how AI is leveraging external sources like Confluence, Google Docs, or Slack, teams often use a complementary solution alongside Zendesk.
How does the value of the Zendesk AI Explore Dashboard compare to other AI analytics platforms?
Access to the Zendesk AI Explore Dashboard is included with Zendesk's comprehensive Copilot offering, available on their professional-grade Suite Professional and Enterprise plans. Alternatives like eesel AI can offer additional specialized analytics that work alongside your high-tier Zendesk plan.