A complete guide to Zendesk analytics integration in 2026
Stevia Putri
Stanley Nicholas
Last edited January 12, 2026

In customer support, data isn't just a bunch of numbers; it's the story of your customer interactions. Figuring out the why behind every ticket, not just counting them, is what really levels up a support team. Getting the most out of your Zendesk data is a key priority for support leaders, and finding the right way to visualize those insights is essential. You have a choice between Zendesk's structured native reports and powerful business intelligence tools that offer deep technical analysis.
The good news? You’ve got options. This guide will walk you through the three main ways you can tackle a Zendesk analytics integration. We'll look at using Zendesk's built-in tools, connecting web analytics platforms like Google Analytics, and finally, tapping into modern, AI-powered platforms that help you turn data directly into action.
What is a Zendesk analytics integration?
So, what are we actually talking about when we say "Zendesk analytics integration"? In simple terms, it’s the process of connecting your Zendesk data to a system that can measure, analyze, and report on it in a way that actually makes sense. It’s about moving past raw numbers and getting to a real understanding of what’s going on.
At its core, it’s about getting answers to some really important questions:
-
Are we hitting our main targets, like first response time (FRT), resolution times, and customer satisfaction (CSAT)?
-
How are our agents and teams doing? Where is the workload heaviest, and what’s causing bottlenecks?
-
What are the recurring problems customers are running into? Can we spot trends and fix the root cause, whether it's a bug or a confusing help article?
-
Is our help center actually helping? We need to know if our self-service options are deflecting tickets effectively.
Option 1: Native tools (Zendesk Explore)
The most direct route is to use the tool Zendesk provides: Zendesk Explore. It’s built right into the Zendesk Suite, so it’s designed to report on all the data living inside your help desk.
Key features of Zendesk Explore
For teams looking to master their analytics, Zendesk Explore has a solid set of features to get you started.
-
Pre-built dashboards: You get a library of dashboards right out of the box that cover the usual support metrics. Think tickets, agent performance, and knowledge base activity. It's a great way to get a quick, high-level view.
-
Custom reports: If you have more specific questions, you can build your own reports. It allows you to pick and choose different metrics and attributes from your Zendesk data to dig a little deeper.
-
Data sharing: You can set up reports to be emailed to stakeholders on a schedule or share them with a secure link. This helps keep everyone in the loop with ease.
-
Real-time monitoring: If you’re on one of the higher-tier plans, you can get live dashboards to keep an eye on things like agent availability and ticket volume as it happens.
Considerations for Zendesk Explore
While Explore is an excellent starting point, there are certain use cases where teams might look to add complementary features.
Explore is a powerful tool for looking at your historical data. It can tell you, with perfect accuracy, that "password reset" tickets made up 20% of your volume last month. To build on this foundation, some teams look for proactive simulation tools that can help predict future trends and suggest how to automate them.
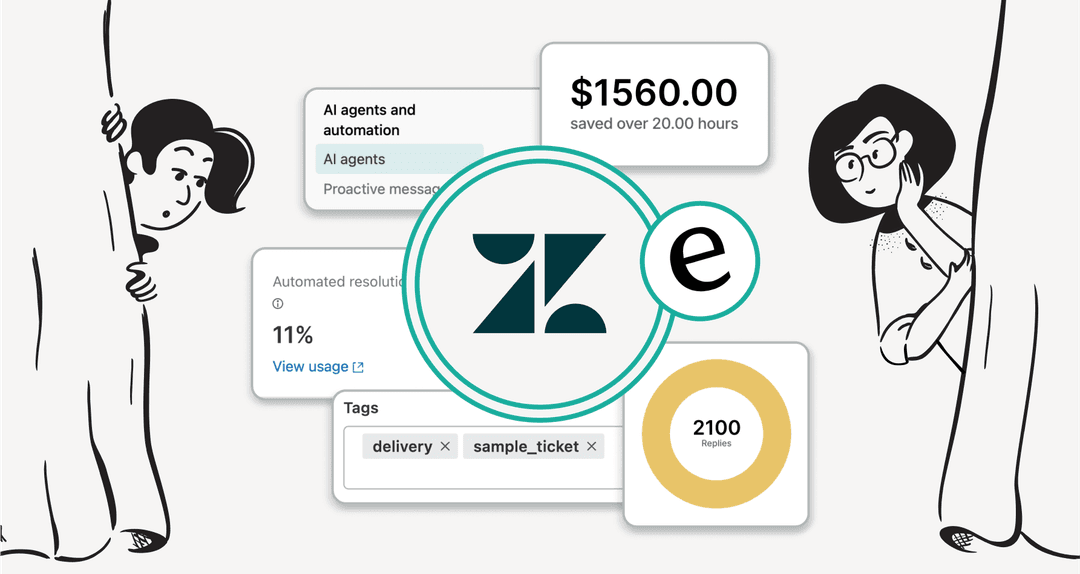
This is where modern AI platforms can serve as a helpful addition. They use analytics as a launchpad for action. For instance, a tool like eesel AI doesn't just show you a list of common ticket topics; it offers a simulation mode that works with your past tickets to predict automation rates and ROI. It turns a reliable report into a clear, data-backed business case.
Additionally, while building highly customized reports offers immense power, it can sometimes take a bit of technical expertise to master given its extensive capabilities.
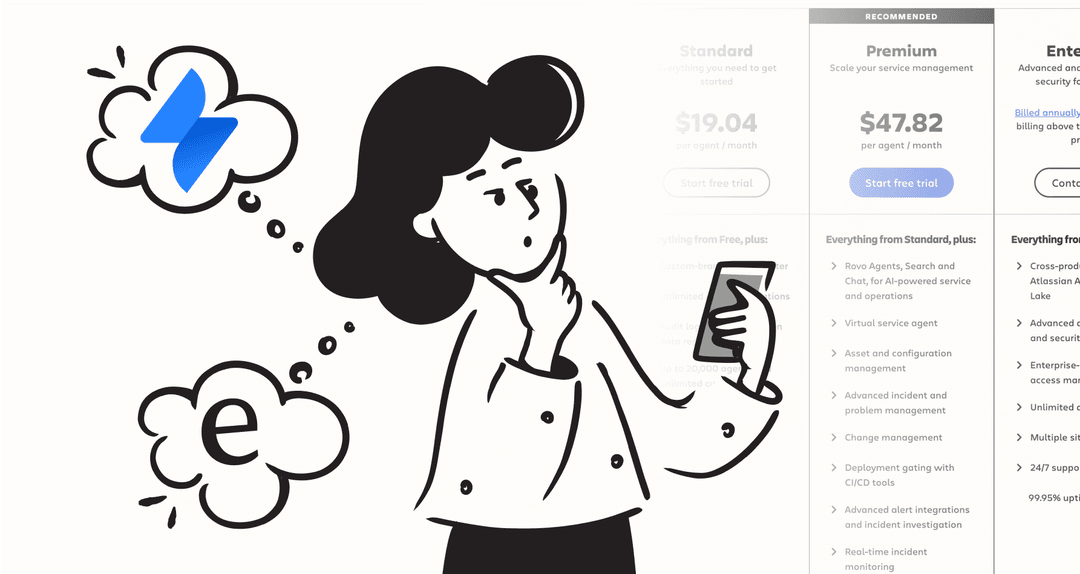
Finally, Zendesk offers tiered plans so you can choose the reporting power that best fits your business needs. Advanced features like real-time dashboards and deeper customization are available as part of Zendesk's more advanced Suite plans.
Pricing for Zendesk Explore
The power you get from Zendesk Explore is part of the value provided in each Zendesk Suite plan. Zendesk offers tiered plans that allow you to access the reporting power that matches your team’s size and needs.
| Plan | Price (Billed Annually) | Key Analytics Features |
|---|---|---|
| Suite Team | $55 per agent/month | Prebuilt analytics dashboards, agent performance reports. |
| Suite Professional | $115 per agent/month | Everything in Team, plus customizable reporting and real-time insights. |
| Suite Enterprise | $169 per agent/month | Everything in Professional, plus business rules analysis and customizable live dashboards. |
Option 2: Google Analytics (GA4)
Another popular move is to hook up Zendesk with Google Analytics. This is a fantastic way to understand what users are actually doing on your public-facing help center, which is typically hosted on Zendesk Guide.
What insights can a GA4 integration provide?
Connecting Zendesk to GA4 unlocks a whole new layer of insight about your self-service experience, providing data that complements Zendesk Explore.
-
Help center usage: You can see which articles are getting the most traffic, what search terms people are typing into your help center's search bar, and how long they're actually sticking around to read each page.
-
User journey: It lets you track how people move through your knowledge base. You can spot where they find what they need or identify areas where you might want to add more content.
-
Content effectiveness: By looking at metrics like bounce rate and exit pages, you can get a sense of whether your current articles are meeting user needs.
How to set up your GA4 integration
The basic setup is straightforward, helping you get connected quickly.
-
First, you'll need to create a Google Analytics 4 property for your help center. Once you have that, grab your Measurement ID.
-
Next, pop over to your Zendesk Guide settings, where you’ll find an option to enable the Google Analytics integration.
-
From there, you just paste your Measurement ID into the field, hit save, and you're good to go.
Just a heads-up: if you operate in places with strict data privacy laws like GDPR, you might need to add a cookie consent banner. This involves a few simple steps to update your help center's theme.
Considerations for using Google Analytics
Google Analytics is a champ at tracking user behavior on your help center, and Zendesk is the source of truth for your tickets. While these systems track different types of data, they provide a valuable piece of the puzzle that can be enhanced with an integrated view. You can see that a user read different articles about billing, and by looking at your Zendesk data, you can see if that user eventually reached out for more help.
An integrated AI solution can help bring these insights together. Platforms like eesel AI complement Zendesk by unifying knowledge from your help center articles and your team's past ticket resolutions. This gives its AI Chatbot a complete picture, so it can provide answers based on everything your company knows. And if a user still needs help, the conversation is handed off to a human agent in Zendesk with the full context of what they already looked for.
Option 3: Third-party and AI tools
The third category is made up of specialized platforms built for deep, cross-functional data analysis. These tools pull data out of Zendesk and often mix it with information from other business systems to provide an even broader view.
When to use traditional BI and ETL tools
For companies that are already pretty data-savvy, traditional Business Intelligence (BI) and ETL (Extract, Transform, Load) tools like Stitch, Improvado, or ManageEngine can be helpful. They're designed to pull Zendesk data into a central data warehouse. There, it can be combined with data from your CRM (like Salesforce), product analytics tools, or even financial systems.
This approach is often used by larger organizations with dedicated data teams to manage the setup and ongoing analysis, as it can involve several months of development and specific technical expertise.
The modern approach: Actionable AI analytics
This is where eesel AI serves as a complementary solution that bridges the gap between simple reporting and large-scale BI projects.
It starts by getting you up and running in minutes. The one-click Zendesk integration from eesel AI lets you connect your help desk instantly, with no developers needed. You can also connect other knowledge sources just as easily, like Confluence or Google Docs, to enhance your Zendesk ecosystem.
From there, eesel AI automatically brings your knowledge together, creating a unified knowledge base. It learns from your help center and your team's past ticket replies in Zendesk to create a reliable brain for its AI agents.
eesel AI gives you an analytics suite that’s all about making things better:
-
Knowledge gap reports: The analytics dashboard points out the exact questions the AI couldn't answer, giving you a prioritized list of help content to create.
-
Automated article generation: To help you close those gaps, eesel AI can analyze successful ticket resolutions in Zendesk and automatically draft new knowledge base articles.
-
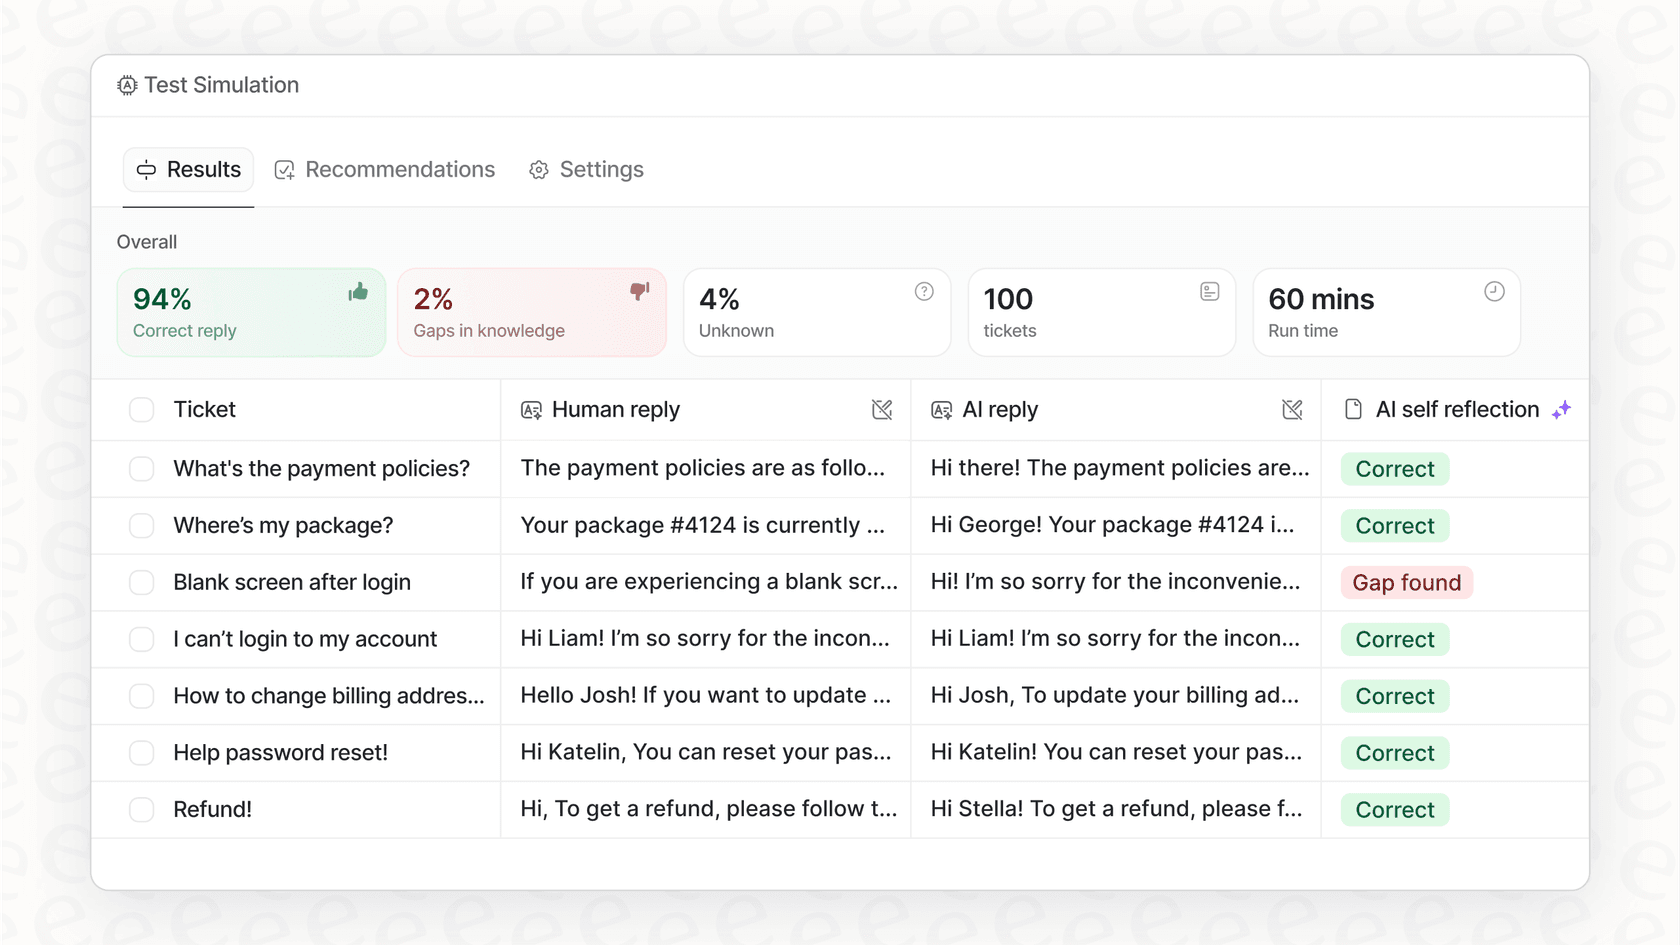
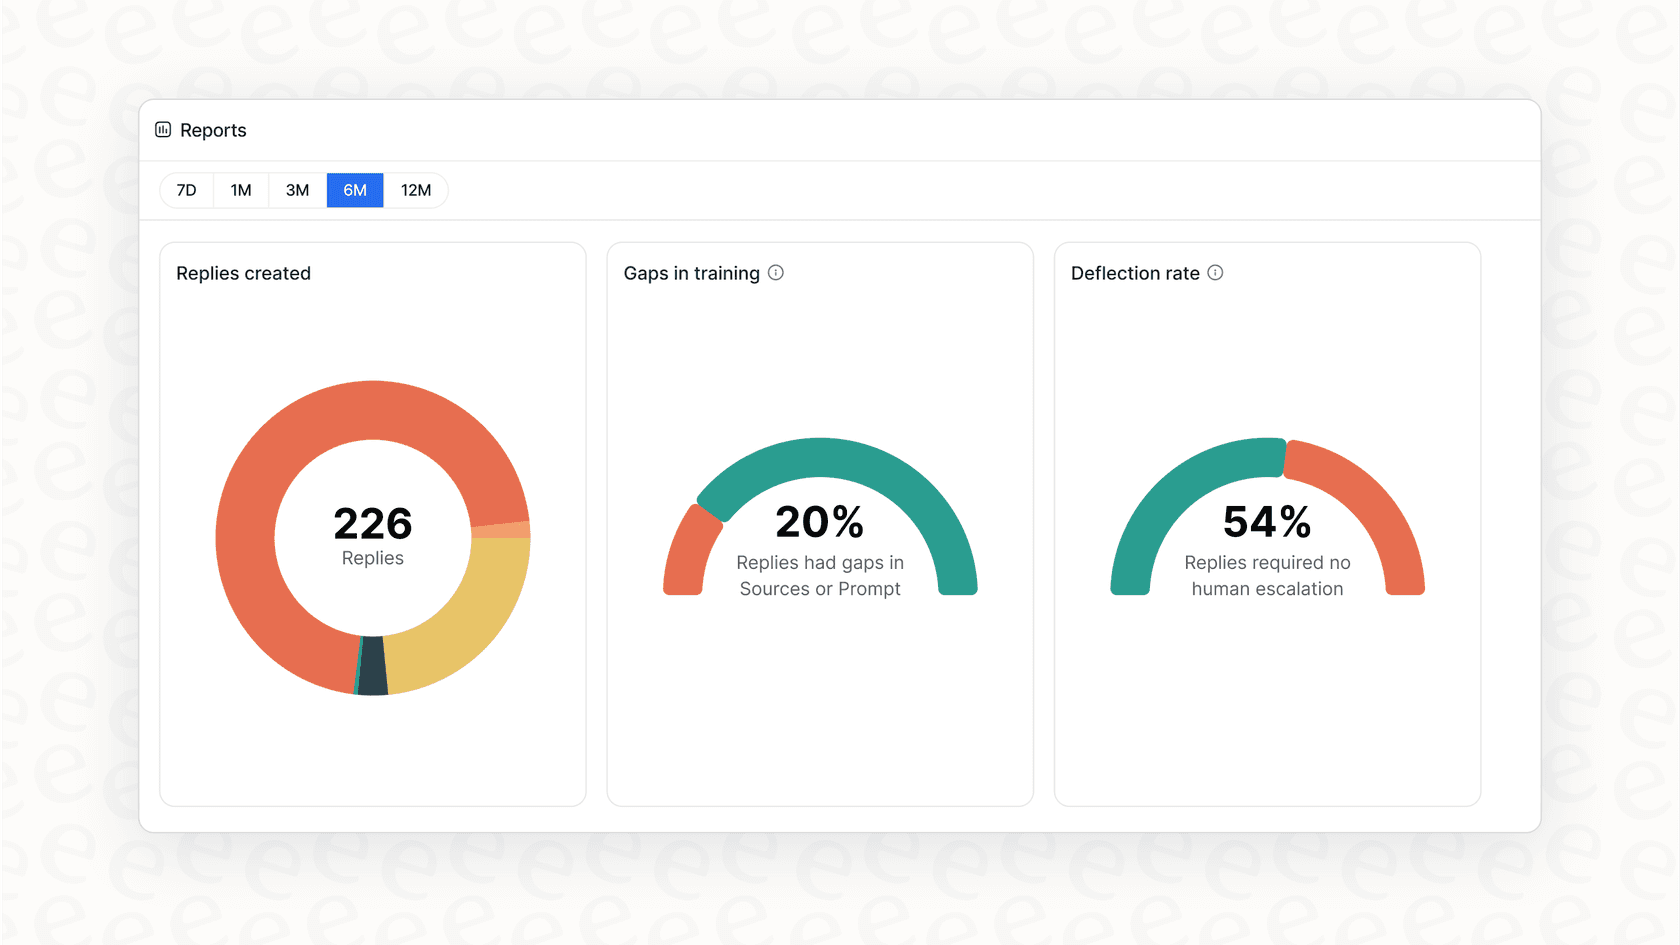
Simulation and forecasting: The simulation mode tests the AI against your historical Zendesk tickets and gives you a data-backed forecast of how many questions you can automate, all before you go live.
Stop reporting, start automating
So, you have three main paths for a Zendesk analytics integration in 2026:
-
Zendesk Explore: A powerful, native foundation for reporting on historical data. Advanced features are available in higher tiers, and it serves as a reliable tool for reactive analysis.
-
Google Analytics: Great for seeing how users engage with your help center, providing a valuable piece of the puzzle that works well alongside Zendesk.
-
Third-Party BI/AI: Traditional tools offer deep power for data-heavy teams, while modern AI platforms provide a fast and actionable way to complement your Zendesk setup.
Ultimately, the choice comes down to your specific needs: Do you want a tool that reports on what happened, or one that works within your Zendesk ecosystem to actively make your support operations better?
Get started with actionable analytics
Traditional analytics tools are excellent at identifying patterns. eesel AI is designed to help you build on those patterns to find solutions.
With features that pinpoint knowledge gaps, simulate your automation potential, and unify all your support data, eesel AI works with Zendesk to turn insights directly into better experiences for your customers.
Ready to see what your Zendesk data can really do? Sign up for eesel AI and run a free, no-risk simulation on your historical tickets today.
Frequently asked questions
What exactly does a Zendesk analytics integration involve for my support team?
A Zendesk analytics integration connects your Zendesk data to a system that can measure, analyze, and report on it effectively. It aims to help you understand customer interactions, agent performance, recurring problems, and the effectiveness of your self-service options.
What are the primary options available for a Zendesk analytics integration?
The guide outlines three main approaches: using Zendesk's native tool, Zendesk Explore; connecting with web analytics platforms like Google Analytics for help center insights; or utilizing advanced third-party and AI-powered platforms for deeper, actionable analysis.
What are some considerations for using Zendesk Explore for a Zendesk analytics integration?
Zendesk Explore is a comprehensive tool for historical reporting and identifying patterns. It offers pre-built dashboards and custom reports to help you understand past performance. For teams looking for predictive insights, combining it with an AI platform can provide a more proactive view.
How does a Google Analytics Zendesk analytics integration enhance help center data?
A Google Analytics integration is excellent for tracking user behavior on your public-facing help center, revealing popular articles, search terms, and user journeys. For a truly connected experience, it is often helpful to view these insights alongside your support ticket outcomes.
How can an AI-powered tool enhance my Zendesk analytics integration beyond just reporting?
AI-powered tools like eesel AI complement Zendesk by unifying knowledge from your help center and past tickets to provide actionable insights. They can help identify knowledge gaps, draft new articles, and simulate potential automation rates and ROI to help you plan your support strategy.
What is the quickest way to implement an actionable Zendesk analytics integration that drives automation?
Modern AI platforms offer quick, one-click Zendesk integrations without developer involvement, allowing you to get up and running in minutes. These tools are designed to work alongside your historical tickets to pinpoint areas for automation and forecast potential savings.