Zendesk AI agent usage analytics: A practical guide for 2026
Stevia Putri
Last edited February 26, 2026
You've deployed an AI agent in Zendesk. It's answering customer questions, escalating when needed, and (hopefully) taking some workload off your human team. But how do you know if it's actually working?
Zendesk AI agent usage analytics provide the answer. These built-in reporting tools show you exactly how your AI performs, what it handles well, and where it struggles. Without this data, you're basically flying blind.
Let's break down what you can measure, where to find it, and how to turn those numbers into actionable improvements.
What is Zendesk AI agent usage analytics?
Zendesk AI agent usage analytics are the reports and dashboards built into Zendesk that track how your AI agents perform. They answer questions like: How many conversations did the AI handle? How many did it resolve without human help? Are customers satisfied with the AI responses?
The analytics you get depend on your plan tier:
- Essential: Included with all Zendesk Suite plans. Covers basic metrics like automated resolutions and escalation rates.
- Advanced: A paid add-on that unlocks deeper analytics like use case performance breakdowns, BSAT (Bot Satisfaction) scores, and knowledge gap analysis.
If you're serious about optimizing your AI agent, you need these numbers. They tell you whether your AI is actually saving time or just creating more work for your team.
At eesel AI, we see this data as the starting point. Our AI Agent works alongside Zendesk to help identify knowledge gaps and suggest new help articles based on what your customers are actually asking.

Understanding Zendesk's analytics dashboards
Zendesk splits AI analytics across three main dashboards depending on your plan and add-ons. Each serves a different purpose.
Insights dashboard (Essential tier)
This is your starting point if you're on any Zendesk Suite plan. The Insights dashboard provides a high-level view of your AI agent's performance over the last 30 days.
Here's what you'll see:
- Active users: Unique customers who engaged with your AI agent
- Transferred to agent: Percentage of conversations handed off to humans
- Automated resolutions: Percentage resolved entirely by the AI
The data updates hourly, though there's a 72-hour delay before a conversation is marked as "resolved" (Zendesk wants to make sure the customer doesn't come back with a follow-up question).
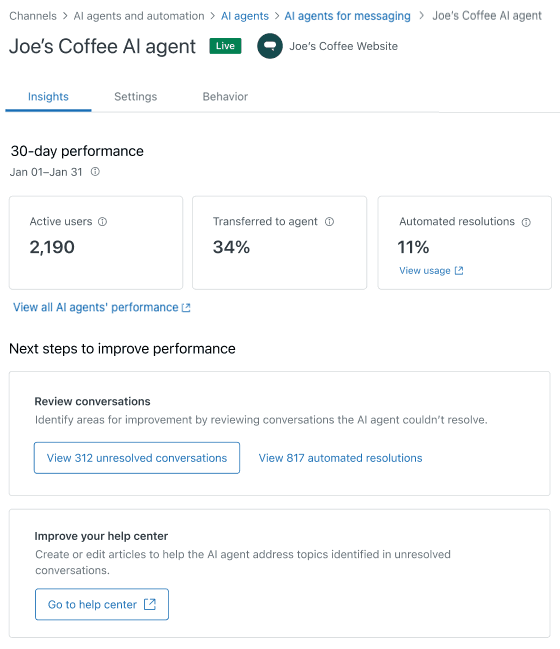
This dashboard is perfect for teams just getting started. It gives you the basics without overwhelming you with data.
Advanced reporting dashboard (Advanced add-on)
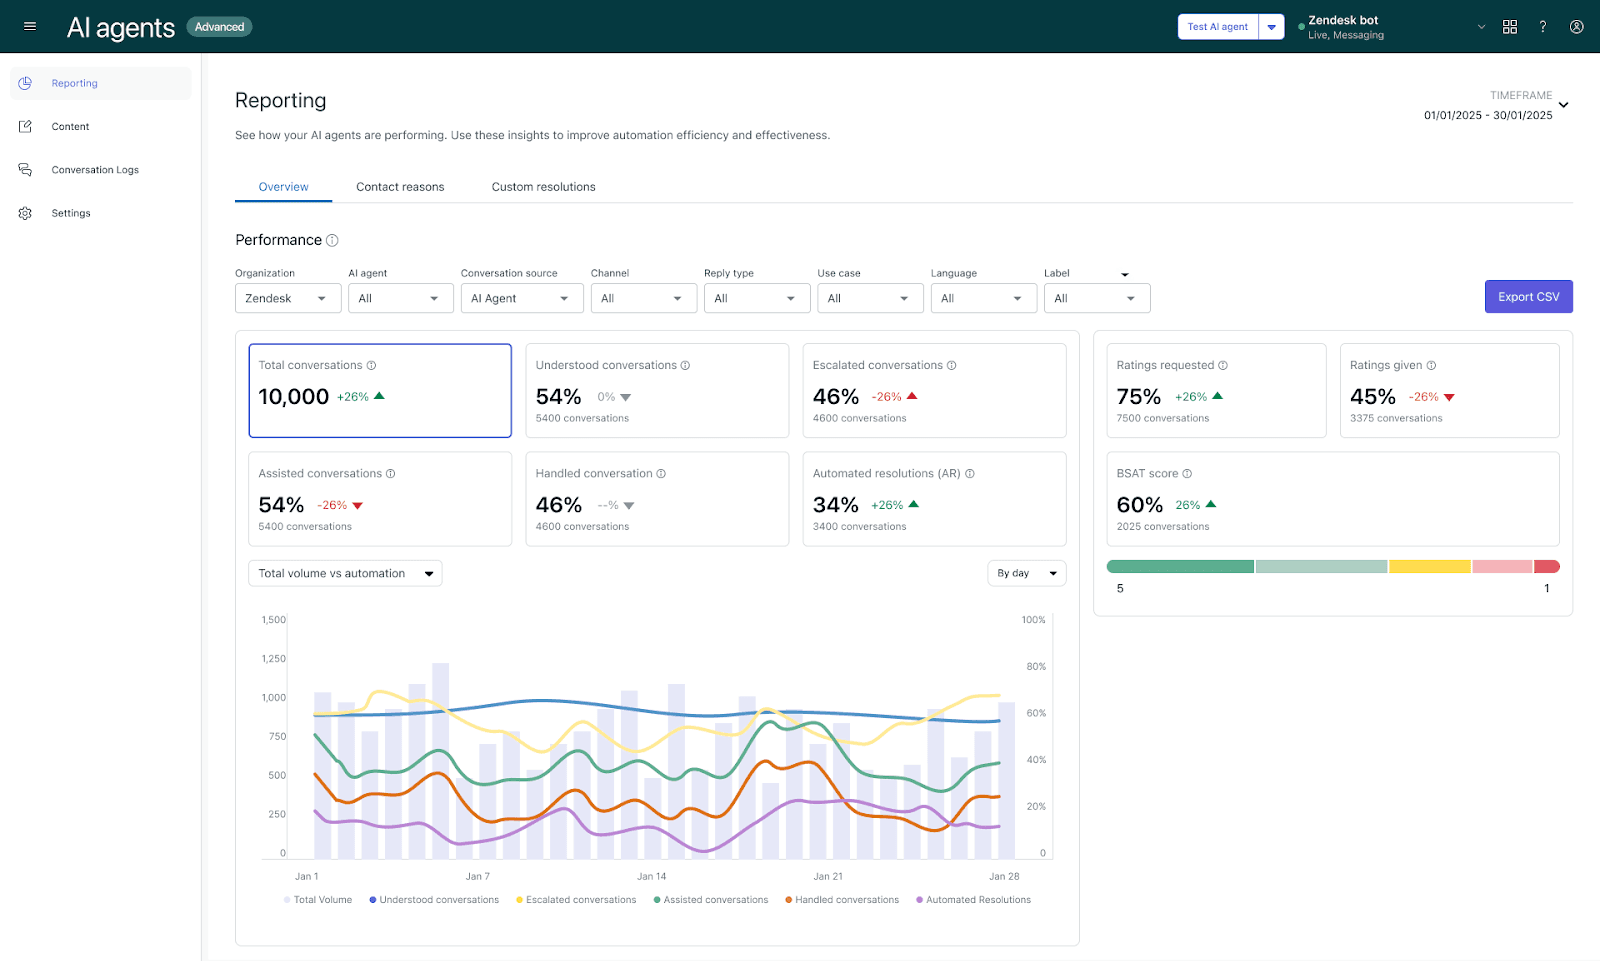
If you have the Advanced AI Agents add-on, you get a significantly more powerful dashboard. This is where you go for deep analysis and optimization.
The Advanced reporting dashboard has three tabs:
Overview tab: High-level metrics including BSAT scores, volume trends, and performance over time. You can filter by AI agent, channel, language, and more.
Contact reasons tab: Breaks down performance by use case and knowledge source. This shows you which topics your AI handles well and where it falls short.
Custom resolutions tab: Tracks specific resolution types you've configured.
Key metrics here include:
- Understood conversations: Percentage where the AI provided a relevant answer
- Escalated conversations: Handoffs to human agents (with detailed reasons)
- Assisted conversations: Partial AI help without full resolution
- BSAT scores: Direct customer feedback on AI interactions
Generative AI agent tools dashboard (Copilot add-on)
If you're using Zendesk Copilot (the AI assistant for human agents), there's a separate dashboard for tracking how your team uses AI-powered productivity features.
This tracks:
- Summaries generated: How often agents use AI to summarize long ticket threads
- Messages expanded: Usage of the "expand this note" feature
- Tone changes: How often agents adjust message tone with AI help
This dashboard focuses on agent productivity rather than customer-facing automation. It helps you understand if your team is actually adopting the AI tools you're paying for.
Key metrics to track and what they mean
Let's get specific about the numbers that actually matter.
Automation and resolution metrics
These tell you whether your AI is doing its primary job: handling conversations without human intervention.
| Metric | What it tells you | Good benchmark |
|---|---|---|
| Automated resolutions | % of conversations resolved without human help | 60-80% for mature deployments |
| Escalation rate | % handed off to human agents | 20-40% (inverse of automation) |
| Understood conversations | % where AI provided relevant answers | 70%+ indicates good knowledge coverage |
Source: Zendesk help documentation
Important note: Escalation rate is not the exact inverse of automated resolutions. One minus escalation rate equals the deflection rate, and automated resolutions are a subset of deflected conversations that meet specific quality criteria.
Quality and satisfaction metrics
Volume means nothing if customers hate the experience. These metrics tell you how people actually feel about your AI.
Bot Satisfaction (BSAT): This is Zendesk's version of CSAT for AI interactions. Customers rate their experience on a 1-5 scale after AI-handled conversations.
- 4-5 scores count as positive
- Track the trend over time, not just the absolute number
- A dropping BSAT is often your first warning that something is broken
Ratings requested vs. given: Shows how many customers actually respond to feedback requests. Low response rates can indicate survey fatigue or that the AI ended conversations abruptly.
Use case performance: Breaks down BSAT and resolution rates by topic. You might find your AI crushes "password reset" requests but struggles with "billing disputes."
Operational efficiency metrics
These help you understand the broader impact on your support operation.
- Active users: Raw volume of people using your AI. Growing numbers suggest customers trust it.
- Handled vs. assisted conversations: Distinguishes between full AI resolution and partial help. Both are valuable but in different ways.
- Knowledge source performance: Shows which help center articles the AI uses most (and which ones fail to resolve issues).
That last one is especially useful. If the AI keeps referencing an article but the conversation still escalates, that article probably needs work.
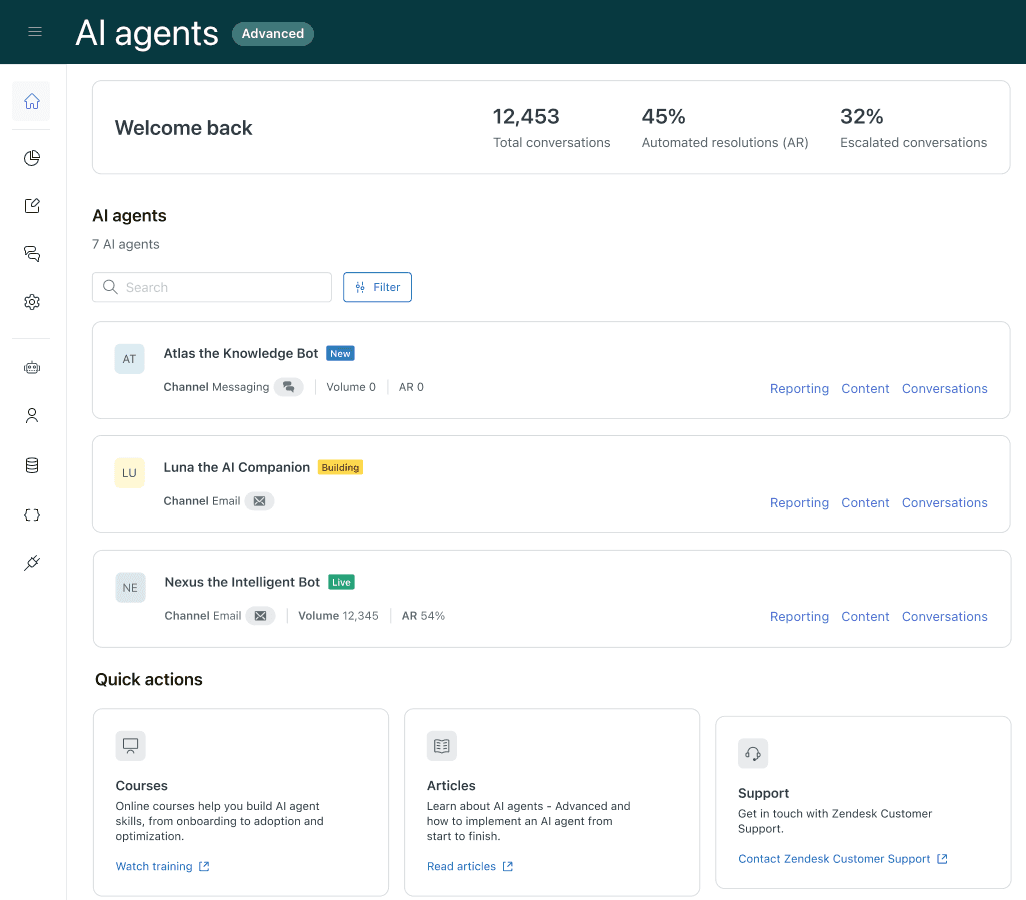
How to access and use your analytics
Finding your analytics is straightforward once you know where to look.
For Essential tier (Insights dashboard):
- Go to Admin Center
- Click AI in the sidebar, then select AI agents > AI agents
- Click the AI agent you want to monitor
- Click the Insights tab
For Advanced tier (Reporting dashboard):
- Access the AI agents - Advanced add-on through the Zendesk product tray
- Click Reporting in the left sidebar
- Select your tab: Overview, Contact reasons, or Custom resolutions
Tips for effective analytics use:
- Set a weekly calendar reminder to review your dashboard
- Export data monthly for trend analysis in Excel or Google Sheets
- Compare week-over-week numbers, not just daily fluctuations
- Share key metrics with your team so everyone understands the AI's impact
Zendesk AI agent pricing and analytics access
Your analytics capabilities depend on your plan. Here's the breakdown:
| Plan | Price/agent/month (annual) | Key analytics features |
|---|---|---|
| Suite Team | $55 | Insights dashboard (Essential), automated resolution tracking, generative replies |
| Suite Professional | $115 | Everything in Team + Copilot writing tools, customizable reporting with real-time insights |
| Suite Enterprise | $169 | Everything in Professional + business rules analysis, visual data alerts |
Source: Zendesk pricing page
Add-ons for deeper analytics:
- Advanced AI Agents: Contact sales for pricing. Unlocks use case performance breakdowns, BSAT tracking, knowledge gap analysis, and conversation journey exploration.
- Copilot: $50/agent/month. Adds the Generative AI agent tools dashboard for tracking agent productivity.
Data retention:
- Insights dashboard: 30 days
- Generative AI tools dataset: Up to 1200 days (over 3 years)
- Advanced reporting: Hourly updates with historical trend data
Is the Advanced add-on worth it? If you're running AI agents at scale and need to optimize performance, probably yes. The use case performance data alone can save you hours of manual analysis.
Turning analytics into action
Data is useless if you don't act on it. Here's how to turn your Zendesk AI agent usage analytics into real improvements.
Identify knowledge gaps: Look for "Couldn't answer" or low "Understood conversation" rates. These indicate topics your AI hasn't been trained on. Create help center articles or use cases for these gaps.
Optimize use cases: Double down on high-performing intents. If "order status" has an 85% resolution rate, can you promote that option more prominently? For low performers, review the conversation logs to see where the AI goes wrong.
Tune escalation rules: Balance automation with satisfaction. If your escalation rate is 10% but BSAT is tanking, your AI might be forcing resolutions instead of handing off when it should. Adjust your escalation triggers.
Iterate continuously: Set a weekly review cadence. Pick one metric to improve each week. Small, consistent optimizations beat sporadic overhauls.
This is where a tool like eesel AI can help. While Zendesk tells you what's happening, our AI Triage and analytics capabilities help you understand why and suggest specific content improvements. We analyze your resolved tickets to identify patterns and recommend new help articles that would have prevented escalations.
Getting the most from your Zendesk AI agent analytics
Zendesk's analytics give you a strong foundation for understanding your AI performance. The key is consistency: check your dashboards regularly, act on what you learn, and keep iterating.
Remember these fundamentals:
- Start with the Insights dashboard if you're on Essential
- Upgrade to Advanced if you need granular use case data
- Track both automation rates AND customer satisfaction
- Use knowledge source performance to guide content improvements
- Export data for deeper trend analysis
Better analytics lead to better AI performance, which leads to happier customers and less stressed support teams.
If you're looking to go deeper, eesel AI works alongside Zendesk to provide enhanced AI teammate capabilities. Our platform helps you identify knowledge gaps, suggest new content, and continuously improve your AI's performance based on real conversation data. You can learn more about our approach in our practical guide to Zendesk AI agent analytics.