
If you work in customer experience, you know that data isn't just a bunch of numbers, it's everything. It’s how you show your team’s impact, spot problems before they blow up, and make smart calls that actually help the business. Your Gorgias dashboard is your command center for all of this, the place where raw data becomes a clear plan of action.
This guide is all about getting the most out of your Gorgias dashboard widgets. We'll start with mastering what's already built-in and then explore how to pull in more information with integrations.
We’re also going to talk about how to get the most comprehensive view possible: while native dashboards are excellent at showing you what’s happening in the helpdesk, you can also integrate knowledge from the rest of your company. Let's figure out how to see the whole picture.
What are Gorgias dashboard widgets?
Think of your Gorgias dashboard as the cockpit for your entire support operation. It’s designed to give you a quick visual summary of your most important customer experience (CX) metrics and team performance, all in one spot. The individual building blocks of this dashboard are called widgets.

Each widget is a little chart or stat that keeps an eye on a specific number, like your customer satisfaction (CSAT) score, how many tickets are coming in, or how long it takes an agent to close a conversation. The goal is simple: let you check on performance and make decisions based on real data, without having to spend your afternoon with spreadsheets.
Gorgias is very flexible here, letting you create up to 10 separate dashboards. That means you can build different views for different tasks: maybe one for tackling a ticket backlog, another for boosting your CSAT score, and a third just to track how much revenue your support team is bringing in.
Understanding the native Gorgias dashboard widgets
Before you go hunting for external tools, it’s a good idea to get really comfortable with what Gorgias gives you right out of the box. A well-built native dashboard is your first line of defense, and its widgets provide a robust starting point for tracking what really matters.
Key metrics you can track with built-in Gorgias dashboard widgets
Gorgias comes with a powerful set of widgets you can arrange to create the perfect report for your team's goals. Here are some of the most useful ones:
Team performance
You can keep an eye on individual and team productivity with widgets that track closed tickets, first response time (FRT), and CSAT scores per agent. There’s also a "Busiest Times" widget, which is incredibly useful for spotting your peak support hours and days. This helps you make smarter staffing decisions so you’re always prepared for customer needs.
Ticket volume and efficiency
The "Created vs. Closed Tickets" widget gives you a live look at your backlog. Are you treading water, falling behind, or actually getting ahead? This widget tells that story at a glance. You can also track your average resolution time, which measures how long it takes your team to solve an issue from start to finish, a core indicator of how efficient your process is.
Customer satisfaction
Of course, you have the "Average CSAT" widget for a high-level view of customer happiness. But you can also dig into the "why" behind those scores. The dashboard can highlight comments from surveys, letting you analyze the actual feedback to find recurring positive trends or areas for adjustment.
Revenue and automation
For e-commerce brands, the "Support-Driven Revenue" widget is a big one. It directly connects your team's conversations to sales, which is perfect for proving the financial impact of providing excellent service. You can also track your "Automation Rate," which shows the percentage of tickets being handled efficiently through automation. This is a key metric for measuring the return on your automation efforts.
Optimizing the focus of native Gorgias dashboard widgets
While these widgets are fantastic for seeing what’s going on inside Gorgias, they are purposefully specialized for helpdesk data.
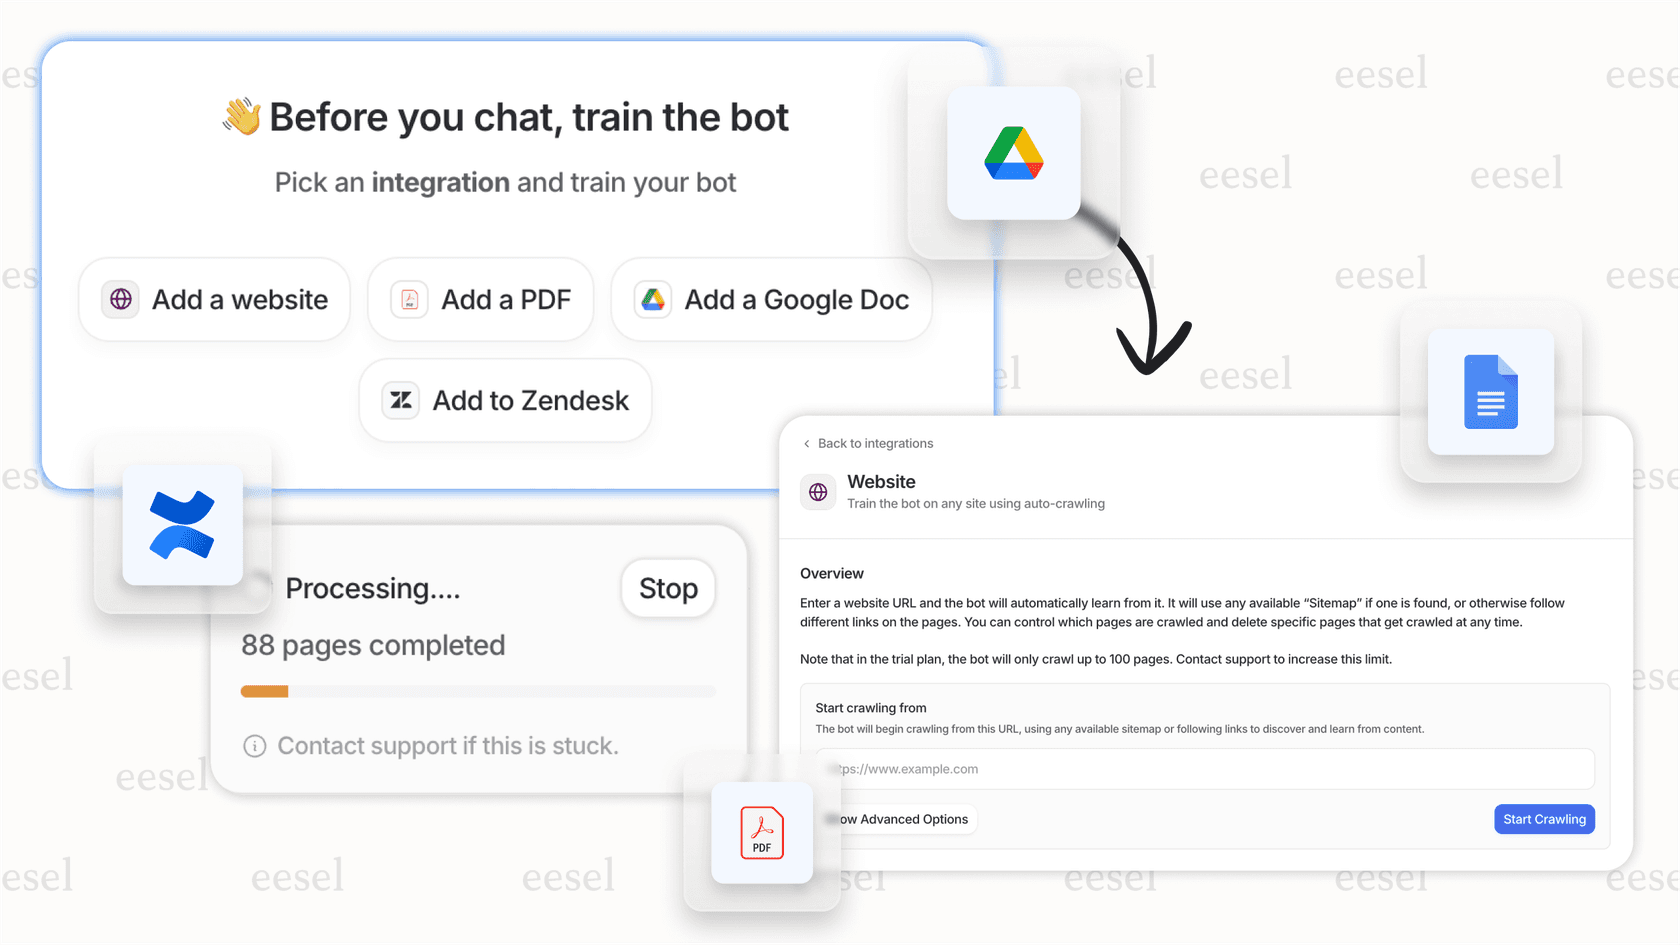
Your company’s knowledge is often spread out across different platforms, like Confluence pages, Google Docs, internal wikis, and Slack channels. The native Gorgias dashboard widgets are designed to focus on ticket-specific data. To bring in additional context from outside sources, many teams choose to use integrations that complement the native dashboard.
This focused approach ensures your helpdesk metrics stay clear, while allowing you to add more layers as you grow your library of knowledge.
Extending your Gorgias dashboard widgets with third-party apps
To get a more complete picture, the next logical step is to use integrations. Gorgias lets you connect to other platforms, which can add custom widgets to your ticket sidebar. This is a handy way to give agents more context about a customer without making them jump between a bunch of different browser tabs.
How integrations add contextual Gorgias dashboard widgets
Gorgias uses HTTP integrations to pull data from other tools your team relies on, like Rivo for loyalty programs or Skio for subscriptions. When an agent opens a ticket, these integrations pop up as little widgets in the sidebar with relevant info.

For instance, an agent could immediately see a customer's loyalty points, their VIP status, or their current subscription details right next to the ticket they're working on. This saves time and helps the agent give a more informed, personal response.
Optimizing the integration of Gorgias dashboard widgets
Adding individual widgets for each tool is definitely an improvement. To make sure your sidebar stays organized, it’s helpful to select the integrations that provide the most value for your specific workflows.
By choosing the right mix of widgets, you can pull isolated data into one place. For teams looking to unify this data even further, there are additional AI-powered options that can help create a single, smart source of truth for even deeper analysis.
Beyond standard Gorgias dashboard widgets: Gaining unified AI insights with eesel AI
If you want to further elevate your reporting and automation, you can consider an AI platform that connects your knowledge sources together. This is where a tool like eesel AI can work alongside Gorgias to enhance your experience.
Unify all your knowledge within the Gorgias ecosystem
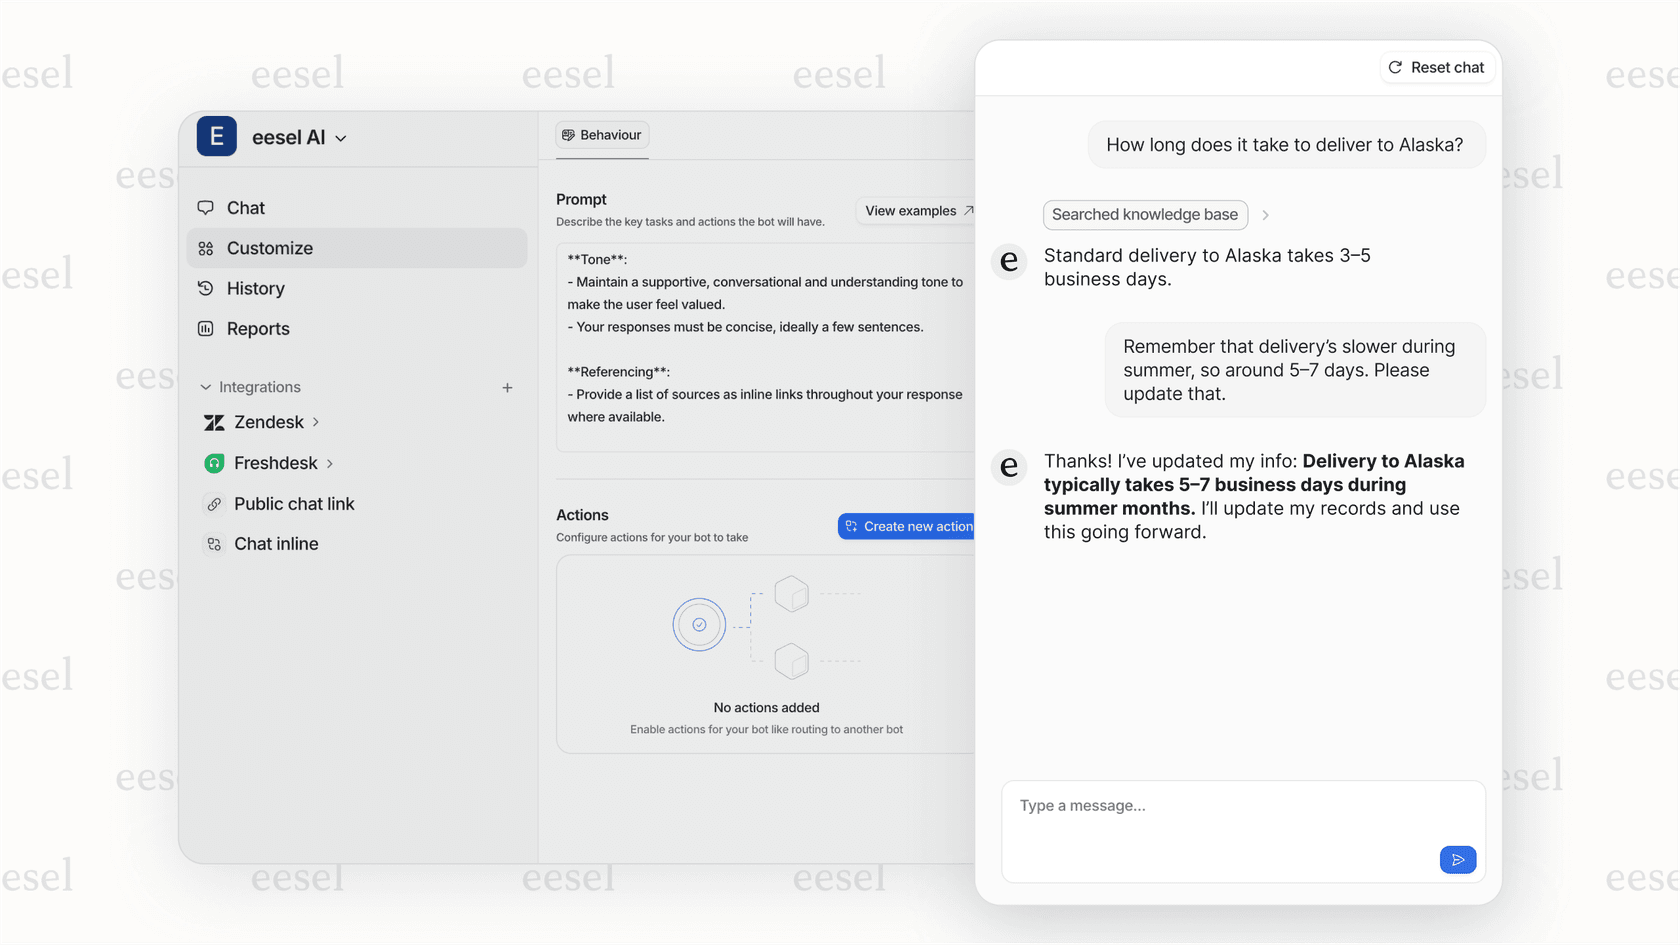
Instead of just adding another widget, eesel AI for Gorgias connects to your company's knowledge. It syncs with your past Gorgias tickets and also works with knowledge bases like Confluence and Notion, your files in Google Docs, and your internal chats in Slack.
eesel AI builds a central intelligence that understands your business context and brand voice. This unified knowledge works in harmony with Gorgias to help with automatically resolving tickets and generating reports that offer clear paths forward.
Use simulation to test and forecast alongside your Gorgias dashboard widgets
While your Gorgias dashboard is great at telling you what happened in the past, you can use simulation tools to look ahead. eesel AI offers a "simulation mode" that lets you see how it would have responded to your real tickets from the past week.
Get actionable reports that enhance Gorgias dashboard widgets
The analytics in eesel AI complement the standard metrics you'll find in Gorgias dashboard widgets. It can highlight questions it couldn't find answers for, showing you where there might be gaps in your documentation.
This gives you a clear, data-driven to-do list for your next knowledge base update. You'll know exactly which help articles to write or what documentation needs a refresh. It turns your reporting into a forward-looking tool for improvement, helping you make your numbers even better.
Gorgias pricing overview
It’s helpful to know that Gorgias's pricing is designed to scale with your business, primarily based on the number of "billable tickets" you handle each month. Their powerful AI features are typically included in higher-tier plans or as add-ons.
| Plan | Monthly Price (Billed Yearly) | Billable Tickets/Month | AI Agent Interactions |
|---|---|---|---|
| Starter | $10/mo (No yearly plan) | 50 | $1.00 per resolution |
| Basic | $50/mo | 300 | 60 included ($0.90/extra) |
| Pro | $300/mo | 2,000 | 600 included ($0.90/extra) |
| Advanced | $750/mo | 5,000 | 2,500 included ($0.90/extra) |
| Enterprise | Custom | Custom | Custom pricing |
This data was pulled from the Gorgias Pricing Page in late 2025. As always, plans and pricing can change.
Build a smarter dashboard using Gorgias dashboard widgets
Gorgias dashboards give you a reliable way to track your core CX metrics. By adding third-party widgets and complementary AI layers, you can create an even more comprehensive view of your support operations.
The future of support reporting is about using the powerful tools in Gorgias and adding layers of intelligence to connect all the dots. When you unify your knowledge and use advanced analytics, you can proactively improve your performance and turn your data into a real competitive edge.
Take control of your support data with Gorgias and eesel AI
Ready to see how a unified approach can help your support team? eesel AI connects seamlessly with Gorgias and all your other tools, getting you up and running quickly. Start your free trial today and discover the insights hiding in your data.
Frequently asked questions
What exactly are Gorgias dashboard widgets, and what's their main purpose?
Gorgias dashboard widgets are visual blocks on your Gorgias dashboard that summarize key customer experience (CX) metrics and team performance. Their main purpose is to give you a quick, data-driven overview of your support operations, enabling faster decision-making without deep diving into spreadsheets.
What key metrics can I track using the native Gorgias dashboard widgets?
Native Gorgias dashboard widgets allow you to track essential metrics such as team performance (e.g., first response time, CSAT scores per agent), ticket volume (created vs. closed), average resolution time, overall customer satisfaction, and even support-driven revenue and automation rates.
How do native Gorgias dashboard widgets focus on helpdesk data?
Native Gorgias dashboard widgets are expertly designed to display data from within Gorgias itself. They provide a specialized view of helpdesk interactions, which can be further enhanced by connecting other company knowledge sources like internal wikis or Google Docs through complementary integrations.
How can third-party integrations enhance the functionality of Gorgias dashboard widgets?
Third-party integrations can enhance Gorgias dashboard widgets by pulling relevant data from other tools (e.g., loyalty programs, subscription platforms) directly into the ticket sidebar. This provides agents with immediate, contextual information about a customer, improving efficiency and personalization.
Can Gorgias dashboard widgets provide insights from all my company's knowledge, not just support tickets?
Standard Gorgias dashboard widgets focus on providing world-class helpdesk metrics. To gain insights from your entire company knowledge base, including platforms like Confluence, Notion, and Slack, you can use a complementary AI platform that integrates with Gorgias to understand diverse data points.
How can AI-powered insights go beyond what standard Gorgias dashboard widgets offer?
AI-powered insights enhance standard Gorgias dashboard widgets by unifying all company knowledge, providing even deeper context. This allows for advanced analytics that highlight knowledge gaps, forecast automation impact through simulation, and provide actionable recommendations for continuous improvement.