Customer behavior analysis: a support team's guide for 2026

Riellvriany Indriawan

Katelin Teen
Last edited July 6, 2026
What customer behavior analysis actually means for a support team
The textbook definition is fine as a starting point. InMoment describes it as "the process of studying and interpreting how customers interact with a business at each stage of the customer journey," and the payoff is that you "shift from reacting to customer demands to anticipating them." SurveyMonkey frames it as understanding "how and why buyers interact with your business."
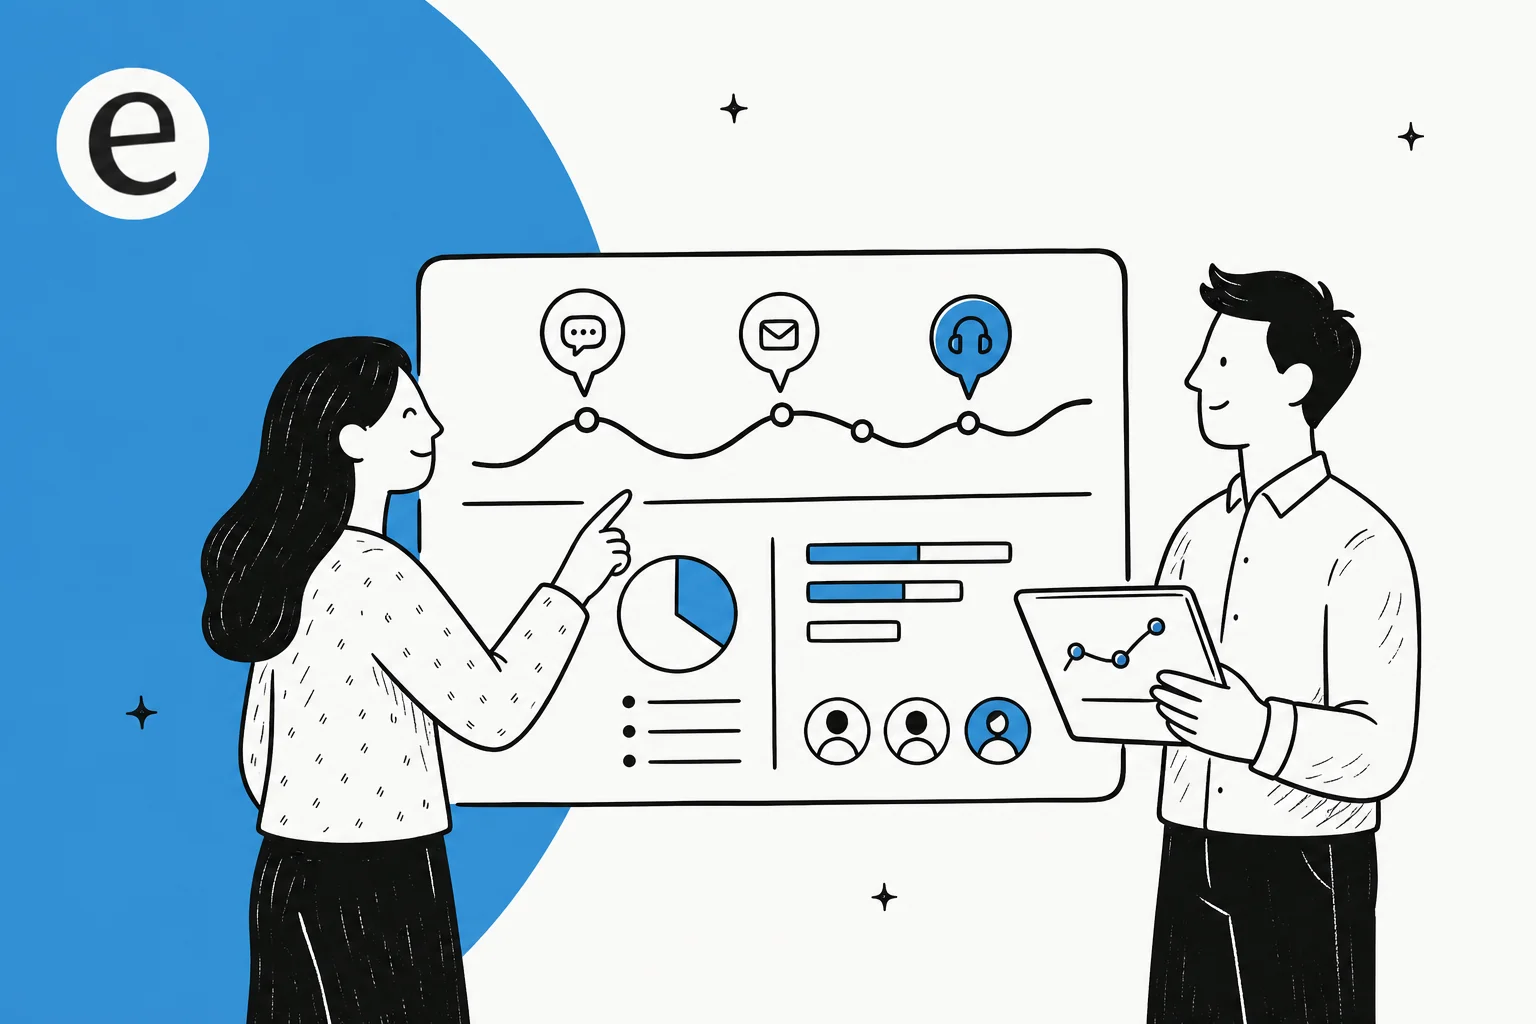
For a marketing team, the behavioral signal is clickstreams and cart data. For a support team, it lives somewhere messier: the tickets, chat transcripts, call recordings, and survey responses piling up in your AI helpdesk every day. That is both the problem and the opportunity. It is the richest record you have of what customers want and where they get stuck, and historically it has been the hardest thing to read at scale.
One distinction worth getting right up front, because people mix them up: customer behavior analysis is not the same as journey mapping. As InMoment puts it, journey mapping visualizes the paths customers take, while behavior analysis "seeks to understand the underlying motivations and drivers behind a customer's decisions." Mapping gives you the route. Behavior analysis tells you why customers take it, and where they bail.
Here is the thing I keep coming back to on the queue: your tickets are the honest version of your product. A founder on r/SaaS put it bluntly in a widely shared thread titled "Support tickets are free product research. Most founders ignore them":
"I read every ticket personally. Takes about 35 minutes each morning."
That habit is behavior analysis in its rawest form. The rest of this guide is about doing it systematically, and then not having to spend 35 minutes a morning on it.
The five lenses of customer behavior analysis
Most of the methods you will read about collapse into five lenses. You rarely need all five at once; you pick the one that matches the question you are asking.
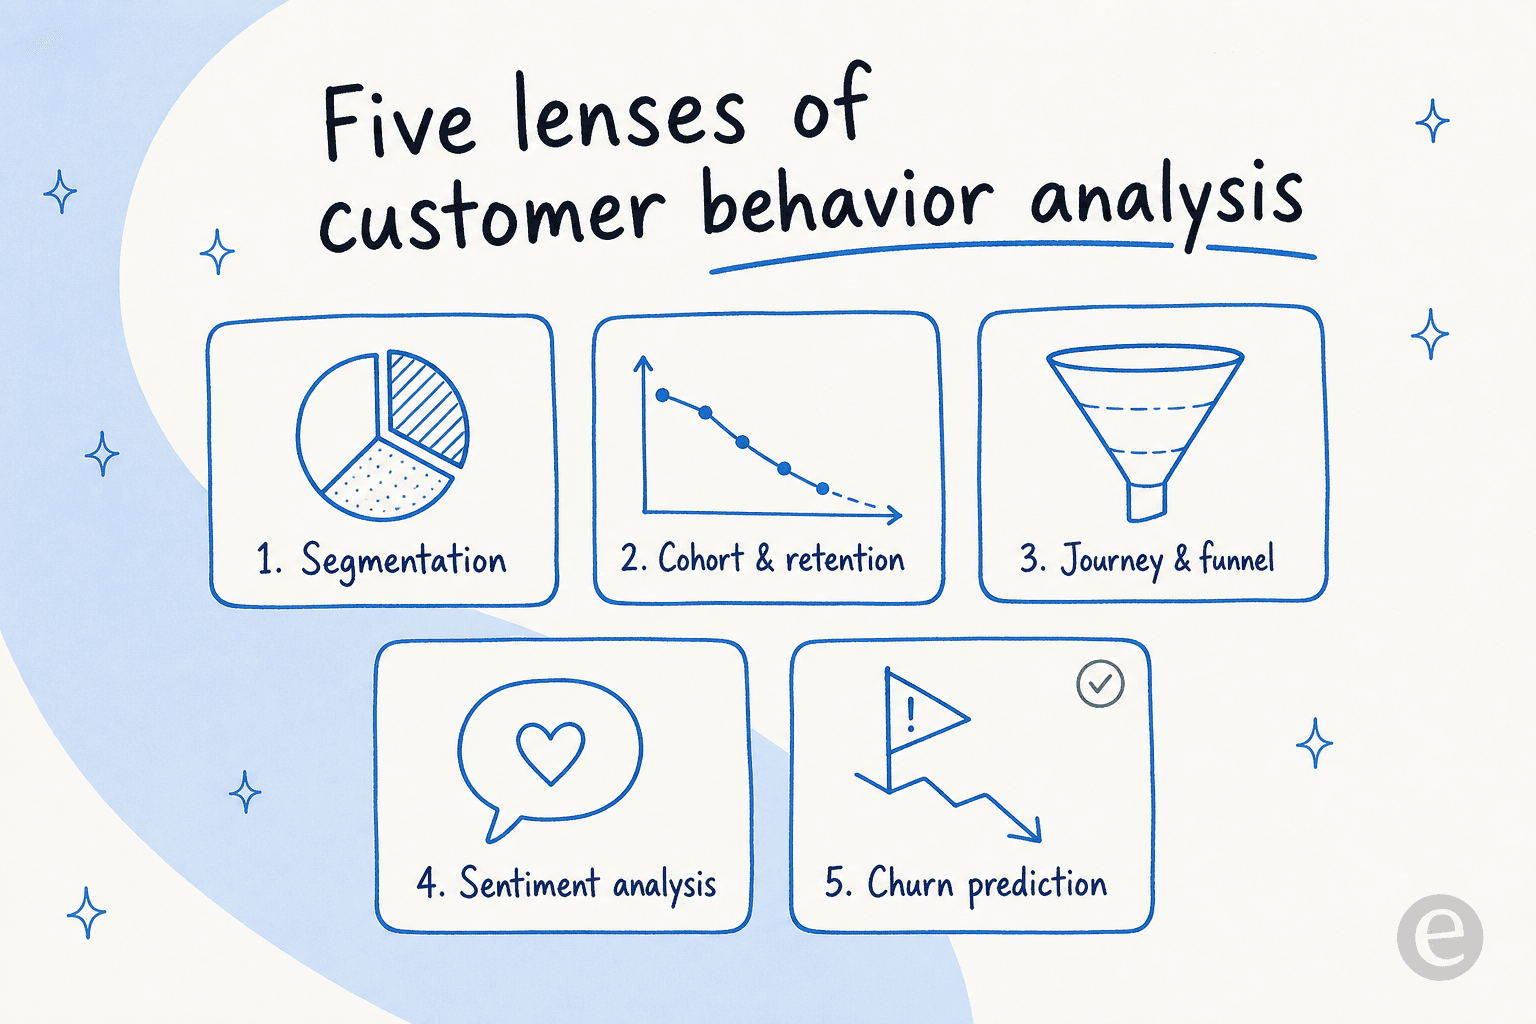
- Segmentation. Grouping customers by shared traits or, more usefully, shared behavior. InMoment notes a shift "beyond traditional demographic segmentation" toward behavioral segmentation, grouping people by what they do rather than who they are. In support terms: new customers ask onboarding questions, power users file feature edge cases, and those two groups need different playbooks.
- Cohort analysis. Tracking a group defined by a shared event, InMoment lists "the month of purchase, campaign type, or location," and watching how their behavior diverges over time. If March signups churn faster than February signups, cohort analysis is what surfaces it.
- Journey and funnel analysis. Finding where customers drop off in a defined sequence: onboarding, checkout, or self-service resolution. If 60% of people who open your knowledge base still file a ticket, your funnel is leaking at the deflection step.
- Sentiment analysis. Scoring the emotional tone of messages. Zendesk defines customer sentiment as using "text analysis to measure customers' positive, negative, or neutral tone," and importantly distinguishes it from satisfaction, which you measure with CSAT or NPS surveys. Sentiment is what the customer felt; CSAT is what they told you when asked.
- Churn prediction. Using history to make an educated guess about the future. InMoment describes combining "past historical data, artificial intelligence, and machine learning" to predict "likelihood to purchase, churn risk, or response to specific promotions." For support, the input is often a customer health score built partly from service signals.
If you are trying to figure out which AI customer service tool fits your team, one useful filter is which of these lenses it can actually do for you versus which it leaves as a manual export-to-spreadsheet job.
The metrics that actually tell you something
You cannot analyze behavior without something to measure. The frustrating part is that the metrics most worth tracking are the ones fewest teams track. Klaviyo's 2026 customer service research has the adoption numbers, and they are lopsided.
| Metric | What it measures | How many track it | Why it matters for behavior analysis |
|---|---|---|---|
| CSAT | In-the-moment satisfaction, usually 1-5 post-resolution | 53% (the top metric) | Early warning signal for immediate friction |
| Response time / TTR | How fast you reply and resolve | 35% | Correlates tightly with satisfaction and churn |
| Retention / churn rate | Whether customers stay | 35% | The outcome behavior analysis is trying to move |
| CES | How hard the customer had to work | 25% | High effort predicts disloyalty better than most metrics |
| Revenue influenced by service | Upsell and retention tied to support | 24% | Reframes support as revenue, not cost |
| FCR | Issues solved in one interaction | 18% | Low FCR means recurring behavioral pain |
| NPS | Likelihood to recommend, 0-10 | 13% | Slower signal, better for cohort trends |
The one I would push teams to add is CES, because effort is such a strong predictor. Klaviyo cites Gartner's finding that 96% of customers who hit a high-effort service interaction become more disloyal, compared to just 9% who had a low-effort experience. Yet only a quarter of teams measure effort at all.
The broader shift is that support is no longer treated as a cost centre. Nextiva's 2026 statistics report found 79% of companies now see CX as a source of revenue, and Klaviyo reports 87% of service leaders view support as a core brand differentiator. That is also why how much AI can save in support has become a board-level question rather than an ops footnote. If you want the full menu, we keep a running list of the customer service KPIs worth tracking, and how they map to the AI customer service metrics that only became measurable recently.
How to run a customer behavior analysis without a data team
You do not need a BI stack or a data analyst to start. You need one sharp question and the tickets already sitting in your helpdesk. Here is the loop I would actually run.
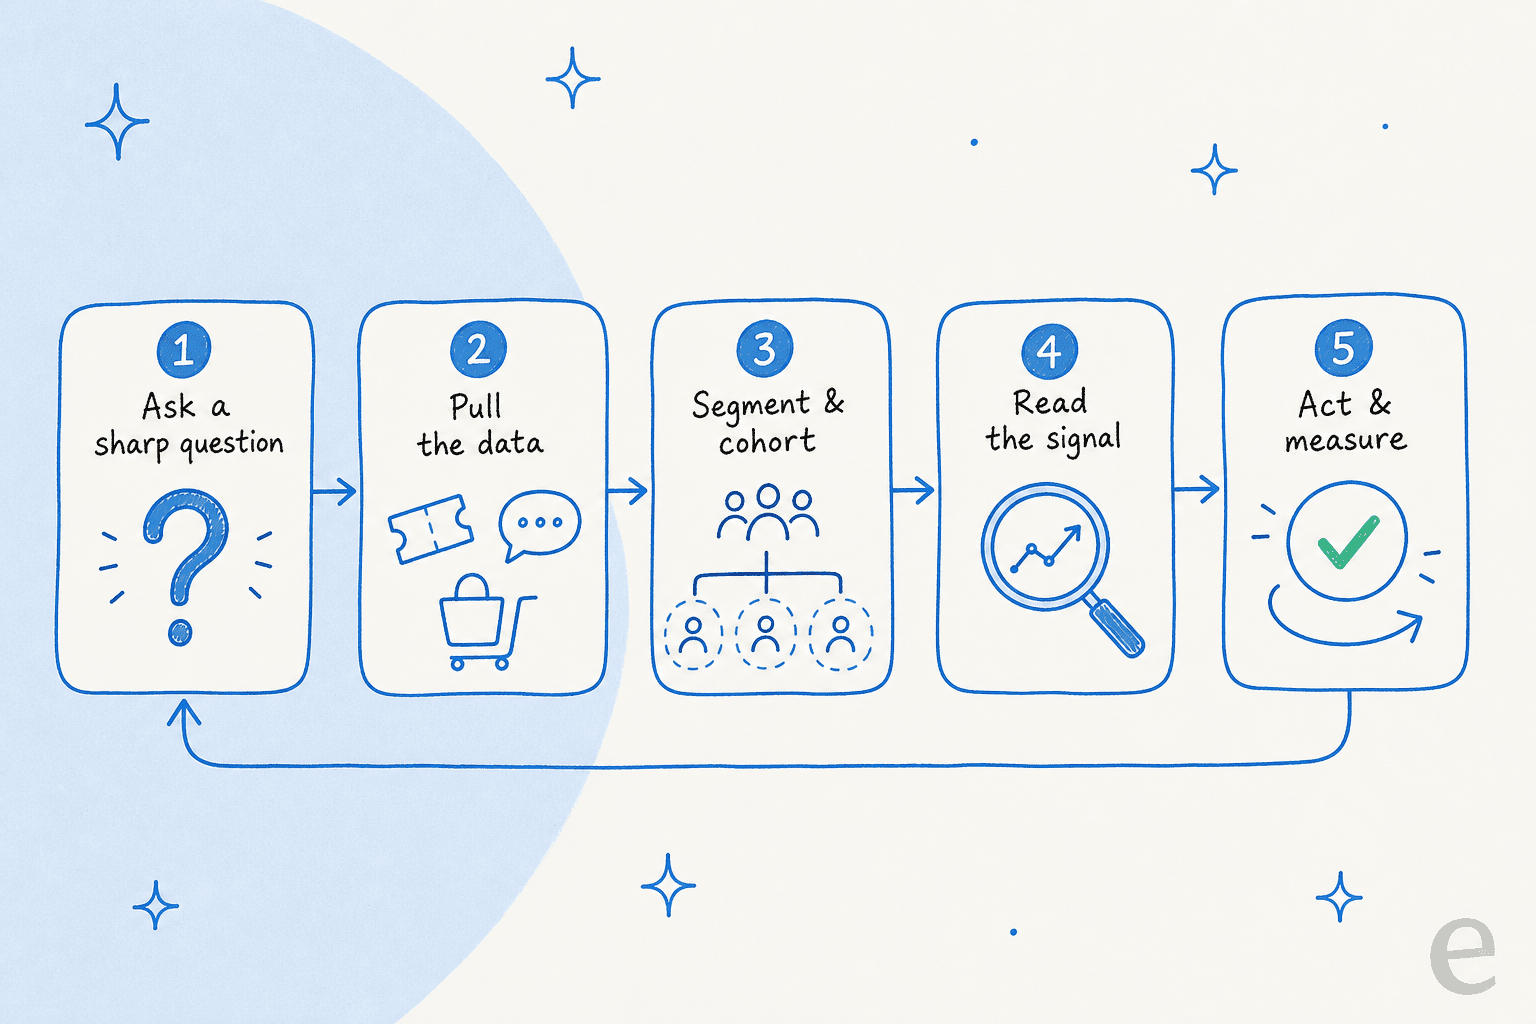
- Ask a sharp question. "Why did CSAT drop in the EU segment last month?" beats "let's look at the data." A vague question produces a dashboard nobody reads. A specific one tells you exactly which tickets to pull.
- Pull the data. For a support question that is your tickets and chats, plus order or account data if the question needs it. This is where fragmentation bites, which we will get to.
- Segment and cohort. Slice by the dimension your question implies: plan tier, signup month, region, ticket reason. The pattern almost always hides in a segment, not the average.
- Read the signal. Tag tickets by reason and sentiment, then aggregate. This is the step that used to eat entire afternoons. A commenter on r/ProductManagement, answering how to get insights from support tickets, described the classic manual approach:
"Work with CS to apply tags/labels to each ticket and then aggregate the data. That will help you understand where to start looking deeper."
- Act and measure. Ship the fix (a help article, a macro, a product change, a routing rule), then watch whether the metric moves. Skipping this step is the single most common failure, and it is why so many "data-driven" teams are anything but.
That last point is worth sitting with. A CX-analytics operator on r/customerexperience described a pattern they see everywhere:
"People talk about being 'data-driven,' but in reality they…" don't close the loop from insight to action.
The loop is only worth running if step five happens. If you are automating the queue itself, the same discipline shows up in a good AI customer service workflow: tag, act, measure, repeat. It is the analytical backbone of solid customer service management.
Where AI changes customer behavior analysis in 2026
For years, the bottleneck in behavior analysis was step four. Reading and tagging conversations by hand does not scale, so teams sampled. You read 50 tickets, you extrapolate, and you hope the other 4,950 look the same. The AI shift is simple to state and large in effect: it reads all of them.
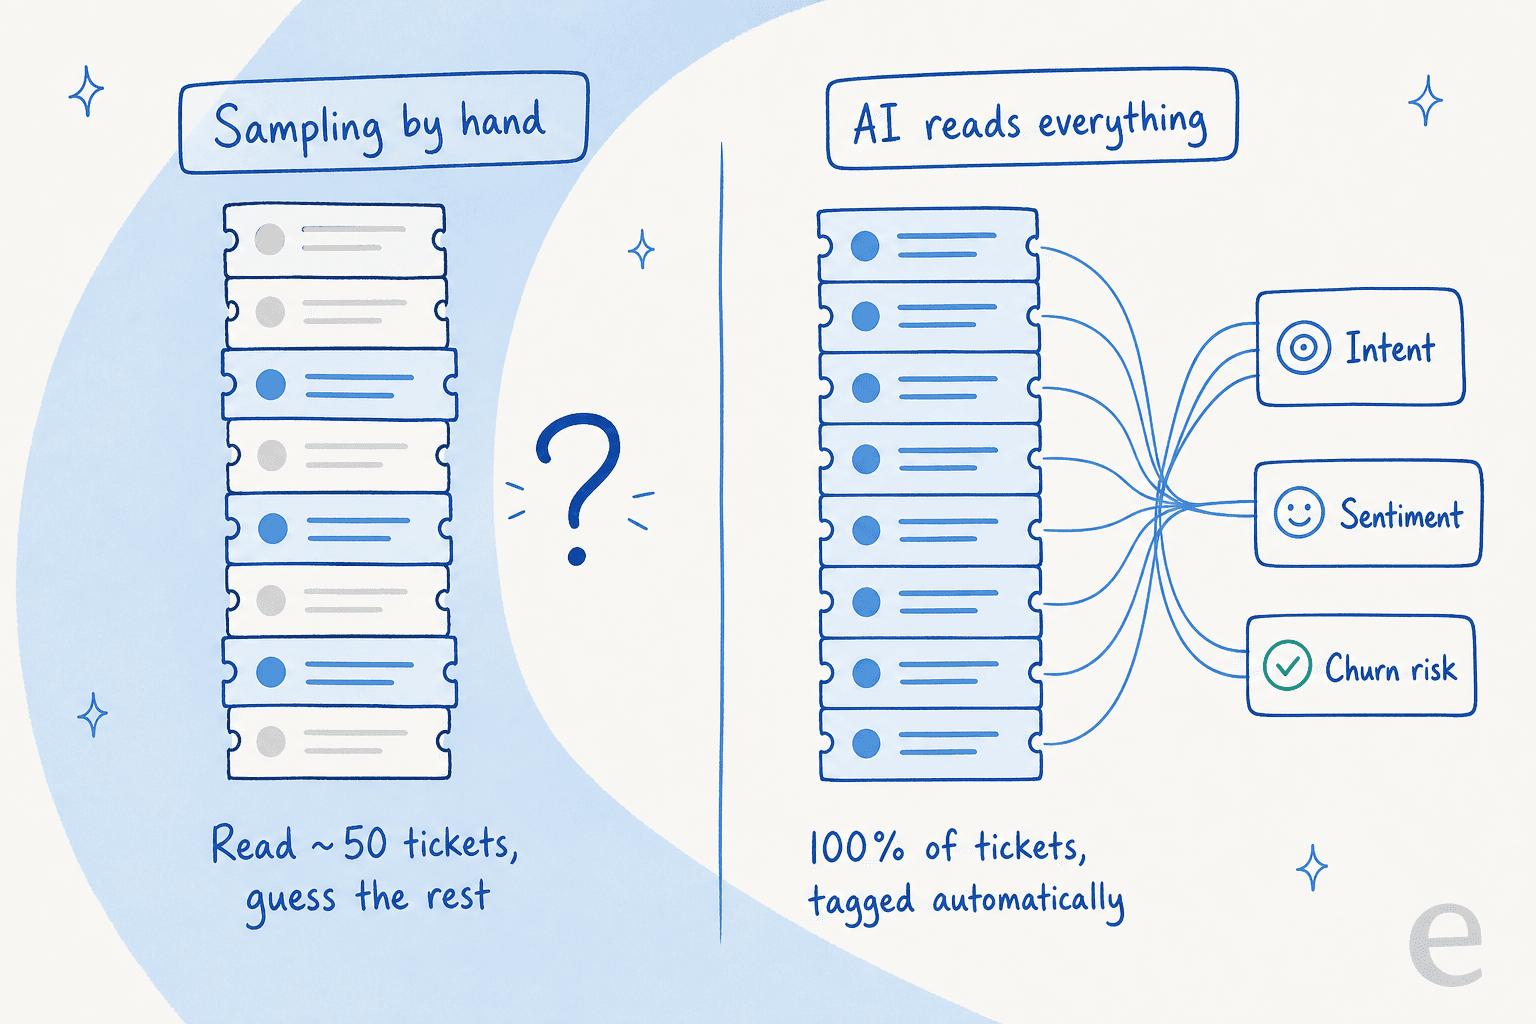
A few things become possible once the reading is automated:
- Sentiment at scale. Zendesk describes analyzing sentiment across "customer surveys, reviews, chats, emails" to prioritize and route, rather than eyeballing a handful.
- Auto-tagging and theme discovery. Instead of agents hand-applying reason codes with wildly inconsistent discipline, the AI classifies every ticket, which turns your whole backlog into aggregate insight you can trust.
- Predictive churn. InMoment and Klaviyo both point to folding service metrics into a customer health score to flag at-risk accounts before they leave, then triggering proactive outreach automatically. It is a big part of what separates the best customer service AI from a basic reply bot.
None of this replaces judgment, and the honest teams know it. Nextiva found 89% of respondents say good service still needs a balance of automation, AI, and the human touch. And expectations should stay grounded: a Zendesk user on r/Zendesk reported their AI agent "handles around 40% of volume" on front-line queries, not everything. That is the realistic shape of it, and it is worth reading alongside our take on AI vs human customer support.
Here is a concrete example of AI-assisted behavior analysis that surprised even us. When we analyzed one mid-market e-commerce team's agents to see how they used AI-drafted replies, we found agents sent the drafts as-is only 12% of the time. The dominant pattern was "glance and rewrite," trimming 8-to-15-sentence drafts down to 1-to-3 sentence replies. Breaking down why they rewrote: roughly 65% of the edits were length and tone, fixable by training the AI on the agents' own past messages, about 20% needed extra connected data like logistics, and only about 5% were the AI being factually wrong. That is customer and agent behavior analysis in action, and it is the kind of signal you only get from studying the actual conversation stream, not a summary dashboard.
The mistakes that make behavior analysis useless
Most failed analyses fail the same handful of ways. These are the ones I see most.
- Manual, inconsistent tagging. If aggregate insight depends on agents remembering to tag correctly under queue pressure, the data is only as good as the busiest day's discipline, which is to say, not good. This is the problem AI customer service tools exist to solve with automatic classification.
- Scattered feedback. A CS leader on r/CustomerSuccess described the norm: "Customer feedback used to live everywhere... Support tickets, Slack conversations, app reviews, survey responses, emails." When there is no single view, no one can see the pattern, and everyone argues from their own anecdote.
- Vanity metrics with no action. Tracking a number you never use is theatre. Deflection rate is a common offender when it is reported but never tied to a decision about staffing or content.
- Never closing the loop. Covered above, but it bears repeating because it is the most common of all: an insight that does not change anything was not worth finding. Our guide to customer service problem solving is really about this last step.
- Confusing sentiment with satisfaction. They are different measurements, as Zendesk notes. A customer can be polite and still churning, or frustrated in the moment and perfectly loyal. Track both, and hold them to clear customer service standards so the numbers mean the same thing to everyone.
Doing behavior analysis with eesel
If your behavior analysis keeps stalling at "someone has to read and tag all these tickets," that is exactly the gap eesel AI is built to close. It connects to the helpdesk you already run, Zendesk, Freshdesk, and others, reads every incoming ticket and chat, and classifies reason and sentiment automatically instead of leaving it to manual tags.
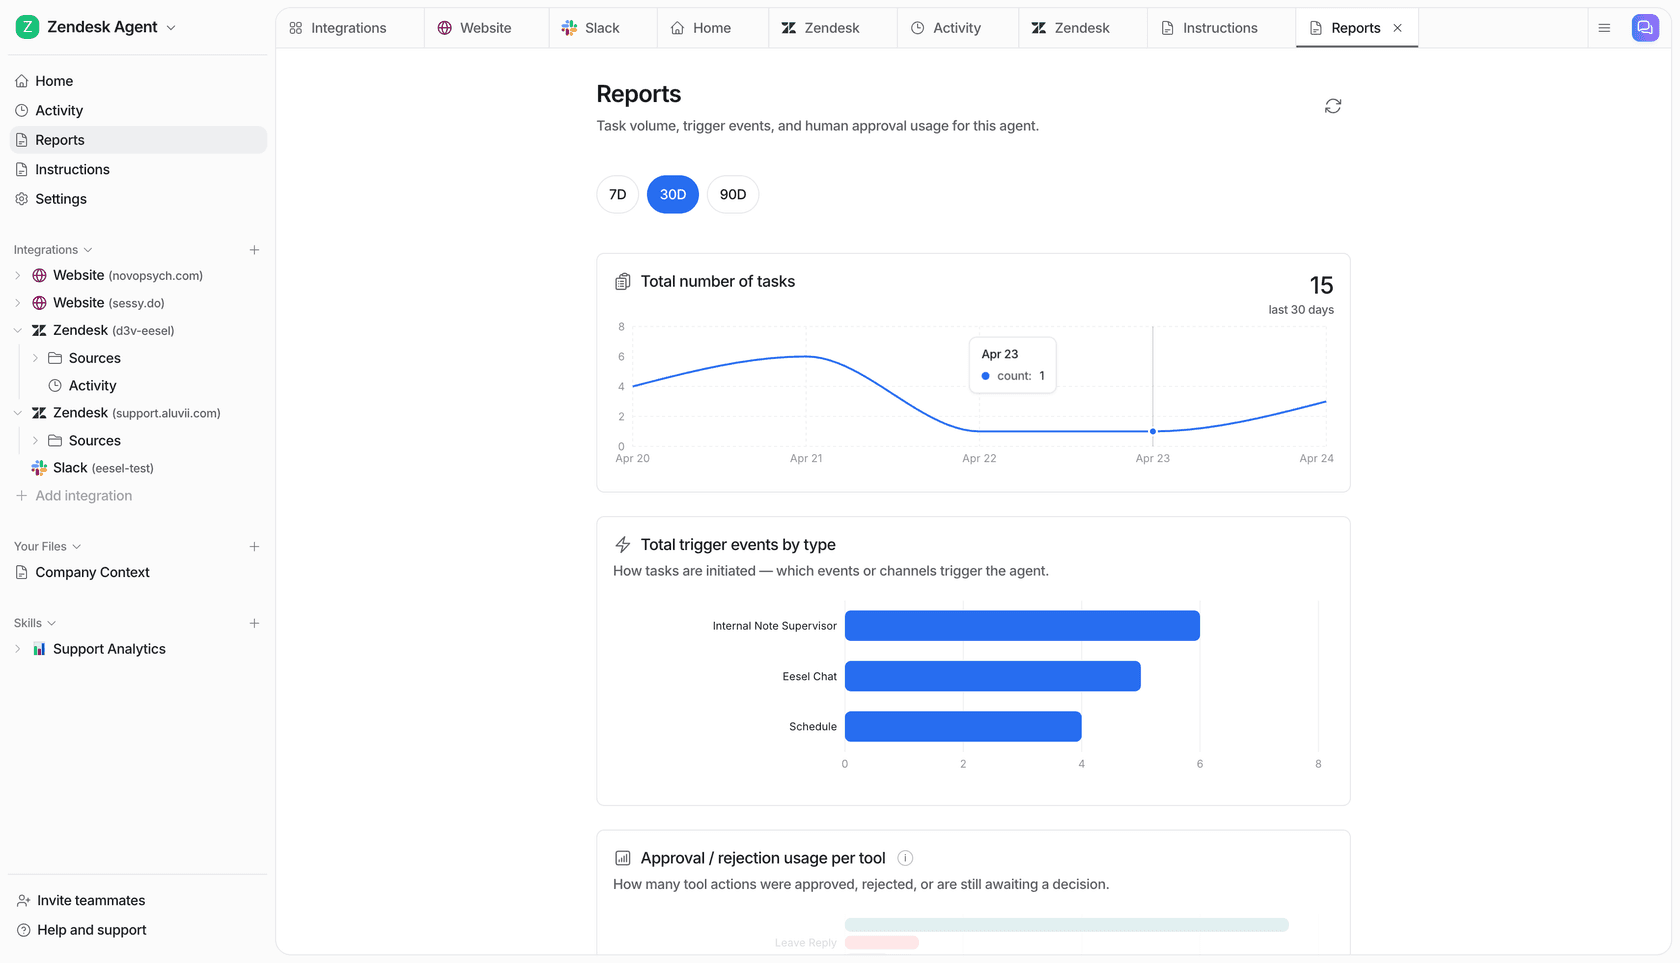
The part I would point a skeptical support lead to is the simulation. Because we have watched confident-sounding bots quietly give wrong answers, every rollout runs against your own historical tickets first, so you see how the AI would have handled real past conversations, and what it would have resolved, before it touches a live customer. That is behavior analysis and a safety net in the same step: you learn what your customers actually ask, and you learn exactly what AI can take off your plate. It is free to try on your own tickets, and you can see the full AI support setup before committing a single live reply.
Frequently Asked Questions
What is customer behavior analysis?
How do you analyze customer behavior from support tickets?
What metrics matter most for customer behavior analysis?
How does AI change customer behavior analysis?
Do I need a data team to do customer behavior analysis?
What is the difference between customer behavior analysis and journey mapping?
How much of my support volume can AI actually handle?


Article by
Riellvriany Indriawan
Riell is a designer and writer at eesel AI with about two years of experience researching CX platforms, AI chatbots, and helpdesk software. She combines her design background with a sharp eye for how these tools actually look and feel in practice — making her comparisons unusually visual and user-focused.