Ever felt like you're drowning in data but can't find a single drop of useful information? You’re not alone. Dashboards in tools like Jira and Confluence can be jam-packed with charts and graphs, but figuring out what they actually mean for your team often turns into a time-consuming manual task. It's the classic problem of having all the numbers but none of the story.
This is the exact headache Atlassian Intelligence Chart Insights aims to solve. It's an AI feature designed to automatically read your charts, spot trends, and explain what's happening with your team's performance, all from within your dashboards.
In this guide, we'll walk through what this feature is, what it does well, and where it falls short. We’ll also look at how a more connected AI approach can help you move from just seeing insights to actually doing something with them across all your company's tools.
What is Atlassian Intelligence Chart Insights?
Put simply, Atlassian Intelligence Chart Insights is an AI tool that lives inside the Atlassian world, mostly in Atlassian Analytics and your Home Dashboards. Its main job is to analyze the data in your charts so you don't have to.
It does a few straightforward but pretty helpful things:
-
Tells you what the chart means: It turns a confusing bar graph or pie chart into a simple text summary you can understand at a glance.
-
Finds the trends: The AI will point out patterns, like if your resolved tickets are steadily climbing or if your team’s pull request speed has suddenly dropped off.
-
Flags weird stuff: It highlights outliers or unexpected spikes in your data that might be worth investigating.
To use it, you can hover over a chart and click "Insights," or you can generate new charts just by typing a question in plain English, like, "Show me high-priority tickets by assignee." This feature is part of the larger Atlassian Intelligence suite, which uses OpenAI’s tech along with Atlassian's own data to get a sense of how your team works.

Core capabilities of Atlassian Intelligence Chart Insights
Let's get into how this tool actually works day-to-day and the problems it can solve for teams already living and breathing Atlassian.
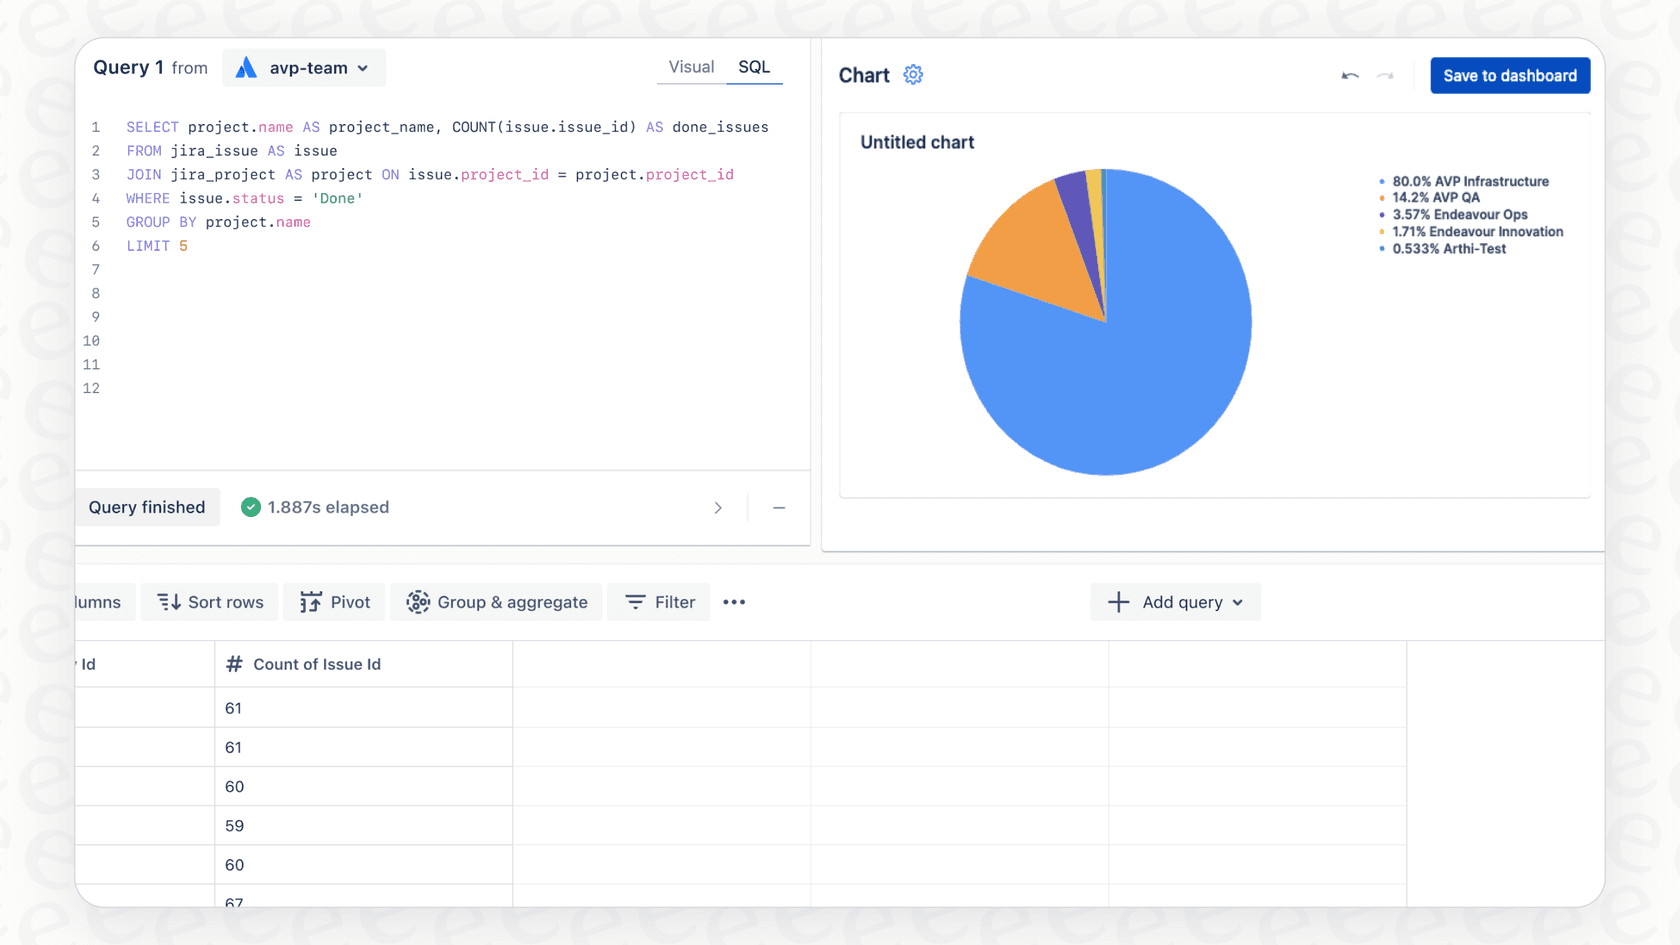
Instantly understand project health without knowing SQL
One of the biggest wins here is that it makes data analysis less intimidating for everyone. Team leads, project managers, and other folks who aren't data wizards can get quick summaries of key metrics without having to write complex JQL or SQL queries.
For instance, a support manager can get a quick text summary of a "tickets resolved over time" chart to see if the team is keeping up with the queue. A dev lead can use it on a "pull requests closed" chart to figure out if a new process is speeding things up or slowing them down.
You can also create charts just by asking for them. Some handy prompts you could try are:
-
"Show me work items by priority and status"
-
"Pie chart of all my work items by assignee"
-
"Work items resolved over time"
This natural language approach means anyone on the team can start digging into the data without needing a special skillset.
Speed up your reporting and data visuals
The time savings can be a big deal. Instead of spending an hour exporting data to a spreadsheet and messing with chart settings, you can just ask the AI to show you what you want to see.
This makes it much faster to build dashboards for team meetings, stakeholder updates, and performance reviews. The AI uses the dashboard title, chart title, and column names to understand the context, which has a nice side effect: it encourages you to be clearer with your naming conventions. When you know an AI is trying to make sense of your chart titles, you’re less likely to leave them as "Chart 2."
The limitations: Staying inside one ecosystem
While Atlassian Intelligence is pretty smart within its own environment, its usefulness starts to fade the second your work involves other tools. And let's be honest, whose work doesn't these days? This is where a single-platform approach starts to show its weaknesses.
Your data lives in more than just Atlassian
The reality for most companies is that work is spread all over the place. A support team’s information might be in Jira Service Management, but it's also in a help desk like Zendesk or Freshdesk. Product documentation might start in Confluence, but you’ve probably got tons of drafts and notes in Google Docs and Notion, too. And customer conversations are happening live in Slack and Microsoft Teams.
Here’s the fundamental problem: Atlassian Intelligence Chart Insights can't see any of that outside data. It can tell you about ticket trends in Jira, but it can't connect the dots to customer satisfaction scores from your support platform or questions coming in through your Shopify store. You end up with a siloed, incomplete picture of what’s really going on.
From passive insights to getting things done
The insights the tool generates are useful, but they're often just a starting point. The AI might tell you, "There's been a 30% spike in bug reports this week." That's good to know, but what’s next? A person still has to go investigate that spike, create a high-priority Jira ticket, and ping the right engineering team. The insight kicks off the work; it doesn't finish it.
What if the AI could not only spot the trend but also automatically create a high-priority Jira ticket, pull up similar past incidents from your help desk, and draft a summary for the engineering channel in Slack? This is the gap between telling you what happened and actually doing something about it. Even Atlassian notes that its AI-generated information can vary in quality and accuracy, which might make you think twice before building automated actions on top of it.
A unified AI platform for truly actionable insights
The answer to these limitations is an AI platform that can connect to all your tools and turn insights into action. This is where a tool like eesel AI goes beyond what a platform-specific tool can do.
Unify all your knowledge, not just one company's
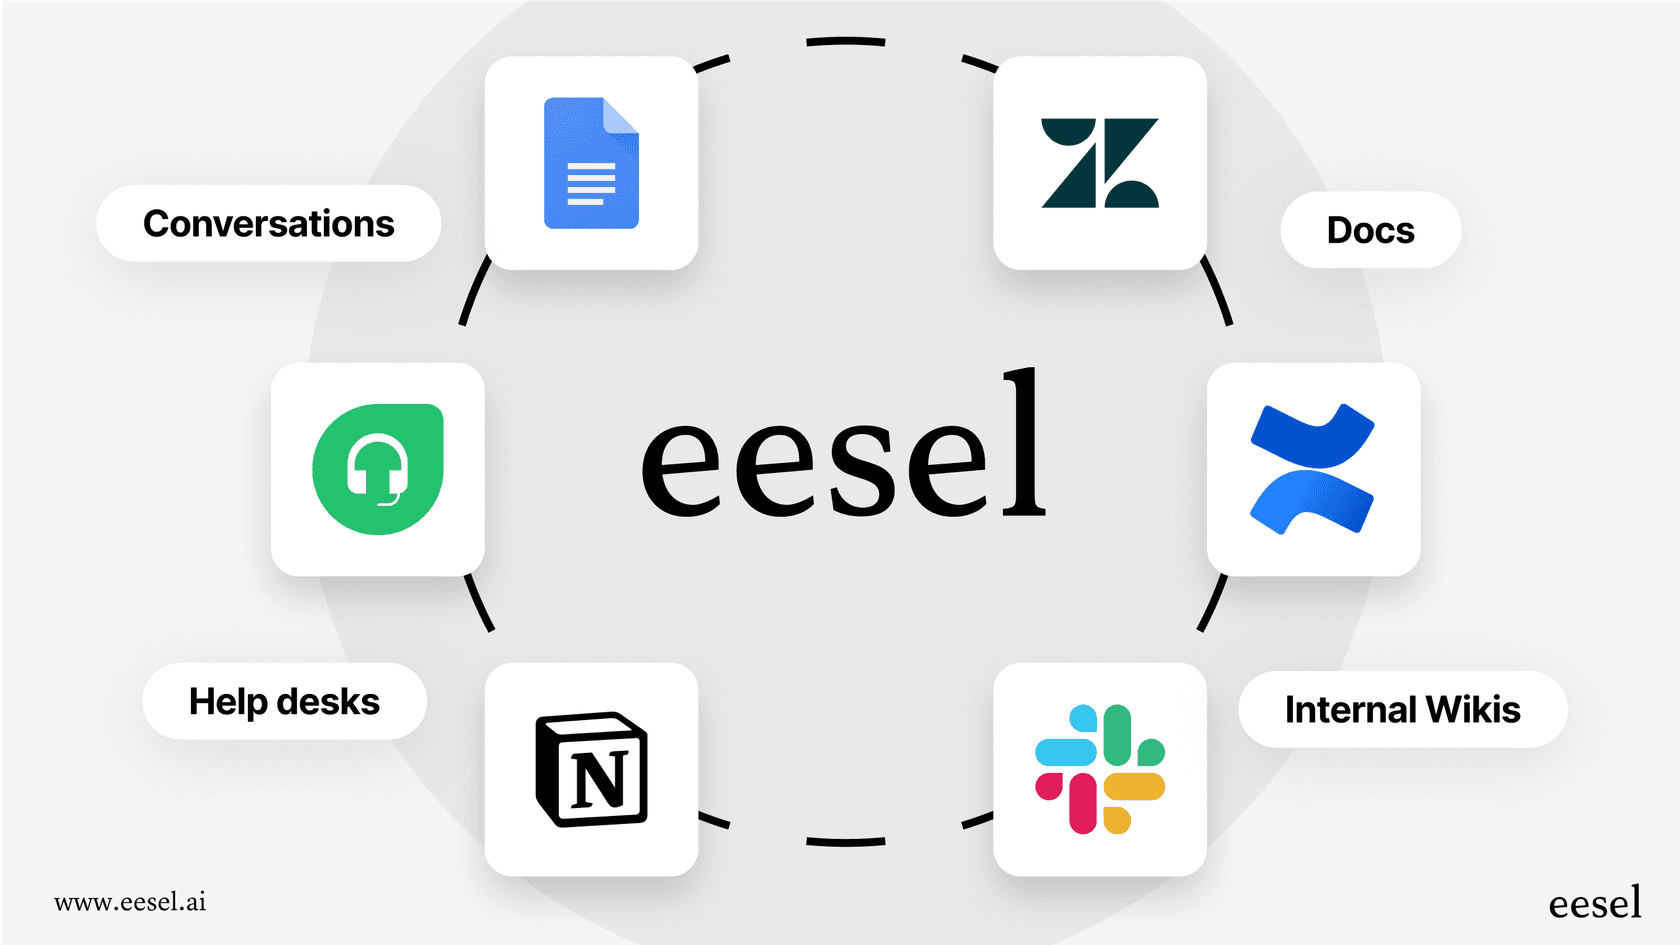
Unlike tools locked into a single ecosystem, eesel AI integrates with your entire company knowledge base. It connects to Atlassian products like Confluence and Jira, but it also pulls in information from over 100 other places, including help desks like Zendesk and Intercom, chat tools like Slack, and document hubs like Google Docs.
The advantage here is that you get insights based on a complete view of your business. An AI that has learned from your past Zendesk tickets, internal Confluence guides, and recent Slack discussions can give much richer answers and take smarter actions than one that only sees a small piece of the puzzle.
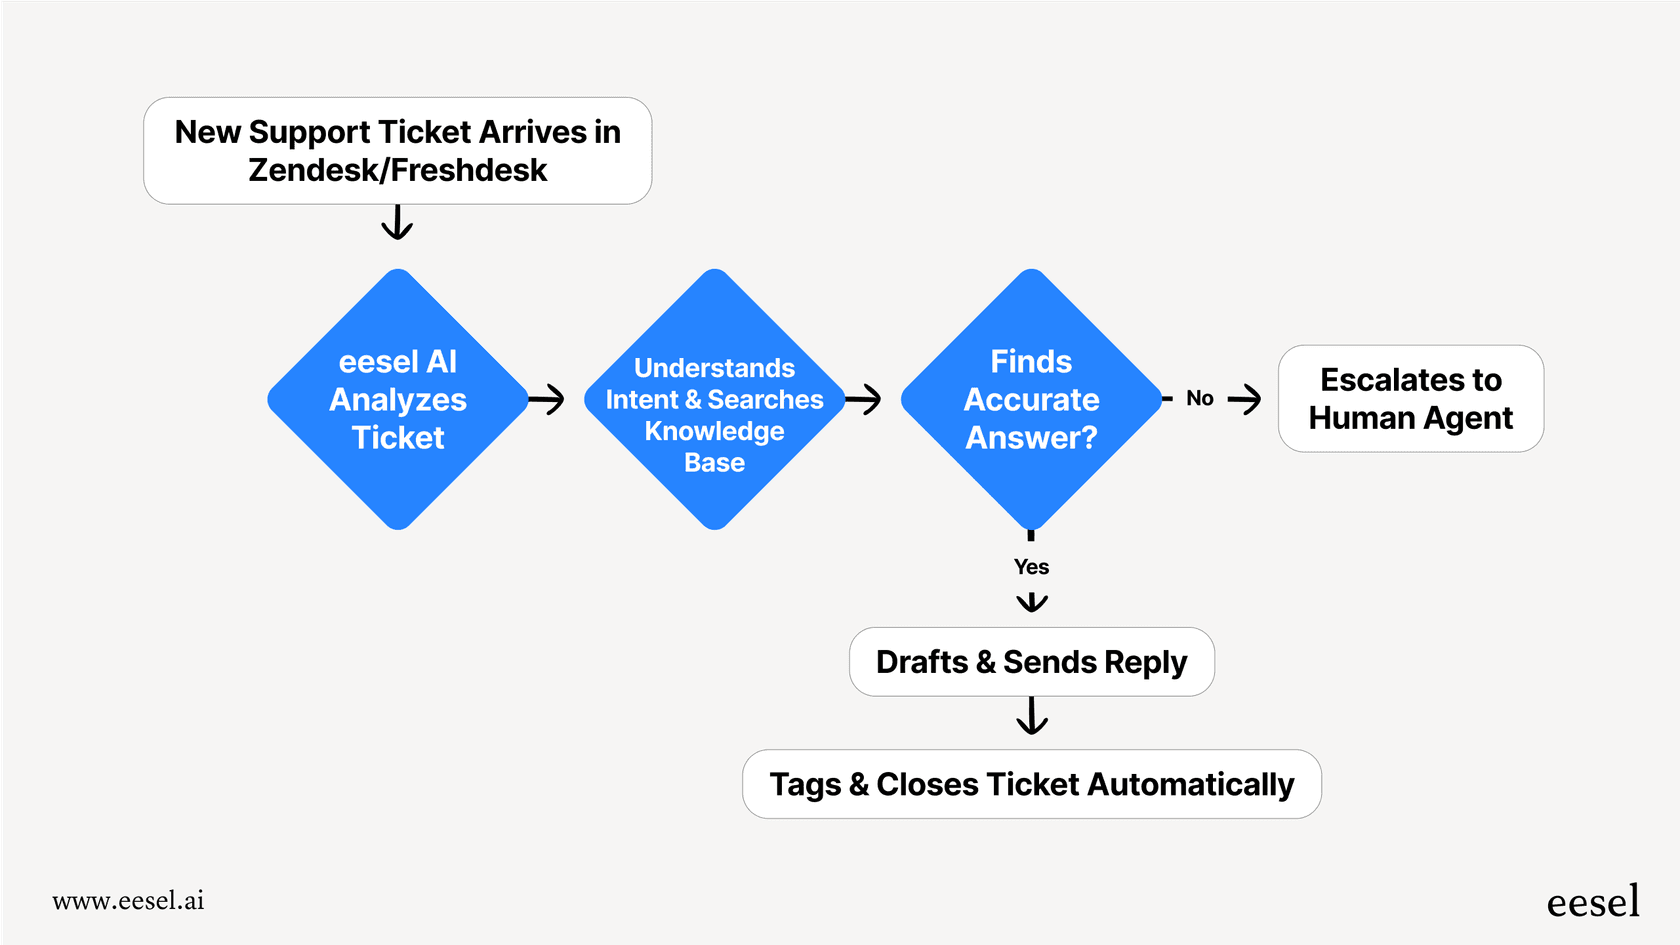
Automate workflows with a customizable engine
eesel AI is built to bridge that gap between insight and action. It doesn't just surface information; its AI Agents can take direct action based on what they find.
Here’s a quick comparison of what that looks like in practice:
-
Atlassian Intelligence: "Identifies that 20% of tickets are about password resets."
-
eesel AI: Identifies the trend and automatically resolves new password reset tickets by guiding the user through the process, which frees up your team's time.
With eesel AI's powerful and self-serve workflow engine, you’re in the driver's seat. You can decide exactly which tickets get automated, what the AI's personality and tone should be, and what custom actions it can take, like looking up order info in Shopify or triaging tickets with specific tags.
Go live in minutes with a confident simulation
Getting Atlassian Intelligence up and running often requires an admin to enable it on specific paid plans. eesel AI, on the other hand, is designed for you to get started yourself. You can connect your help desk and other tools and be live in a matter of minutes, no sales call required.
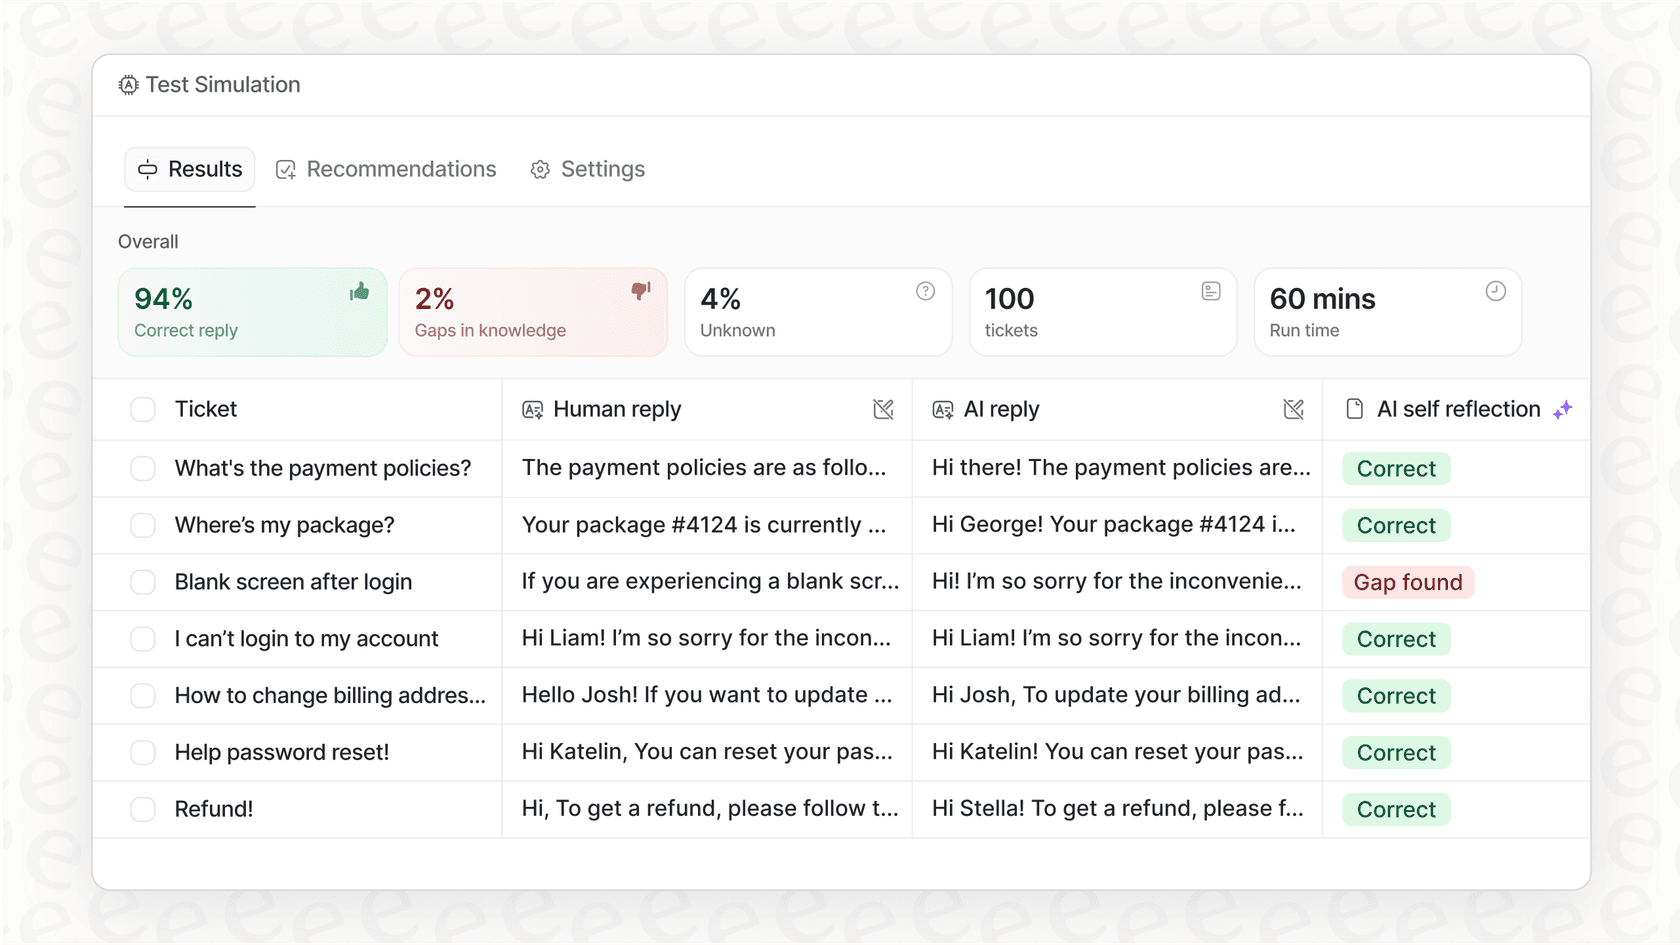
Even better, you can use its simulation mode to test your AI setup on thousands of your past tickets. This shows you exactly how it will perform, what kinds of questions it can resolve, and what your potential cost savings look like, all before it ever talks to a real customer. It’s a completely risk-free way to roll out automation.
Atlassian Intelligence Chart Insights pricing
Atlassian Intelligence isn’t something you can buy on its own. Its features, including Chart Insights, are bundled into Atlassian's pricier cloud plans. To get access, you'll generally need to be on a Premium or Enterprise plan for your Atlassian products.
This means that unlocking these AI insights requires a pretty serious investment across your entire Atlassian suite. Here's a rough idea of what it costs to get in the door, keeping in mind that these prices are per user or agent and can add up fast.
| Product | Premium Plan (Starts at) | Enterprise Plan (Starts at) |
|---|---|---|
| Jira Software | $16.00 USD / user / month | Contact Sales |
| Confluence | $11.00 USD / user / month | Contact Sales |
| Jira Service Management | $52.00 USD / agent / month | Contact Sales |
Move beyond charts to automated action
Atlassian Intelligence Chart Insights is a genuinely useful feature for any team that works heavily within the Atlassian ecosystem. It makes data easier to digest and helps you get a quick read on project health.
But its vision is limited to Atlassian data, and its insights tend to be more descriptive than actionable. Real operational efficiency comes from an AI that can see across all your tools and then automate work based on what it learns. To break down those data silos and turn insights into actual automation, you need a unified platform that can connect your entire tech stack.
eesel AI provides that solution by giving you full control over your automation and letting you get started in minutes. Try eesel AI for free and see for yourself how a truly connected AI can change the way you work.
Frequently asked questions
Atlassian Intelligence Chart Insights is an AI feature within Atlassian products like Atlassian Analytics and Home Dashboards. Its primary role is to automatically analyze data in charts, identify trends, and provide simple summaries of your team's performance.
Team leads, project managers, and anyone who needs quick insights into project health without writing complex queries will find Atlassian Intelligence Chart Insights most useful. It simplifies data analysis for non-data experts.
No, Atlassian Intelligence Chart Insights is limited to data within the Atlassian ecosystem. It cannot connect to or analyze information from external tools, leading to a siloed view of your company's data.
Atlassian Intelligence Chart Insights helps instantly understand project health without SQL knowledge and speeds up reporting. It translates complex charts into plain English summaries and allows users to generate charts using natural language prompts.
To access Atlassian Intelligence Chart Insights, your company generally needs to be on a Premium or Enterprise cloud plan for your Atlassian products like Jira Software, Confluence, or Jira Service Management. It's not available as a standalone purchase.
Atlassian Intelligence Chart Insights primarily provides descriptive insights, pointing out trends or anomalies. It surfaces "what happened," but a human is still required to take subsequent actions or investigations based on those insights.
Share this article

Article by
Kenneth Pangan
Writer and marketer for over ten years, Kenneth Pangan splits his time between history, politics, and art with plenty of interruptions from his dogs demanding attention.