How to use the Zendesk Explore messaging dataset: A complete guide for 2026
Stevia Putri
Last edited February 26, 2026
If you're running customer support through Zendesk messaging channels, you've access to a goldmine of data. The Zendesk Explore messaging dataset contains detailed metrics about every conversation, response time, and customer interaction across web, mobile, and social messaging channels. The challenge isn't getting the data. It's knowing what to do with it.
This guide walks you through everything you need to know about the Zendesk Explore messaging dataset. You'll learn what metrics are available, how to build meaningful reports, and how to turn raw data into actionable insights that actually improve your support operations.
What is the Zendesk Explore messaging dataset?
The Zendesk Explore messaging dataset is a collection of metrics and attributes specifically designed for reporting on messaging conversations. It captures data from all your messaging channels including web widgets, mobile SDKs, WhatsApp, Facebook Messenger, and other social messaging platforms.
To access this dataset, you need Zendesk Suite Professional, Enterprise, or Enterprise Plus. There's one important limitation to know upfront: messaging data is only available from September 20, 2022 onwards. If you're looking for historical analysis beyond that date, you'll need to use the standard Support tickets dataset instead.

The messaging dataset sits alongside other Zendesk Explore datasets like Support tickets, Chat engagements, and Talk calls. What makes it distinct is its focus on asynchronous messaging conversations rather than real-time chat sessions or email tickets. This matters because messaging interactions have different patterns: customers might respond hours later, conversations can span multiple days, and the metrics that matter are different from traditional support channels.
Key metrics in the Zendesk Explore messaging dataset
The messaging dataset includes dozens of metrics, but most teams focus on a core set that reveals performance and customer experience. Let's break down the key categories.
Volume metrics
These tell you how much work is coming through your messaging channels:
- Messaging tickets: Total tickets created from messaging channels
- Solved messaging tickets: Tickets that have been resolved or closed
- One-touch messaging tickets: Tickets solved in the first interaction without going through Pending status
- Unsolved messaging tickets: Active tickets in any status except Solved or Closed
- Unreplied unsolved tickets: Tickets waiting for an agent response
The one-touch metric is particularly useful for messaging because it shows how many simple issues you're handling immediately. A high percentage here usually means your self-service or bot deflection is working well.
Time-based metrics
Response times are critical in messaging. Customers expect quick replies, and these metrics help you track performance:
- First reply time: Duration from ticket creation to first agent response (available in seconds, minutes, hours, and days)
- Requester wait time: Time between customer message and agent reply
- Agent wait time: Time between agent message and customer reply
- Business hours variants: All time metrics can be calculated using your configured business hours
The business hours variants are essential if you don't offer 24/7 support. They let you measure your team's actual performance during working hours, rather than being skewed by overnight delays.
Activity and satisfaction metrics
These metrics reveal conversation patterns and customer sentiment:
- Agent messages and replies: Count of agent communications
- Requester messages and replies: Count of customer communications
- Good/bad satisfaction tickets: CSAT ratings broken down by sentiment
- % Satisfaction score: Percentage of rated tickets marked as good
Messaging goal conversions dataset
Beyond the core messaging tickets dataset, Zendesk also offers a messaging goal conversions dataset. This tracks whether conversations achieved specific goals you have defined, like completing a purchase or resolving a technical issue. It is useful for measuring outcomes rather than just activity.
How to build your first messaging report
Creating a report in Zendesk Explore follows a straightforward process. Here's how to get started.
Step 1: Access the dataset
Navigate to the Reports library in Zendesk Explore and click "New report." From the dataset selection page, choose "Messaging tickets." This dataset is grouped with live chat datasets, so look for it in that section.

Step 2: Select metrics and attributes
Once the report builder opens, start by adding metrics. Click "Add" in the Metrics panel and select the metrics you want to track. For a first report, try:
- First reply time (minutes)
- Messaging tickets
- Solved messaging tickets
Next, add attributes to slice your data. Common choices include:
- Date: To see trends over time
- Channel: To compare web vs. mobile vs. social messaging
- Assignee: To see individual agent performance
You can place attributes in Columns, Rows, Explosions, or Filters depending on how you want to visualize the data.
Step 3: Configure and visualize
Choose a visualization type that makes sense for your data. Line charts work well for trends over time. Tables are good for detailed breakdowns. Bar charts make comparisons easy.
Set your date range and any filters you need. Then save your report with a descriptive name. Reports don't auto-save, so remember to click Save before navigating away.
Once saved, you can add the report to a dashboard for easy access and sharing with your team.
Common reporting use cases for the Zendesk Explore messaging dataset
Now that you know how to build reports, here are three practical use cases that most support teams find valuable.
Tracking first reply time performance
First reply time is often the first impression customers have of your support quality. For messaging, customers typically expect faster responses than email but are more patient than with live chat.
To track this, create a report with:
- Metric: First reply time (minutes) with median or average aggregator
- Attribute: Date (week or month) in Columns
- Filter: Last 90 days
This shows your trend over time. You can add Channel to Rows to see which messaging platforms need attention. For a deeper dive on improving first reply times, check out our guide on reporting on first reply time for messaging tickets.
Monitoring agent workload and efficiency
Understanding how work is distributed helps with staffing decisions and identifies training needs.
Build a report with:
- Metric: Messaging tickets
- Attribute: Assignee in Rows
- Filter: Current month, Solved status
This shows tickets solved per agent. You can add more metrics like "One-touch messaging tickets" to see efficiency rates. For a fuller picture of agent contribution, consider combining this with data from the Ticket updates dataset, which shows internal activity that might not result in ticket solves.
Measuring customer satisfaction by channel
Not all messaging channels perform equally. WhatsApp conversations might have different satisfaction patterns than web widget chats.
Create a report with:
- Metric: % Satisfaction score
- Attribute: Channel in Columns
- Filter: Rated satisfaction tickets only
This reveals which channels are delivering the best experience. If you see significant differences, investigate whether it's a channel-specific issue (like mobile formatting) or a topic-specific pattern (certain channels being used for different types of issues).
Zendesk Explore messaging dataset vs. Chat dataset: When to use each
A common source of confusion is the difference between the messaging dataset and the live chat dataset. They are related but measure different things.
The messaging dataset covers asynchronous conversations. These can span hours or days. Customers can leave and return. The conversation persists. Metrics focus on ticket-level outcomes like resolution time and satisfaction.
The Chat dataset covers real-time sessions. These are synchronous conversations where both parties are active. Metrics focus on session-level activity like chat duration, concurrent chats, and engagement time.
Use the messaging dataset when:
- You want ticket-level analytics
- You are analyzing resolution times and outcomes
- You need to compare messaging with email tickets
Use the Chat dataset when:
- You are analyzing real-time agent performance
- You need to understand concurrent chat handling
- You are measuring live engagement metrics
Limitations and considerations
Before you dive deep into reporting, keep these limitations in mind.
Data availability: As mentioned, messaging data only goes back to September 20, 2022. If your business needs longer-term trend analysis, you'll hit a wall.
Plan requirements: Custom reporting requires Explore Professional, which comes with Suite Professional plans or higher. The lower-tier plans only include prebuilt dashboards.
Learning curve: The report builder is powerful but not intuitive. New users often struggle with understanding the difference between metrics and attributes, or how filters interact with visualizations.
Metric differences: Some metrics that seem similar across datasets actually calculate differently. For example, "First reply time" in the Support tickets dataset considers any public comment, while the messaging dataset version is optimized for messaging conversation patterns.
Social messaging exclusions: The live dashboard doesn't include data from social messaging channels like WhatsApp or Facebook Messenger. For those, you need to use historical reports.
Going beyond Zendesk Explore: Simpler reporting with eesel AI
Zendesk Explore is powerful, but it's not for everyone. The learning curve is real. Building a simple report can take hours the first time. And getting from "I have a question" to "I have an answer" often requires navigating multiple screens and understanding dataset structures.
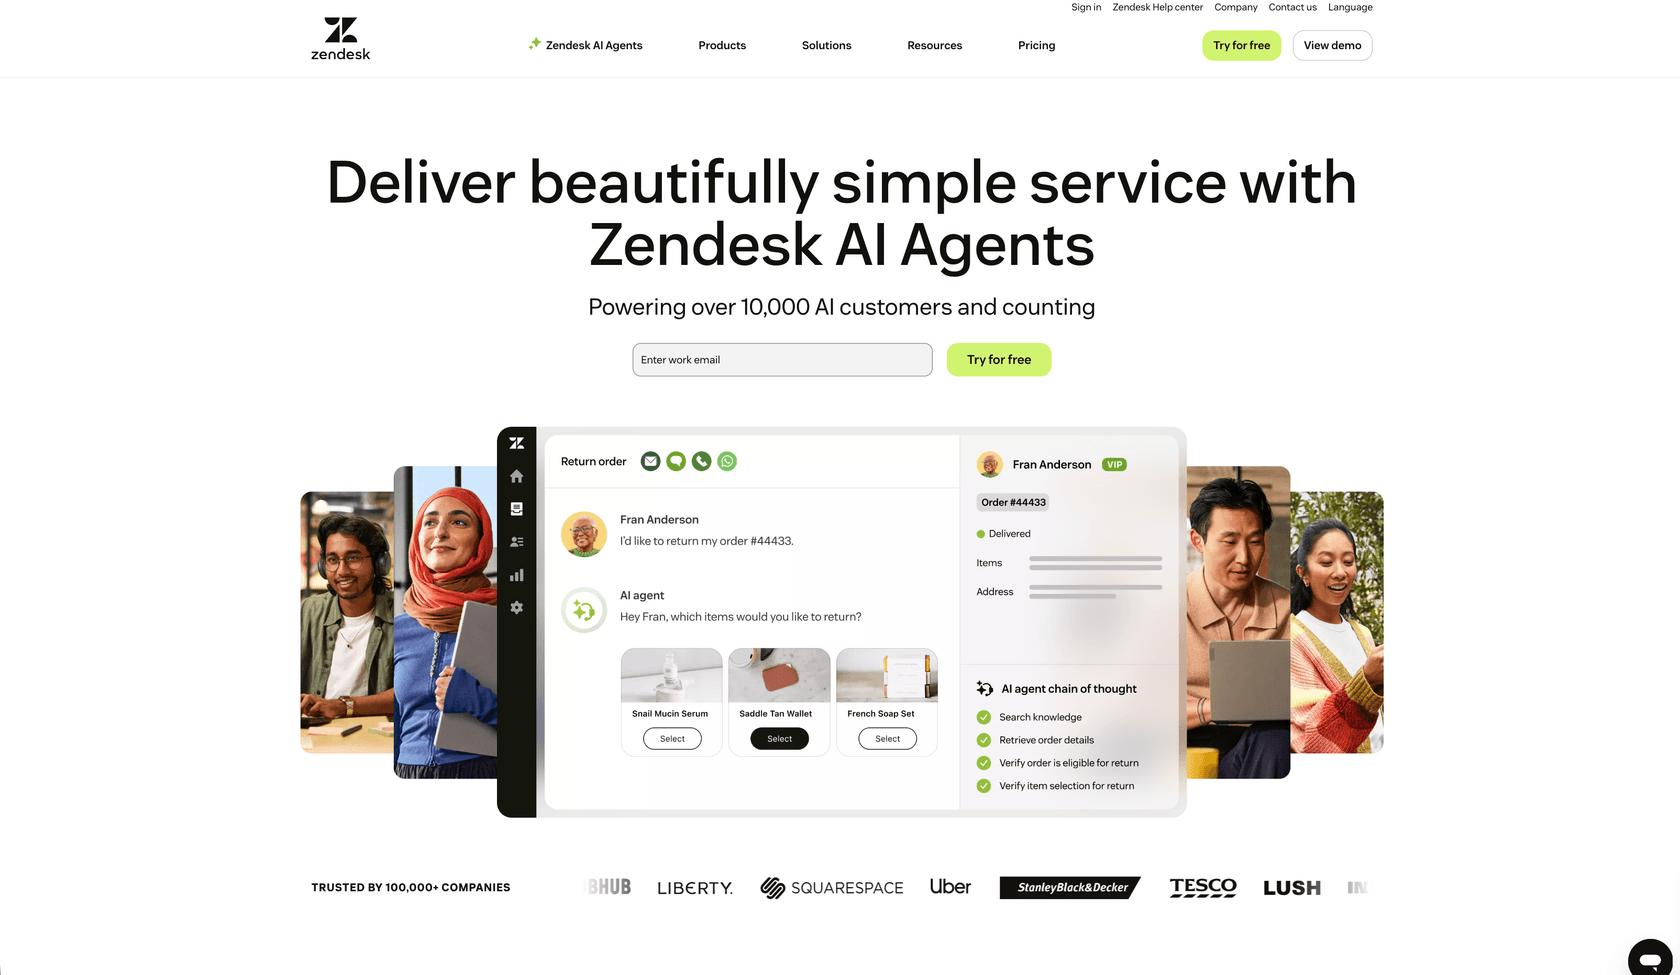
This is where we can help. At eesel AI, we have built AI-powered tools that complement Zendesk and make analytics more accessible.
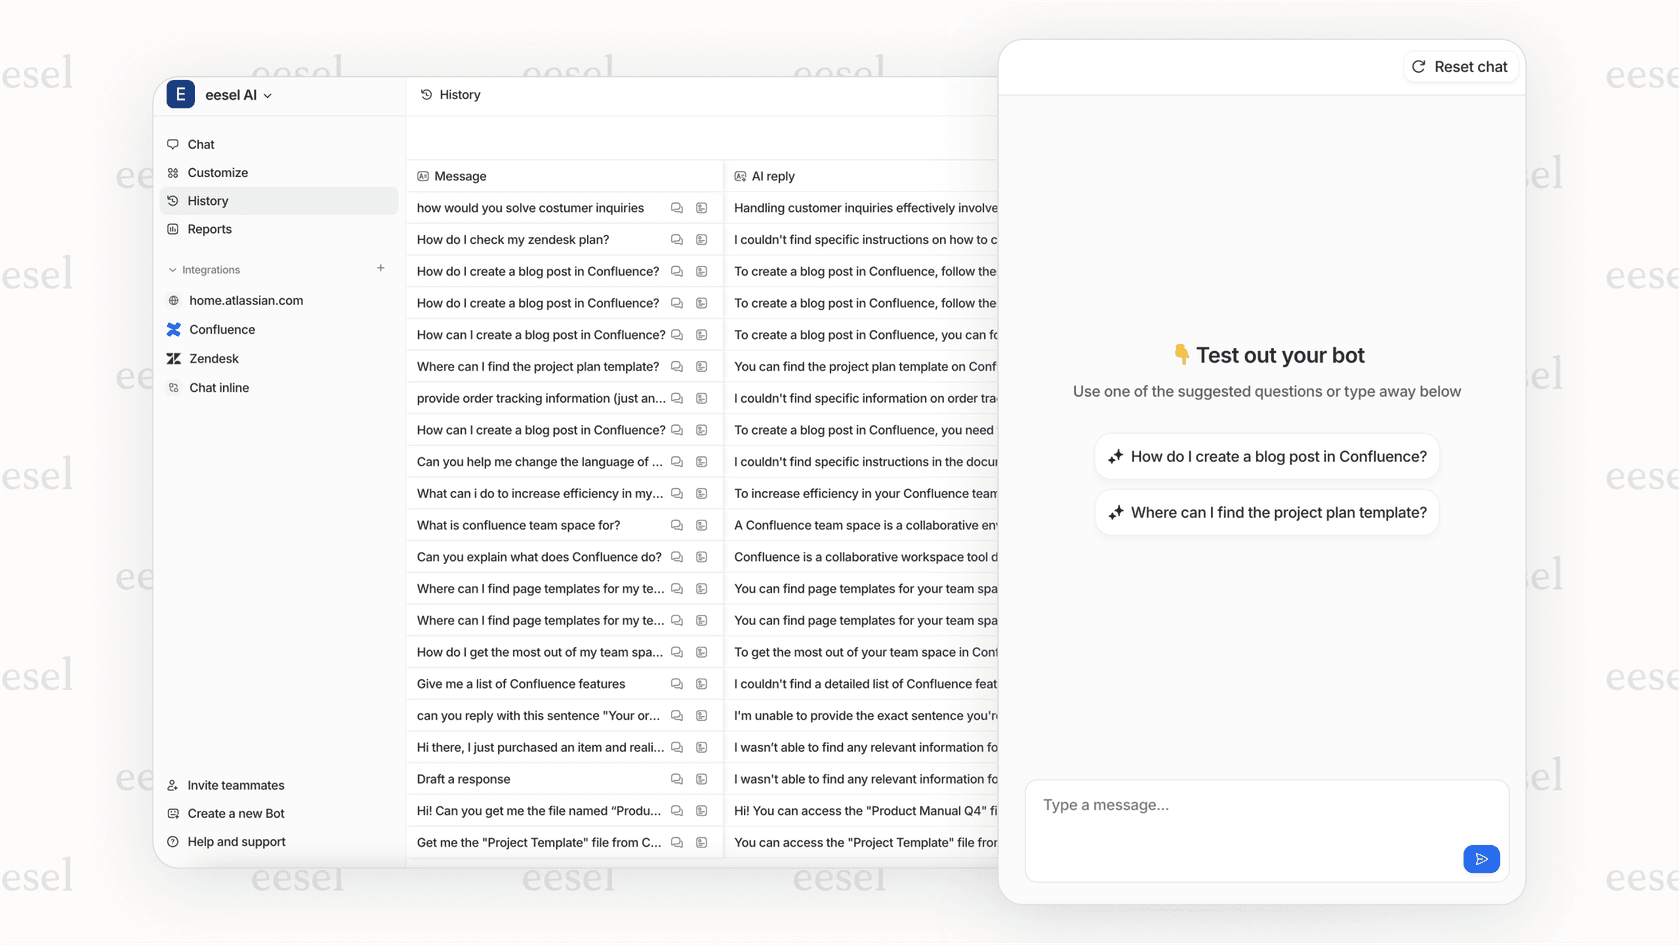
Our AI Agent can handle common messaging queries automatically, reducing your ticket volume and improving first reply times without requiring complex reports to track it. Our AI Copilot drafts responses for your agents, helping them reply faster and more consistently.
Instead of spending hours building reports to understand what's happening, you get immediate insights into how AI is helping your team perform. We integrate directly with Zendesk, so setup takes minutes, not days.
If you're finding Zendesk Explore overwhelming, or if you want to improve your messaging metrics without hiring a data analyst, check out our pricing and see how we can help.
Start making better decisions with your Zendesk Explore messaging dataset
The Zendesk Explore messaging dataset gives you visibility into one of your most important support channels. Start with simple reports tracking volume and first reply time. As you get comfortable, add more sophisticated analysis like channel comparisons and agent efficiency metrics.
Remember that data is only valuable if you act on it. Set a regular cadence for reviewing your messaging reports. Look for trends, not just snapshots. And when you find insights, share them with your team so everyone understands what good looks like.
If you're ready to go beyond basic reporting and start using AI to improve your messaging support, we're here to help. Try eesel AI and see how much simpler Zendesk analytics can be.
Frequently Asked Questions
Share this article

Article by
Stevia Putri
Stevia Putri is a marketing generalist at eesel AI, where she helps turn powerful AI tools into stories that resonate. She’s driven by curiosity, clarity, and the human side of technology.