How to use the Zendesk Explore ticket brand attribute: A complete guide
Stevia Putri
Last edited February 26, 2026
If you're managing support across multiple brands in Zendesk, you need visibility into how each brand performs. The Ticket Brand attribute in Zendesk Explore lets you segment your reports by brand, so you can see which ones generate the most tickets, which have the longest resolution times, and where you might need to allocate more resources.
In this guide, I'll walk you through exactly what the Ticket Brand attribute is, how to use it in your reports, and some practical ways to analyze your multi-brand support data. I'll also share a simpler alternative if you find Zendesk Explore's complexity frustrating.
What is the Ticket Brand attribute?
The Ticket Brand attribute is a standard field in Zendesk Explore that identifies which brand a ticket belongs to. In Zendesk's multi-brand setup, you can run multiple support operations from a single account, each with its own branding, email addresses, and help centers. The Ticket Brand attribute lets you filter and segment your reports based on these different brands.
You'll find this attribute in two main datasets:
- Tickets dataset: Shows the current brand assigned to a ticket
- Updates history dataset: Tracks brand changes over time as "Update ticket brand"
This distinction matters if you rebrand tickets or move them between brands. The Tickets dataset shows you the current state, while Updates history lets you see how tickets moved between brands historically.
What you'll need
Before you can use the Ticket Brand attribute, make sure you have:
- Zendesk Support Professional or Enterprise plan (multi-brand isn't available on lower tiers)
- Explore Professional or Enterprise (the attribute won't appear in basic reporting)
- Multi-brand feature enabled in your Zendesk account settings
- Editor or Admin permissions in Explore to create and save reports
If you're missing any of these, you'll need to upgrade your plan or request permissions from your account admin.
How to create a report using the Zendesk Explore attribute ticket brand
Let's walk through building a basic report that segments ticket volume by brand. This is one of the most common use cases, and once you understand the process, you can adapt it for other metrics.
Step 1: Create a new report in Explore
Start by navigating to the Reports library in Zendesk Explore. Click New report, then select Support from the dataset options, followed by Support - Tickets. This dataset contains all your ticket data, including the Ticket Brand attribute.

Step 2: Add Ticket Brand to your report
Once your report opens, look for the Columns or Rows panel on the right side. Click Add, then scroll through the attributes list to find Ticket Brand. It's located under the Ticket attributes section.
Add Ticket Brand to either Columns or Rows, depending on how you want to visualize your data. For a simple table showing ticket counts by brand, add it to Rows.
Step 3: Add metrics to measure
Now add the metrics you want to analyze. Click Add under the Metrics panel and select relevant metrics like:
- Tickets (total count)
- Solved tickets
- First reply time (average)
- Full resolution time (average)
You can add multiple metrics to compare different aspects of performance across brands.

Step 4: Filter by specific brands (optional)
If you want to focus on specific brands rather than seeing all of them, add Ticket Brand as a filter. Click Add under the Filters panel, select Ticket Brand, then choose which brands to include or exclude.
Once your report looks good, click Save and give it a descriptive name like "Ticket Volume by Brand - Monthly."
Common use cases for Ticket Brand reporting
Now that you know how to build a basic report, let's look at some practical ways to use the Ticket Brand attribute.
Compare ticket volume across brands
The simplest use case is tracking which brands generate the most support requests. This helps you:
- Identify your highest-volume brands that might need more staff
- Spot seasonal trends specific to certain brands
- Compare growth rates between brands over time
Add Ticket created - Date as a column and set it to Month or Week to see trends over time.
Analyze performance by brand
Not all brands perform equally. Use Ticket Brand to segment key performance metrics:
- First reply time: Which brands wait longest for initial responses?
- Resolution time: Are certain brands taking longer to resolve?
- Satisfaction scores: Do customers of specific brands rate you differently?
This segmentation helps you identify brands that might need process improvements or more training for assigned agents.
Resource allocation planning
If you have agents dedicated to specific brands, Ticket Brand reporting helps you justify staffing decisions:
- Show ticket volume trends to support hiring requests
- Spot under-resourced brands with growing backlogs
- Balance agent workloads across brands
SLA compliance by brand
Different brands often have different SLA requirements. Create reports that track:
- Percentage of tickets meeting first reply SLAs by brand
- Percentage meeting resolution time SLAs by brand
- Breach rates and trends per brand
This helps you catch compliance issues early and address them before they become bigger problems.
Creating calculated attributes with Ticket Brand
Sometimes you need more than the standard Ticket Brand attribute. Zendesk Explore lets you create calculated attributes that group or categorize your brands in custom ways.
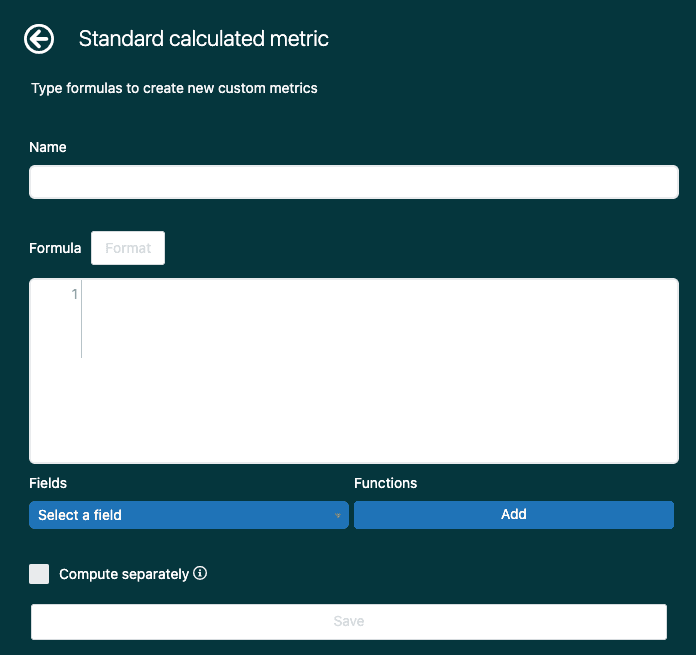
When to use standard calculated attributes
Consider creating a calculated attribute when you want to:
- Group brands by region (North America, Europe, Asia-Pacific)
- Categorize brands by tier (Premium, Standard, Basic)
- Separate internal brands from customer-facing brands
- Create rollup categories for reporting to executives
Example: Grouping brands by region
Here's a formula that groups your brands by geographic region:
IF ([Ticket brand]="Brand A" OR [Ticket brand]="Brand B") THEN "North America"
ELIF ([Ticket brand]="Brand C" OR [Ticket brand]="Brand D") THEN "Europe"
ELIF ([Ticket brand]="Brand E") THEN "Asia-Pacific"
ELSE "Other"
ENDIF
Replace the brand names with your actual brand names, and adjust the regions to match your business structure.
Tips for troubleshooting formula errors
If your calculated attribute isn't working:
- Check that brand names match exactly (case-sensitive)
- Ensure you're using the correct formula syntax for your language setting
- Test with a simple IF statement first, then add complexity
- Remember that calculated attributes can't reference other calculated attributes
Tips and best practices
After working with Ticket Brand reports for a while, here are some practices that help keep things organized:
Naming conventions for multi-brand reports
Use consistent naming so your team can find reports easily:
- Start with the brand name or "All Brands" for cross-brand reports
- Include the metric type (Volume, Performance, SLA)
- Add the time period if it's a recurring report
Example: "All Brands - Performance - Monthly"
How to handle re-branded tickets
When a ticket moves from one brand to another, Zendesk updates the Ticket Brand attribute. If you need to track the original brand for historical analysis, consider:
- Using custom fields to capture the original brand at ticket creation
- Creating snapshots of reports before major brand changes
- Using the Updates history dataset to see brand change events
Combining Ticket Brand with other attributes
The real power comes from combining Ticket Brand with other attributes:
- Ticket Brand + Ticket channel: See which channels drive volume for each brand
- Ticket Brand + Assignee: Track agent performance across brands they support
- Ticket Brand + Ticket tags: Analyze specific issue types by brand
Performance considerations for large datasets
If you have high ticket volumes, complex Ticket Brand reports can be slow to load:
- Add date filters to limit the time range
- Use data filters rather than result manipulations where possible
- Consider scheduling reports to run overnight rather than running them on-demand
Limitations and considerations
Before you build your entire reporting strategy around Ticket Brand, keep these limitations in mind:
Historical data limitations
Ticket Brand reflects the current brand assignment. If you need historical brand data (what brand a ticket belonged to at a specific point in time), use the Updates history dataset instead.
Ticket Brand vs. Update ticket brand
These two attributes sound similar but behave differently:
- Ticket Brand: Current brand of the ticket (in Tickets dataset)
- Update ticket brand: Brand after a specific update (in Updates history dataset)
Use the right one for your analysis, or you might get confusing results.
Data sync delays in Explore
Explore data isn't real-time. Depending on your plan, there can be delays of 1-24 hours between ticket updates and when they appear in reports. Don't rely on Explore for real-time operational decisions.
When to use custom fields instead
If you need to track brand-like categorizations that don't match your actual Zendesk brands, custom fields might be better than calculated attributes. They're easier to update and maintain over time.
A simpler alternative for multi-brand reporting
Working with Zendesk Explore can be frustrating. The interface is complex, formulas have a steep learning curve, and getting the exact report you want often requires trial and error. If you find yourself spending more time fighting with Explore than actually analyzing your data, there's a simpler approach.
We built eesel AI to make support analytics easier. Instead of navigating complex report builders and writing formulas, you connect eesel AI to your Zendesk account and ask questions in plain English. Want to know which brand had the longest resolution times last month? Just ask. Need to compare satisfaction scores across brands? Ask that too.
Here's how we handle multi-brand data differently:
- No formulas required: Ask questions naturally instead of building calculated attributes
- Automatic insights: We surface trends and anomalies across your brands automatically
- Faster setup: Connect in minutes instead of spending hours configuring reports
- Natural language queries: "Show me ticket volume by brand for Q4" instead of clicking through menus
If you're spending more time building reports than acting on insights, it might be worth exploring a different approach.
Start analyzing your multi-brand support data
The Ticket Brand attribute in Zendesk Explore gives you the segmentation you need to understand how different brands perform. Whether you're comparing volume, tracking SLAs, or planning resources, this attribute is the foundation of multi-brand reporting.
Here's what to remember:
- Ticket Brand is available in the Tickets and Updates history datasets
- You need Professional or Enterprise plans to access it
- Combine it with metrics and other attributes for richer analysis
- Calculated attributes let you create custom brand groupings
Start with a simple ticket volume report, then expand to more complex analyses as you get comfortable. And if Zendesk Explore feels like more trouble than it's worth, try eesel AI for a simpler way to get insights from your multi-brand support data.
Frequently Asked Questions
Share this article

Article by
Stevia Putri
Stevia Putri is a marketing generalist at eesel AI, where she helps turn powerful AI tools into stories that resonate. She’s driven by curiosity, clarity, and the human side of technology.