How to use the Zendesk Explore ticket channel attribute in 2026
Stevia Putri
Last edited February 26, 2026
Understanding where your support tickets come from is fundamental to running an efficient operation. Are most customers reaching out via email? Is your chat volume spiking? Are social media requests getting lost in the shuffle? The Ticket channel attribute in Zendesk Explore answers these questions by categorizing every ticket by how it entered your system.
This guide walks you through everything you need to know about using this attribute. You'll learn how to build basic reports, create more advanced visualizations, and even construct custom calculated attributes for specialized analysis. Whether you're new to Explore or looking to deepen your reporting capabilities, these steps will help you extract meaningful insights from your channel data.
While Zendesk Explore requires manual report building, tools like eesel AI offer an alternative approach. Instead of configuring attributes and metrics, you simply ask questions in plain English and get instant insights. But let's start with the fundamentals of Zendesk's native tooling.
What is the Ticket channel attribute in Zendesk Explore?
The Ticket channel attribute is a dimension available in Zendesk Explore's Support datasets. It categorizes tickets based on the communication channel through which they were created. Think of it as a label that tells you "this ticket came from email" or "this ticket started as a chat conversation."
Available channels depend on which Zendesk products and integrations you've configured. Common values include:
- Email tickets created via email requests
- Web tickets from web forms, the Web Widget, or agent-created tickets
- Chat tickets originating from Zendesk Chat sessions
- API tickets generated through the Zendesk API or third-party integrations
- Voice tickets from phone calls and voicemails
- Messaging tickets from web messaging and social messaging channels
- Social tickets from X (Twitter), Facebook posts, and other social platforms
- Mobile SDK tickets created through custom mobile applications
- Help center tickets from community posts and article comments
There's an important distinction to understand: the Ticket channel attribute shows where a ticket was created, while the Update channel attribute (available in the Updates history dataset) shows where each individual update came from. A follow-up ticket might show as "Web" in Ticket channel but "Closed ticket" in Update channel.
What you'll need
Before building reports with the Ticket channel attribute, ensure you have:
- Zendesk Explore Professional or Enterprise this attribute isn't available in Lite
- Editor or Admin permissions in Explore
- Active tickets in Zendesk Support you'll need data to analyze
- Basic familiarity with the Explore report builder knowing how to add metrics and attributes
If you're missing Explore access, your Zendesk admin can add you to Explore with appropriate permissions.
How to create a basic ticket channel report
Let's start with the simplest useful report: a breakdown of your ticket volume by channel. This shows you at a glance which channels drive the most support traffic.
Step 1: Open a new report
Navigate to the Explore product from your Zendesk admin menu. Click the reports icon, then select New report from the Reports library. On the dataset selection page, choose Support > Support - Tickets, then click Start report.
The report builder opens with an empty canvas. You'll see panels for Metrics, Columns, Rows, and Explosions on the left side.

Step 2: Add the Tickets metric
Every report needs at least one metric (what you're measuring). In the Metrics panel, click Add. From the list of available metrics, navigate to Tickets > Tickets, then click Apply.
You'll see COUNT(Tickets) appear in the Metrics panel, and Explore automatically displays the total count of tickets in your account in the main visualization area.
Step 3: Add the Ticket channel attribute
Now add the dimension that breaks down your data. In the Rows panel, click Add. Navigate to Ticket > Ticket channel, then click Apply.
Explore displays a table showing your ticket count broken down by each channel. You might see values like Email, Web, Chat, API, and Voice depending on your configuration.

Step 4: Customize your visualization
By default, Explore selects a visualization type it thinks works best. For channel breakdowns, a column or bar chart often works better than a table. Click the visualization type icon and experiment with different options.
You can also add date filters to focus on specific time periods. Click the filter icon to add date ranges or other filters to your report.
How to create a tickets by agent by channel report
Now let's build something more advanced: a report that shows which agents handle tickets from which channels. This helps you understand workload distribution and identify channel expertise.
Step 1: Set up the base report
Create a new report using the Support - Tickets dataset as before. Add the Tickets metric.

Step 2: Add agent and channel attributes
This report uses two attributes: one for columns and one for rows.
In the Columns panel, click Add. Navigate to Assignee > Assignee name, then click Apply.
In the Rows panel, click Add. Navigate to Ticket > Ticket channel, then click Apply.
You'll see a matrix showing agents across the top and channels down the side, with ticket counts in each cell.
Step 3: Configure the visualization
The default visualization might be hard to read with many agents. Click the visualization type icon and select Bar. Then click the chart configuration icon, select Chart, and enable the Stacked setting.
This creates a stacked bar chart where each agent has one bar, divided into colored segments representing their ticket volume by channel. It's an effective way to spot patterns, like which agents specialize in chat versus email.
How to build custom calculated attributes with Ticket channel
Standard reports are useful, but sometimes you need something more specific. Standard calculated attributes let you create custom logic using the Ticket channel field.
Understanding calculated attributes
Calculated attributes use formulas to return custom values based on conditions. The most common structure uses IF/THEN/ENDIF logic:
IF [condition] THEN [value_if_true] ELSE [value_if_false] ENDIF
This lets you group channels, filter for specific values, or create entirely new categorizations.
Example: Filter for specific messaging channels
Let's say you want to report only on Instagram Direct messages. Create a new standard calculated metric:
- Click the Calculations menu (calculator icon) in the right sidebar
- Select Standard calculated metric
- Name it something descriptive like "Instagram Direct Tickets"
- Enter this formula:
IF [Ticket channel] = "Instagram Direct" THEN [Ticket ID] ENDIF
- Click Save
Now when you add this metric to a report, it only counts tickets from Instagram Direct. You can create similar metrics for WhatsApp, Facebook Messenger, or any other channel.
Example: Group channels by category
You might want to categorize channels as "Digital" (email, web, chat) versus "Voice" (phone calls). Create a standard calculated attribute:
- Open Calculations > Standard calculated attribute
- Name it "Channel Category"
- Enter a formula like:
IF [Ticket channel] = "Voice" OR [Ticket channel] = "Phone call (incoming)" OR [Ticket channel] = "Voicemail" THEN "Voice" ELSE "Digital" ENDIF
- Set Computed from to "Ticket channel"
- Click Save
Add this attribute to your report rows to see high-level channel categories instead of individual channels.
Common ticket channel values and their meanings
Here's a complete reference for how different entry points appear in Explore:
| Channel | Displayed As | Description |
|---|---|---|
| Tickets originating from email requests | ||
| Web form / Web Widget | Web | Tickets from Support web forms, the Web Widget, or agent-created tickets |
| Chat | Chat | Tickets created from Zendesk Chat sessions |
| API / Web service | Api | Tickets from the Zendesk API, integrations, automations, or rules |
| Phone call (incoming/outgoing) / Voicemail | Voice | Tickets originating from calls and voicemails |
| Messaging | Messaging | Tickets from web messaging conversations |
| Social messaging | WhatsApp, LINE, WeChat, Facebook Messenger, Twitter DM | Individual social messaging channels (requires Agent Workspace) |
| X/Twitter mention, DM, like | Tickets from X (formerly Twitter) activity | |
| Facebook message / post | Tickets from Facebook activity | |
| Mobile / Mobile SDK | Mobile / Mobile SDK | Tickets from Zendesk mobile apps or custom SDK implementations |
| Help Center post | Help center | Tickets created from community posts or article comments |
| System | System | Tickets created by Zendesk itself, such as imports |
| Closed ticket | Closed ticket | Follow-up tickets (only in Update channel attribute) |
| Side conversation | Side conversation | Tickets created from side conversation child tickets |
Tips and troubleshooting
Follow-up tickets showing as "Web"
When a customer replies to a closed ticket, creating a follow-up, the Ticket channel attribute shows "Web" regardless of how the original ticket was created. This is by design. If you need to track the original channel, use the Update channel attribute in the Updates history dataset, which will show "Closed ticket" for these cases.
API tickets with multiple origins
The "Api" channel groups several entry points: API calls, web services, ticket sharing, group changes, linked problems, rules, user changes, and merged tickets. If you need to distinguish between these, you'll need to use additional attributes or tags.
Using Ticket channel as a filter
You can use the Ticket channel attribute as a data filter in any report. Add it to the Filters panel, then select specific channels to include or exclude. This is useful for creating channel-specific dashboards.
Best practices for channel reporting
- Review channel distribution monthly to spot trends
- Compare resolution times across channels (some channels may require faster response)
- Track channel adoption after launching new support options
- Use channel data to inform staffing decisions
Using eesel AI for simpler channel analytics
Building reports in Zendesk Explore gives you flexibility, but it requires time and expertise. Every question means creating a new report, configuring attributes, and setting up visualizations.
eesel AI approaches analytics differently. Instead of manual report building, you connect your help desk and ask questions in plain English. "Show me ticket volume by channel for the last 30 days" or "Which agents handle the most chat tickets?" The AI generates answers instantly, complete with visualizations.
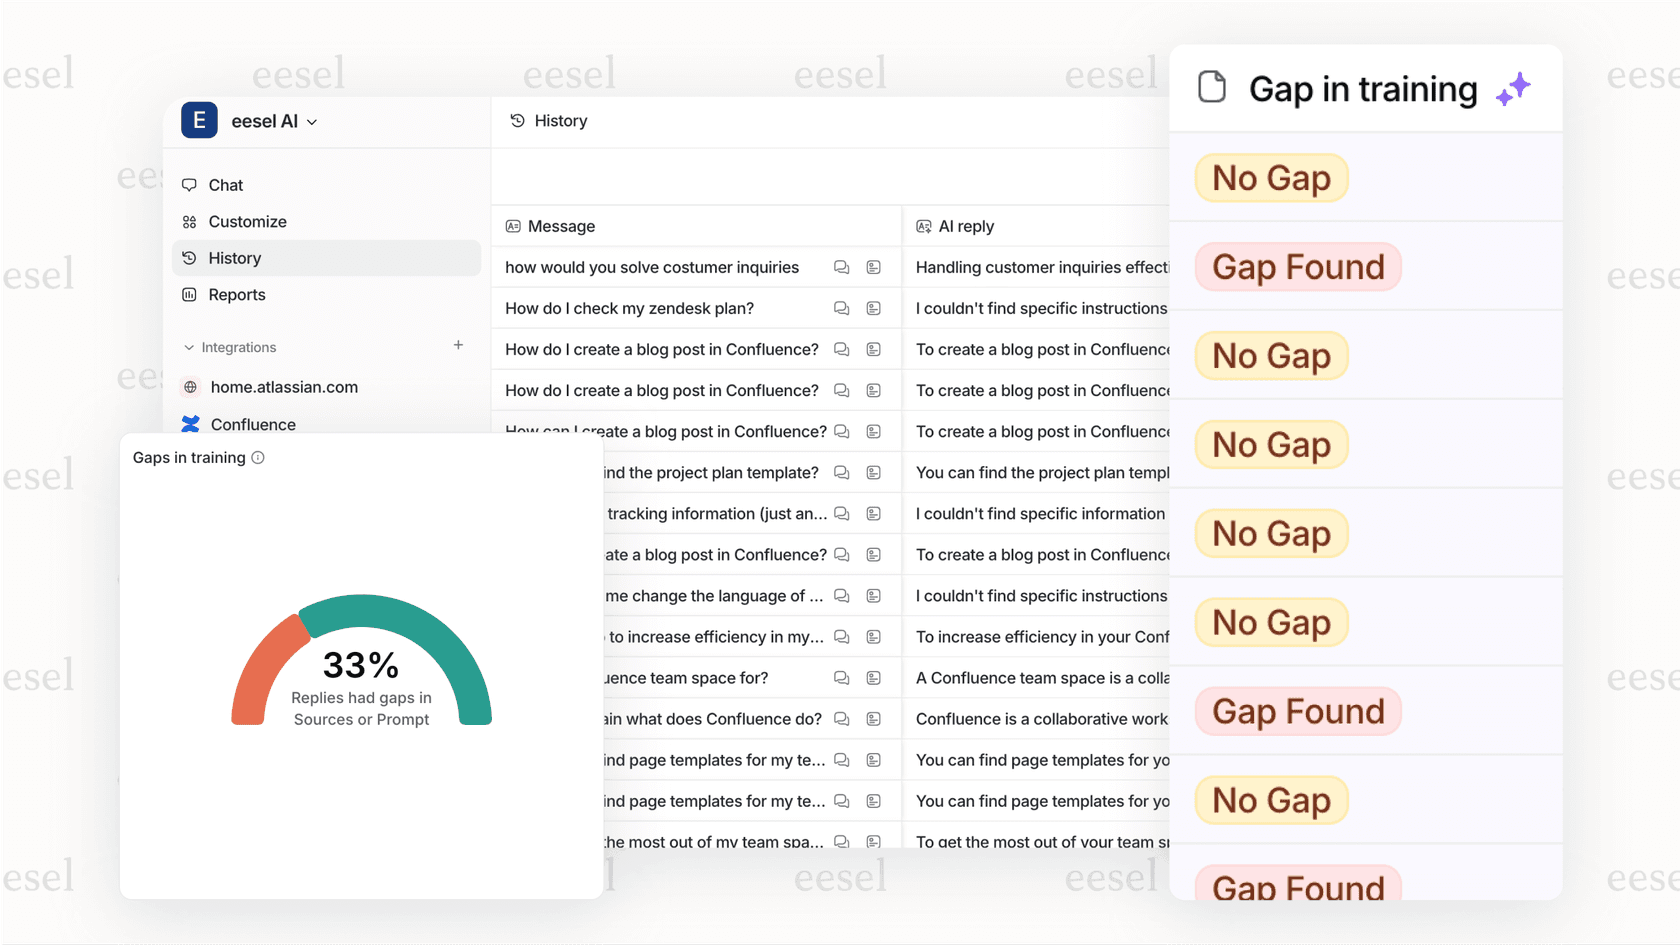
This is particularly useful for teams that need insights quickly without investing hours in report configuration. eesel AI also identifies trends automatically, flagging unusual channel spikes or shifts in volume that might indicate a product issue or marketing campaign impact.
If you find yourself spending more time building reports than analyzing them, it's worth considering whether an AI-powered approach fits your workflow better.
Start analyzing your support channels today
The Ticket channel attribute is one of the most useful dimensions in Zendesk Explore. It transforms raw ticket counts into actionable insights about how customers prefer to contact you. Start with the basic report recipe covered here, then experiment with calculated attributes as your needs grow more sophisticated.
Remember that channel analysis isn't just about counting tickets. It's about understanding customer behavior, optimizing resource allocation, and identifying opportunities to improve the support experience. A spike in chat volume might indicate your self-service content needs work. An increase in API tickets could signal integration issues.
The reports you build today will help you make better decisions tomorrow. And if the manual approach becomes a bottleneck, modern AI tools offer a faster path to the same insights.
Ready to simplify your support analytics? Try eesel AI and get instant insights from your help desk data without the manual report building. Or book a demo to see how AI-powered analytics can transform your support operations.
Frequently Asked Questions
Share this article

Article by
Stevia Putri
Stevia Putri is a marketing generalist at eesel AI, where she helps turn powerful AI tools into stories that resonate. She’s driven by curiosity, clarity, and the human side of technology.