How to use Zendesk Explore attribute priority: A complete guide
Stevia Putri
Last edited February 26, 2026
Not all support data is created equal. A ticket's current status tells you one thing. The complete history of how that ticket moved through your system tells you something entirely different. This is where understanding attributes in Zendesk Explore becomes essential.
If you have ever tried to build a report showing priority changes over time, you have probably hit a wall. The standard Tickets dataset only shows the current priority, not what it was yesterday or last week. To track how tickets evolve, you need to understand which attributes to use and when.
This guide breaks down how Zendesk Explore attributes work, with specific focus on tracking priority changes and building calculated attributes for better reporting. Whether you are troubleshooting SLA breaches or analyzing team performance, these techniques will help you get more from your data.
Tools like eesel AI can complement this work by automating ticket prioritization based on content and context, reducing the manual effort required to keep priorities accurate.
What are attributes in Zendesk Explore?
Attributes are the dimensions you use to group, filter, and organize your support data. Think of them as the labels that help you slice your reports: ticket status, assignee name, creation date, priority level. Without attributes, you are just looking at raw numbers without context.
Attributes differ from metrics. Metrics are the numbers you measure: ticket count, resolution time, reply count. Attributes are how you break those numbers down. One metric (total tickets) can be analyzed through dozens of attributes (by group, by channel, by priority, by month).
Types of attributes in Zendesk Explore
Zendesk organizes attributes into three categories:
-
Default attributes come built into each dataset. These include standard fields like Ticket ID, Status, Priority, and Assignee. They are ready to use immediately.
-
Custom attributes are fields you have created in your Zendesk instance. If you have added custom ticket fields, they appear as attributes in the relevant datasets.
-
Calculated attributes are formulas you build using Zendesk's calculation language. These let you combine, transform, or categorize existing attributes into new dimensions.
Each dataset in Zendesk Explore contains its own set of attributes. The Tickets dataset has attributes related to ticket properties. The Updates history dataset has attributes about changes made to tickets. Choosing the right dataset is the first step to getting the answers you need.
Understanding the Priority attribute in Zendesk
Priority in Zendesk is a system field with four levels: Low, Normal, High, and Urgent. It affects how tickets are routed, which SLAs apply, and how your team prioritizes work. Unlike custom fields, you cannot delete the Priority field, though you can customize how it behaves.
The challenge with priority reporting is that most datasets only show the current value. If a ticket was marked Urgent yesterday but is Normal today, a standard report will only show Normal. This creates blind spots when you are trying to analyze escalation patterns or SLA compliance.
How priority affects your reporting
Priority drives several key workflows in Zendesk:
-
SLA policies typically have different targets based on priority. Urgent tickets might need a first reply in 15 minutes, while Low priority tickets get 24 hours.
-
Routing rules often use priority to determine which group or agent receives a ticket. High priority issues might skip tier one and go straight to specialists.
-
Dashboard filtering lets managers focus on urgent issues during standups or incident response.
When priority changes, these workflows adjust automatically. But tracking those changes historically requires the right dataset and attributes.
Using the Updates history dataset to track priority changes
The Updates history dataset is the only place in Zendesk Explore that tracks field changes over time. While the Tickets dataset gives you a snapshot of current values, Updates history captures every modification: who made it, when they made it, and what changed.
This dataset is essential for answering questions like:
- How many tickets had their priority downgraded last month?
- Which agents are escalating tickets most frequently?
- How long do tickets stay at Urgent priority before resolution?
Key attributes for tracking priority
To build a priority change report, you will work with these attributes:
-
Changes - Field name identifies which field was modified. Filter this to "priority" to see only priority changes.
-
Changes - Previous value shows what the priority was before the change.
-
Changes - New value shows what the priority became after the change.
-
Update - Timestamp tells you exactly when the change occurred.
-
Updater name identifies who made the change.
Building your first priority change report
Here is how to create a report showing priority changes:
- Open Zendesk Explore and create a new query
- Select the Support: Updates history dataset
- Add a filter for Changes - Field name = "priority"
- In the Rows section, add: Ticket ID, Changes - Previous value, Changes - New value, Update - Date, Updater name
- Add Update ID as your metric with D_COUNT aggregation
This gives you a list of every priority change with full context. You can add additional filters for date ranges, specific groups, or updater roles to narrow the focus.
Tracking priority downgrades specifically
A common use case is identifying tickets that had their priority reduced. This can indicate scope changes, SLA manipulation, or simply tickets that were over-prioritized initially.
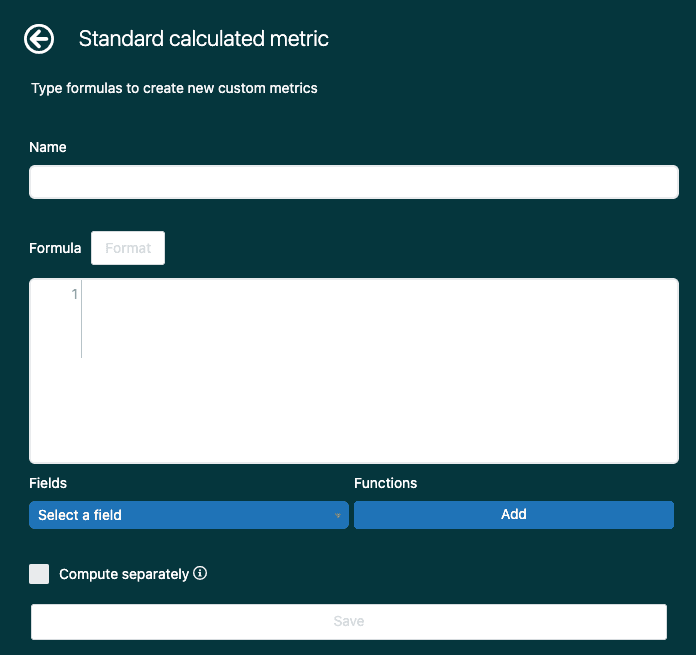
To track downgrades, create a standard calculated metric with this formula:
IF ([Changes - Field name] = "priority"
    AND [Changes - Previous value] != NULL
    AND [Changes - New value] != NULL
    AND [Changes - Previous value] != [Changes - New value]
    AND (
         ([Changes - Previous value] = "urgent" AND [Changes - New value] = "high") OR
         ([Changes - Previous value] = "high" AND [Changes - New value] = "normal") OR
         ([Changes - Previous value] = "normal" AND [Changes - New value] = "low")
        )
)
THEN [Update ID]
ENDIF
This formula captures only genuine downgrades, excluding priority increases or unchanged values. You can adjust the logic to match your specific reporting needs.
Creating calculated attributes for advanced reporting
Calculated attributes let you create custom dimensions that do not exist in your data by default. Using Zendesk's formula language, you can combine fields, apply conditional logic, and transform values into formats that make sense for your business.
When to use calculated attributes
Consider creating a calculated attribute when you need to:
- Combine multiple fields into one (like joining category and subcategory)
- Create buckets or groupings (like "Business Hours" vs "After Hours")
- Standardize inconsistent values (like normalizing email domains)
- Extract parts of text fields (like pulling the domain from an email address)
Joining attributes together
One of the most common uses for calculated attributes is joining two fields. This is useful when you want to filter by combinations that are not available as single attributes.
To create a year-month attribute for better date grouping:
STRING([Ticket created - Year])+" "+[Ticket created - Month]
To combine group and assignee for team-specific filtering:
[Ticket group]+" - "+[Assignee name]
To merge category and subcategory fields:
[Category]+" - "+[Subcategory]
Note that if any component of a joined attribute contains NULL, the entire result will be NULL. You may need to add error handling for incomplete data.
Conditional attributes
Conditional logic lets you create attributes that categorize tickets based on multiple criteria. This is powerful for building business-specific groupings.
To flag tickets created during business hours (assuming 9 AM to 5 PM):
IF ([Ticket created - Hour] >= 9 AND [Ticket created - Hour] <= 17)
THEN "Business Hours"
ELSE "After Hours"
ENDIF
To create priority buckets for simplified reporting:
IF ([Ticket priority] = "Urgent" OR [Ticket priority] = "High")
THEN "Critical"
ELSE "Standard"
ENDIF
To identify tickets with multiple reassignments:
IF (VALUE(Assignee stations) > 2)
THEN "High Touch"
ELIF (VALUE(Assignee stations) = 2)
THEN "Medium Touch"
ELSE "Low Touch"
ENDIF
Common attribute-related reporting challenges
Even with the right attributes, you will encounter issues. Here are the most common problems and how to solve them.
Handling NULL values
NULL values break joins and calculations. When combining attributes, always account for missing data:
IF ([Category] != NULL AND [Subcategory] != NULL)
THEN [Category]+" - "+[Subcategory]
ELIF ([Category] != NULL)
THEN [Category]+" - Unspecified"
ELSE "Uncategorized"
ENDIF
This ensures your reports show meaningful values instead of blank cells.
Attributes not appearing in the expected dataset
If you cannot find an attribute, check which dataset you are using. Custom fields only appear in datasets for the product where they were created. A ticket custom field will not appear in the Talk dataset, for example.
The Updates history dataset has a different set of attributes than the Tickets dataset. Fields like "Changes - Previous value" only exist in Updates history.
Sorting issues with joined attributes
Joined text attributes sort alphabetically, not chronologically. If you join year and month, "2025 January" will sort before "2025 February" but "2025 December" will sort before "2025 January" because "D" comes before "J".
To sort dates correctly, use numeric formatting:
STRING([Ticket created - Year])+"-"+DATE_FORMAT([Ticket created - Date],"MM")
This produces "2025-01", "2025-02", etc., which sort in the correct order.
Performance considerations
Complex calculated attributes can slow down report loading. If your reports are timing out:
- Simplify formulas by removing unnecessary conditions
- Pre-calculate values in custom fields when possible
- Filter your dataset early to reduce the number of rows being processed
- Break complex reports into multiple simpler queries
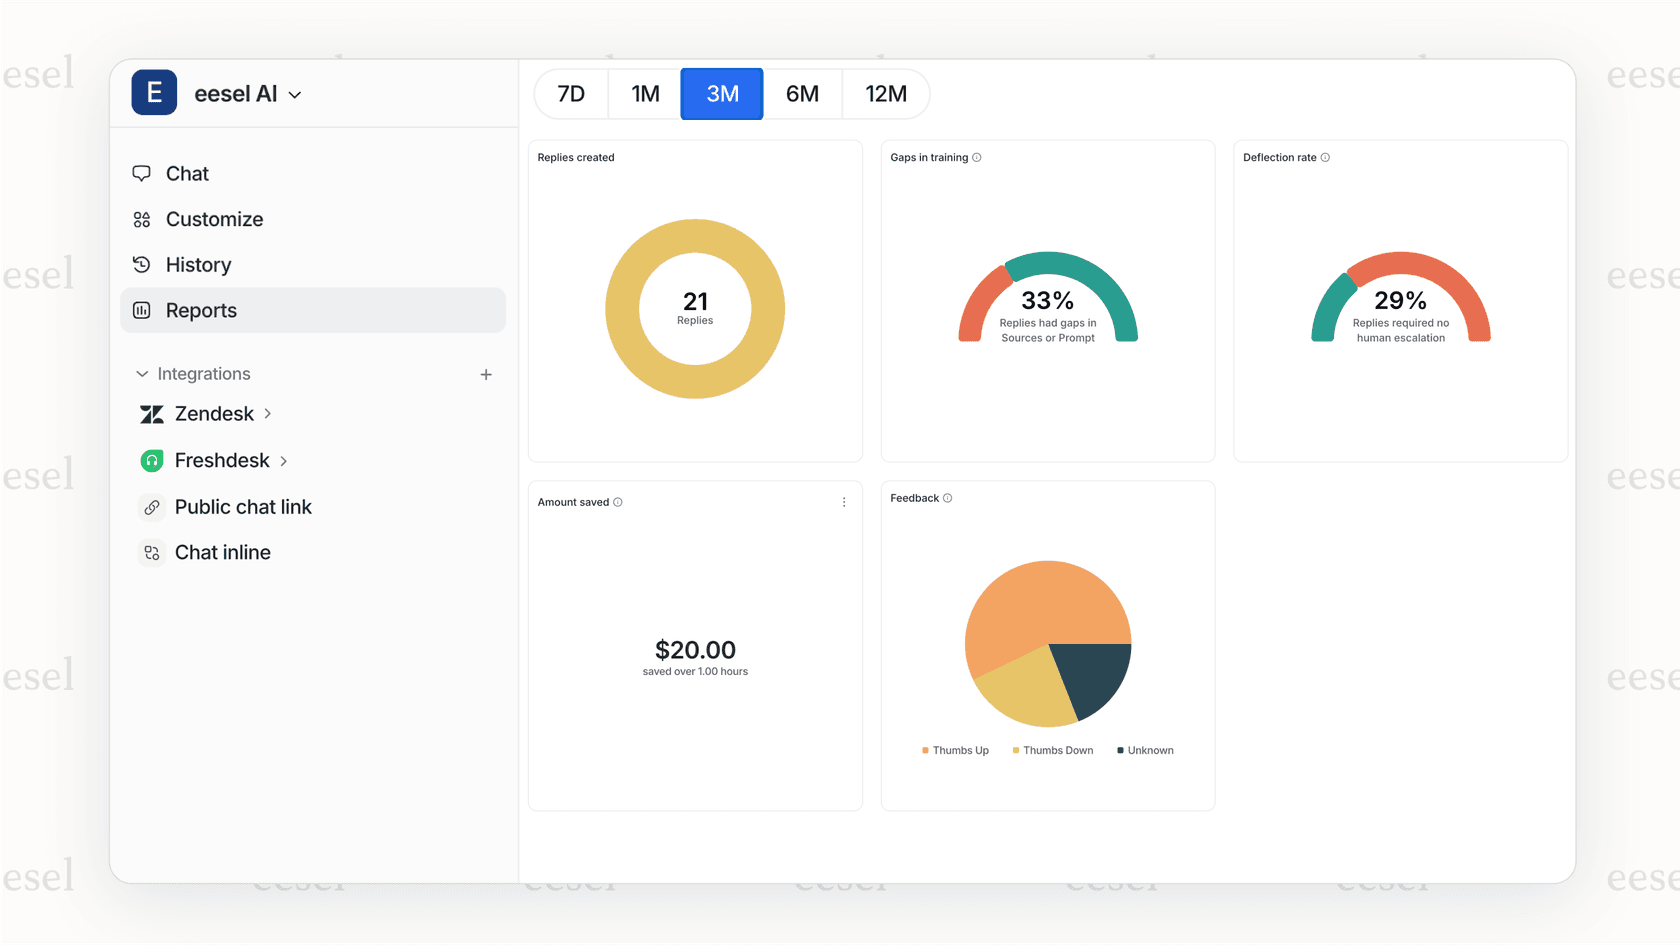
Getting more from your Zendesk reporting
Native Zendesk Explore has limits. Complex analysis often requires exporting data to external tools. Before you reach that point, make sure you are using Explore to its full potential.
Start with these practices:
- Document your calculated attributes so your team understands what they measure
- Create a shared folder of standard reports for common questions
- Schedule dashboard deliveries to keep stakeholders informed without manual work
- Use drill-in functionality to investigate anomalies directly from dashboards
When you do hit Explore's limits, consider whether the analysis truly requires external tools. Sometimes a better-calculated attribute or a different dataset choice solves the problem without adding complexity.
How AI can help with prioritization
While this guide focuses on reporting, the root of many priority-related reporting challenges is inconsistent prioritization. If agents apply priority levels differently, your reports become less meaningful.
This is where AI tools can help. eesel AI learns from your past tickets to suggest or automatically set priorities based on content and customer context. By standardizing prioritization at the point of ticket creation, you reduce the noise in your downstream reporting.
Our AI Triage product can also help by automatically tagging and routing tickets based on content, ensuring high-priority issues reach the right team immediately.
Next steps for better reporting
Start small. Pick one calculated attribute that would help your team and build it. Test it against historical data to verify it produces the expected results. Once you are confident, add it to your standard dashboards.
Over time, you will build a library of custom attributes and metrics tailored to your business. This institutional knowledge makes your reporting more valuable and helps new team members understand how your support operation works.
If you are looking to go beyond reporting and actually improve how tickets are handled, consider how AI can augment your team's capabilities. We integrate directly with Zendesk to help teams automate routine work and focus on what matters.