Zendesk Explore gives you solid reporting capabilities by default, but eventually you'll hit a wall. Maybe you need to track tickets solved in under 20 minutes, or calculate abandonment rates while excluding callers who hung up after two seconds. Calculated metrics solve these limitations.
Calculated metrics let you build custom KPIs using formulas that combine existing data with conditional logic. Instead of settling for default reports, you can create metrics that match your exact business definitions.
This guide walks you through creating calculated metrics in Zendesk Explore, from understanding the formula syntax to building practical examples you can use immediately.
What are calculated metrics and why use them?
Standard calculated metrics are custom metrics you create by combining existing Zendesk data with formulas, functions, and conditional logic. They live alongside Zendesk's built-in metrics but reflect your specific reporting needs.
Here's why teams use them:
- Custom KPIs Track metrics that aren't in Zendesk by default, like "tickets solved in under 20 minutes" or "long-abandoned calls excluding short hangups"
- Filtered views Embed filter logic directly into the metric rather than relying on dashboard filters that can conflict
- Conditional counting Count only tickets or calls that meet specific criteria across multiple conditions
- Consistent reporting Lock in metric definitions so reports stay consistent even when dashboard filters change
A few things to know before you start. You'll need Zendesk Suite Professional, Enterprise, or Enterprise Plus, plus Explore Professional or Enterprise. Also, Zendesk doesn't provide support for creating or troubleshooting custom metrics. If you get stuck, you'll need to check their community forums or documentation.
Understanding the formula structure
Most calculated metrics in Zendesk Explore use a straightforward IF/THEN/ENDIF pattern. Think of it as telling Explore: "If these conditions are true, then count this thing."
The basic structure looks like this:
IF (condition) THEN [field] ENDIF
For multiple conditions, you'll use AND or OR:
IF (condition1) AND (condition2) THEN [field] ENDIF
Here's what you'll need to know about the key components:
IF/THEN/ENDIF The foundation of most formulas. IF starts the condition, THEN defines what to return when true, and ENDIF closes the statement.
AND/OR Logical operators that combine conditions. AND requires all conditions to be true, and OR requires at least one to be true.
VALUE() Extracts the actual value from a metric so you can compare it. You'll use this when checking if a duration or count meets certain thresholds.
Field references Metrics and attributes go in square brackets like [Ticket ID] or [Ticket channel]. String values go in quotes like "Email".
Aggregation functions COUNT(), D_COUNT() (distinct count), and SUM() determine how your data is aggregated.
When you write your formula, you'll see a validation checkmark turn green if the syntax is correct. Red means something's wrong usually a missing parenthesis or incorrect field name.
One naming tip don't use quotation marks, parentheses, or square brackets in your metric names. This causes errors if you reference that metric in another calculated field later.
Creating your first standard calculated metric
We'll walk through building a calculated metric step by step. We'll use the example of tracking long-abandoned calls (calls abandoned after waiting 10+ seconds), which filters out callers who hung up immediately.
Step 1: Open the report builder
Navigate to Explore in your Zendesk admin, click Reports, then New report. Select your dataset Talk: Calls for call metrics or Support: Tickets for ticket metrics. See Zendesk's guide to creating calculated metrics for more details on dataset selection.
Step 2: Access the calculated metric editor
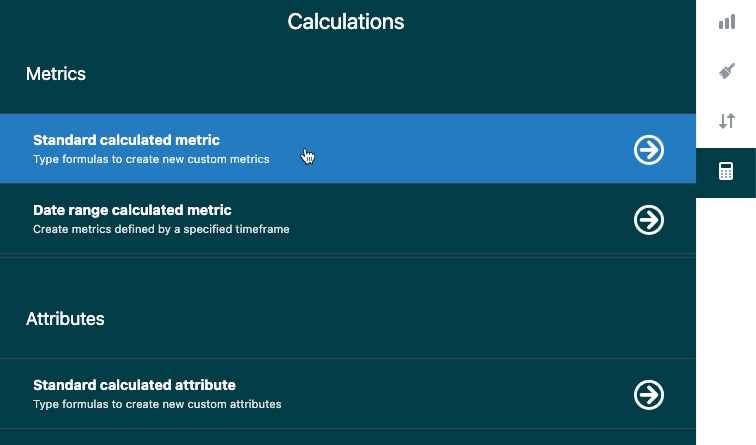
In the right sidebar, click the calculator icon to open the Calculations menu. Select Standard calculated metric. This opens the formula editor where you'll build your custom metric.
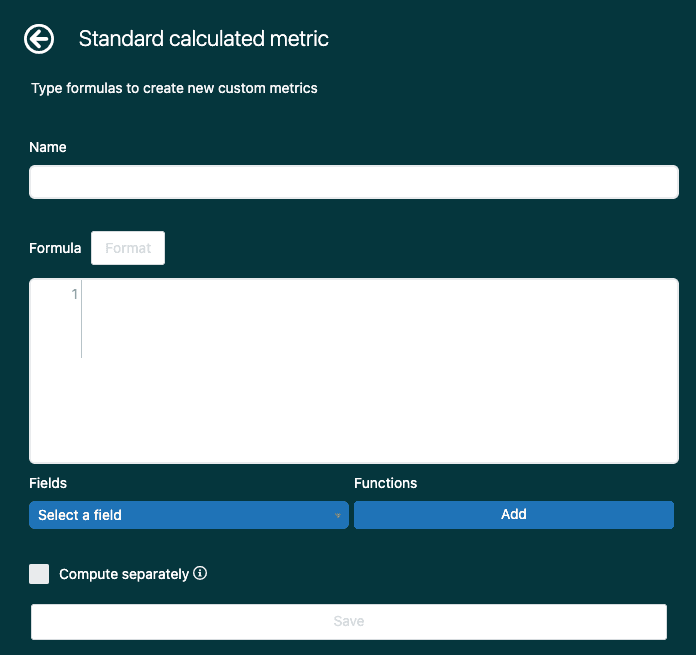
Step 3: Name your metric
Enter a clear, descriptive name. For our example: "Long-abandoned calls (10+ sec)". Avoid special characters that could cause issues later.
Step 4: Build your formula
Here's where the logic happens. For our long-abandoned calls metric, we need three conditions:
- The call must be inbound
- The call must have been abandoned in the queue
- The caller waited at least 10 seconds
The formula looks like this:
IF
([Call direction]="Inbound")
AND
([Call completion status]="Abandoned in queue")
AND
(VALUE(Call wait time (sec)) >= 10)
THEN [Call ID]
ENDIF
Type IF on the first line. Don't worry if you see a red error message at this stage it'll disappear once the formula is complete.
For each condition, wrap the field and value in parentheses. Use the Select a field button below the formula box to insert field names correctly this prevents typos and helps you find fields when you're not sure of the exact name.
Between conditions, add AND to require all conditions to be true. If you wanted tickets that meet condition A OR condition B, you'd use OR instead.
For the wait time condition, use VALUE() to extract the numeric value from the Call wait time metric, then compare it with >= (greater than or equal to).
Close with THEN [Call ID] to tell Explore what to count when all conditions are met, and ENDIF to close the IF statement.
Step 5: Validate and save
Check for the green validation tick at the bottom of the formula box. If you see red, check for missing parentheses, incorrect field names, or syntax errors.
Click Save. Your metric is now saved to the dataset and available in any report using that dataset. You'll find it under the Calculated metrics folder when you click Add in the Metrics panel.
Practical formula examples you can use today
Here are four calculated metrics you can copy and adapt for your own reports.
Example 1: Tickets solved in under 20 minutes
IF VALUE(Full resolution time (min)) < 20 THEN [Ticket ID] ENDIF
This counts tickets where the full resolution time is less than 20 minutes. Use this to track quick-resolution efficiency or set team targets for fast solves. Salto's guide to custom metrics has more examples for ticket-based calculations.
Example 2: Long-abandoned calls excluding short hangups
IF
([Call direction]="Inbound")
AND
([Call completion status]="Abandoned in queue")
AND
(VALUE(Call wait time (sec)) >= 10)
THEN [Call ID]
ENDIF
This gives you a more accurate abandonment KPI by excluding callers who hung up within 10 seconds. These short abandons often aren't a reflection of wait time issues.
Example 3: Tickets by specific channel
IF ([Ticket channel]="Email") THEN [Ticket ID] ENDIF
Replace "Email" with any channel you want to isolate: Chat, Web, API, etc. This creates a metric you can use alongside others to compare how channels perform side by side.
Example 4: Response time categories
IF VALUE(First reply time (min)) != NULL AND VALUE(First reply time (min)) >= 10 THEN "Slow response"
ELIF VALUE(First reply time (min)) != NULL THEN "Fast response"
ENDIF
This is actually a calculated attribute (not a metric) that groups tickets by response speed. Use ELIF to add multiple conditions. The != NULL check ensures tickets with no replies aren't grouped with fast responses.
Troubleshooting common issues
Even with the right formula, things can go wrong. Here's how to fix the most common problems:
Red error messages in the formula editor Usually a syntax issue. Check that every opening parenthesis has a closing one. Verify field names are correct using the Select a field button. Make sure string values are in quotes and you're using the right brackets for fields.
Metric not appearing in the Add menu Verify you're looking in the right dataset. Calculated metrics are saved to the dataset you selected when creating the report. Check the Calculated metrics folder in the Metrics panel.
Unexpected results or zeros Calculated metrics show all results by default, including nulls and zeros. Add a metric filter to remove zero and null values if they're cluttering your report. Also check that you're using the right aggregator COUNT, D_COUNT, or SUM.
Performance issues with large datasets Complex calculated metrics on large datasets can slow down report loading. Standard calculated metrics filter before processing, which helps, but very complex formulas on millions of tickets may still lag. You'll want to simplify your formula or filter your dataset first.
Editing existing metrics To modify a calculated metric, go to any metric panel (Metrics, Columns, Rows, etc.), click Add, find your metric in the Calculated metrics folder, and click the pencil icon next to it. You can also duplicate built-in metrics to create editable copies.
When to use result metric calculations instead
Standard calculated metrics aren't the only option. Zendesk Explore also offers result metric calculations, which work differently.
Standard calculated metrics filter and calculate at the data level, before aggregation happens. They're best for conditional counting and filtering.
Result metric calculations apply after your report has already aggregated the data. They're best for math operations on already-calculated results.
Use result metric calculations when you need to:
- Calculate percentages of totals (like percentage of on-hold tickets)
- Add margins or markups to cost calculations
- Perform arithmetic on metrics that have already been aggregated
For example, to calculate the percentage of on-hold tickets, you'd use a result metric calculation with this formula:
COUNT(On-hold tickets)/COUNT(Tickets)
Then set the display format to percentage in the chart configuration.
The key difference: standard calculated metrics define what gets counted. Result metric calculations define what happens to the numbers after they've been counted.
Simplifying support analytics without complex formulas
Calculated metrics are powerful, but they come with a learning curve. You need to understand the formula syntax, know which fields to reference, and troubleshoot when things don't work as expected. Geckoboard's guide to Zendesk custom metrics offers additional examples if you want to explore more use cases.
If you're spending more time debugging formulas than analyzing your support data, there's another approach. eesel AI's Zendesk integration connects directly to your Zendesk account and learns from your past tickets, help center articles, and macros. Instead of writing formulas, you ask questions in plain English.

Want to know your average resolution time by channel? Or which agents handle the most complex tickets? eesel AI generates those insights automatically without any formula writing. It also identifies trends and patterns you might not think to create calculated metrics for.
For teams that need deep custom reporting, calculated metrics in Explore are worth the effort. But if you want actionable insights without the technical overhead, an AI-powered analytics approach might be a better fit. You can also explore eesel AI's integration options to see how AI connects with your existing tools.
