How to embed Zendesk Explore reports: A complete guide for 2026
Stevia Putri
Last edited February 26, 2026
If you're trying to embed Zendesk Explore reports into external dashboards or corporate sites, you've probably hit a wall. Despite being one of the most requested features in the Zendesk community since at least 2020, there is no official Zendesk Explore API for embedding reports externally.
But that doesn't mean you're out of options. This guide walks through the workarounds developers use to access Zendesk reporting data programmatically, from API-based solutions to export methods and third-party tools. We'll also look at how modern alternatives like eesel AI are filling this gap with native embedding capabilities.
Understanding the Zendesk Explore API limitation
When support teams invest in Zendesk, they expect comprehensive analytics. The platform collects rich data on ticket volumes, agent performance, and customer satisfaction. Naturally, teams want to embed these insights into leadership dashboards, customer portals, or internal tools.
Here's the reality: Zendesk Explore (the platform's native reporting tool) has no public API for external embedding. You cannot programmatically pull Explore dashboard data into external applications. This isn't a documentation oversight or a hidden feature. It's a deliberate product limitation that has persisted despite years of community requests.
A Zendesk community post from 2020 captures the frustration: an Enterprise customer wanted to integrate Explore dashboards into their corporate site alongside other business systems. The response? No API exists for this use case.
This limitation matters because modern support operations need data where decisions happen. Leadership wants ticket metrics in their BI dashboards. Product teams want customer insights in their analytics tools. Support managers want real-time visibility without switching contexts.
The good news is that workarounds exist. They range from simple API calls for basic metrics to comprehensive solutions that bypass Zendesk's limitations entirely.
Workaround 1: Using the Zendesk Views API for basic metrics
The Zendesk Views API offers the closest thing to programmatic report data. While it won't give you full Explore dashboards, it can retrieve ticket counts and lists based on view conditions.
Key endpoints for report data
The Views API provides several endpoints useful for embedding scenarios:
-
POST /api/v2/views/preview/count - Returns ticket counts without creating permanent views. This is ideal for embedding because you can query metrics on demand without cluttering your Zendesk instance with temporary views.
-
GET /api/v2/views/{id}/count - Gets counts for existing views you've already created.
-
GET /api/v2/views/count_many?ids= - Batch retrieves counts for up to 20 views in a single request, useful for dashboard widgets showing multiple metrics.
What metrics you can retrieve
Using the preview count endpoint, you can get counts for standard ticket conditions:
- New tickets created today/this week/this month
- Open tickets by group or assignee
- Solved tickets in a date range
- Pending tickets awaiting customer response
- Tickets by priority or status
Code example: Preview count in action
Here's how to use the preview count endpoint to retrieve ticket metrics:
POST /api/v2/views/preview/count
Request body to count open tickets:
{
  "view": {
    "all": [
      {"operator": "is", "value": "open", "field": "status"}
    ]
  }
}
The response includes the count value and freshness indicator:
{
  "view_count": {
    "fresh": true,
    "pretty": "~700",
    "value": 719,
    "view_id": 25
  }
}
Rate limits you need to know
The Views API has specific rate limits that affect embedding scenarios:
- Standard API rate limit: 700 requests per minute for Enterprise plans
- View preview count: 5 requests per minute, per view, per agent
- Counts are cached; large views may have 60-90 minute cache delays
This means the Views API works well for periodic dashboard updates but not for real-time streaming data.
Limitations of this approach
The Views API has significant constraints:
- No historical trend data (only current counts)
- No custom metrics or calculated fields
- No visualization capabilities (just raw numbers)
- Cannot replicate the visual reports from Explore
For simple metrics like "how many open tickets do we have," the Views API works. For complex analytics and visualizations, you'll need a different approach.
Workaround 2: Exporting data for external embedding
When the Views API doesn't provide enough data, exporting raw ticket data gives you full control over reporting and embedding.
Native export options
Zendesk provides several export methods for accounts on Growth, Professional, Enterprise, or Enterprise Plus plans (Team plans must use the API):
| Format | Best For | Limitations |
|---|---|---|
| CSV | Quick spreadsheet analysis | 1,000 ticket limit per view, no comments/descriptions |
| JSON | Large datasets, complete data | Accounts with 200,000+ tickets processed in 31-day increments |
| XML | Complete account backups | 500MB max (~200,000 tickets) |
Source: Zendesk Data Export Documentation
Important: Data exports are not enabled by default. The account owner must contact Zendesk Customer Support to activate exports, which takes 24-48 hours.
Using the Tickets API for custom reports
For programmatic access to ticket data, the Zendesk Tickets API provides more flexibility than native exports:
Incremental Export Endpoint:
GET /api/v2/incremental/tickets.json?start_time={timestamp}
This endpoint is designed for data syncing and returns tickets created or updated since your specified start time. It supports:
- Pagination for large datasets (100 tickets per page)
- Sideloading related data with
include=comment_events - Filtering by date ranges and ticket properties
Rate limits: 10 requests per minute for incremental exports, 700 requests per minute for standard API calls.
Processing exported data
Once you have ticket data via export or API, you can:
- Import into BI tools like Tableau or PowerBI for visualization
- Build custom dashboards using tools like Grafana or Metabase
- Create automated reports that refresh on schedules
- Combine Zendesk data with other business systems
For teams with development resources, this approach provides the most flexibility. You own the data pipeline and can customize reporting exactly to your needs.
Limitations to consider
- Data freshness: Exports are point-in-time, not real-time
- Technical overhead: Requires engineering time to build and maintain
- JSON exports exclude items with timestamps within 6 minutes of the request
- Large tickets (over 1MB) have comments excluded from JSON exports

Workaround 3: Third-party integration tools
If building custom data pipelines isn't feasible, third-party tools can bridge the gap between Zendesk and your embedding needs.
BI tool connectors
Several business intelligence platforms offer native Zendesk integrations:
- Tableau - Zendesk connector for pulling ticket data into dashboards
- PowerBI - Native Zendesk integration with pre-built report templates
- Looker - Customizable data models for Zendesk analytics
- Google Data Studio - Free option for basic Zendesk reporting
These connectors typically sync data on schedules (hourly or daily) and handle the API complexity for you.
Marketplace apps
The Zendesk Marketplace offers apps that extend reporting capabilities:
- Geckoboard - Real-time dashboard widgets for Zendesk metrics
- Klipfolio - Custom dashboard builder with Zendesk data sources
- Dasheroo - Pre-built Zendesk KPI dashboards
ETL tools for automation
For teams needing automated data syncing, ETL (Extract, Transform, Load) tools can move Zendesk data to data warehouses:
- Fivetran - Automated Zendesk data pipelines
- Stitch - Simple Zendesk to warehouse syncing
- Airbyte - Open-source alternative for data integration
Cost considerations
Third-party solutions add expense on top of your Zendesk subscription:
- BI tools: $20-70 per user per month
- Dashboard apps: $10-50 per month
- ETL tools: $100-500+ per month depending on data volume
For small teams, these costs may exceed the value. For larger organizations, they can be more cost-effective than building custom solutions.
A better approach: Embedded analytics with eesel AI
While workarounds exist for Zendesk's API limitations, they all require trade-offs between complexity, cost, and capability. This is exactly why we built eesel AI.
Why eesel AI exists
We kept hearing the same frustration from support teams: they loved Zendesk for ticketing but couldn't get their analytics where they needed them. Leadership wanted insights in their BI tools. Support managers wanted real-time dashboards. Product teams wanted customer data integrated into their workflows.
Instead of forcing teams to build complex data pipelines or pay for multiple third-party tools, we created an AI teammate that connects to Zendesk (and other sources) and makes data accessible through modern APIs and embedding capabilities.
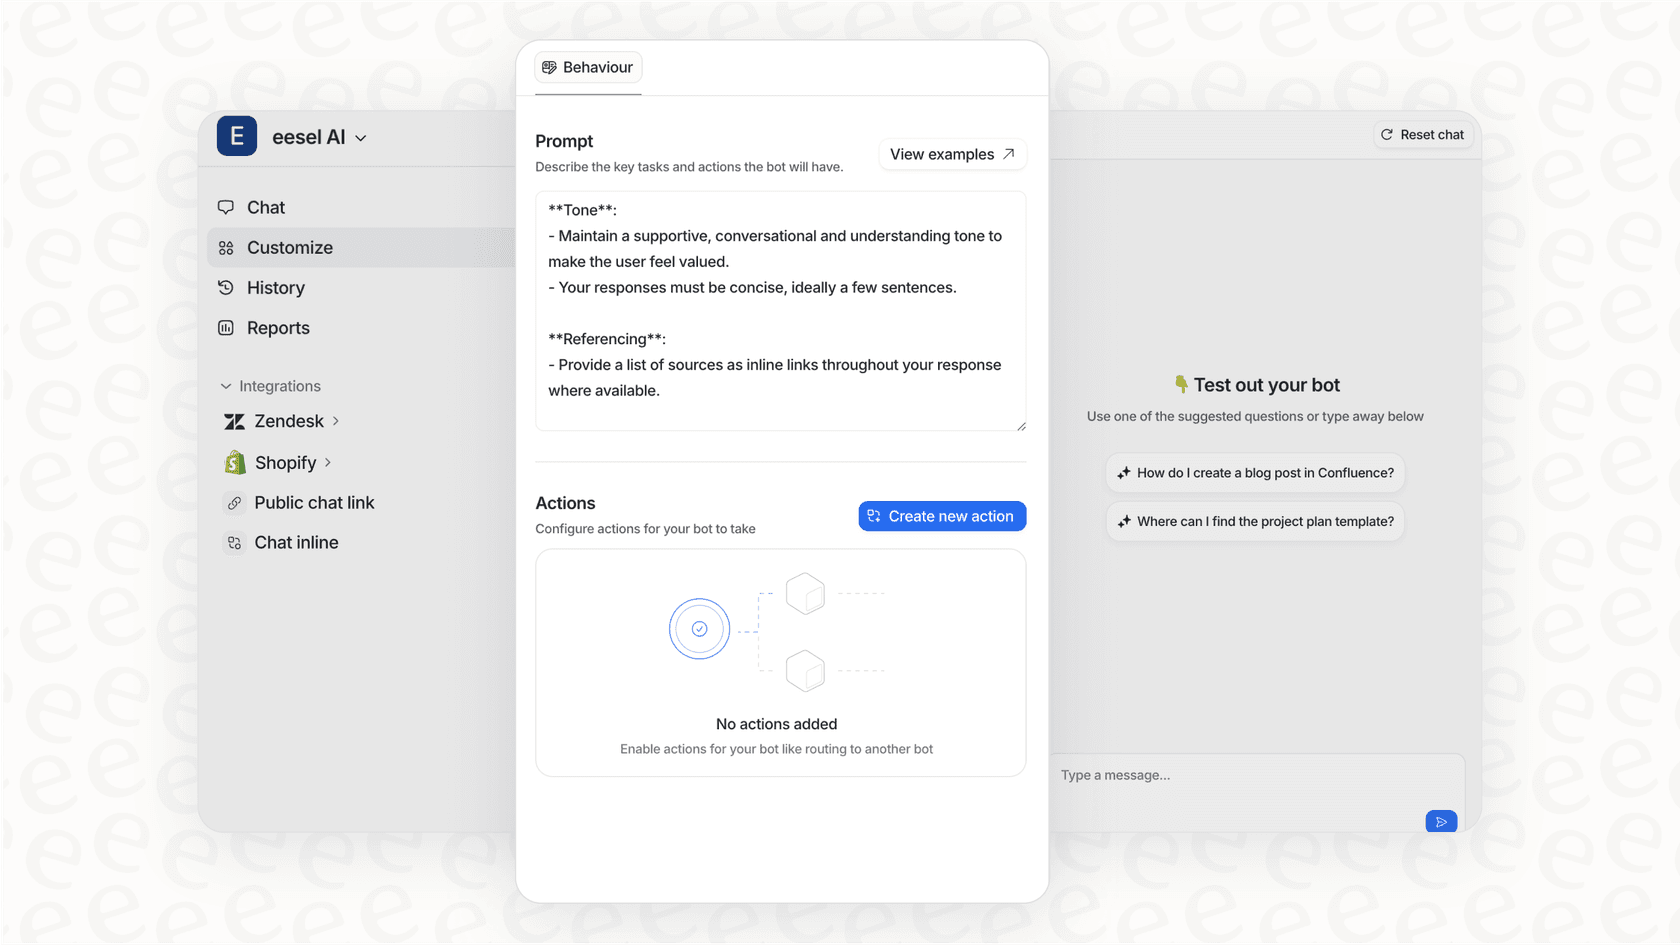
Native embedding capabilities
Unlike Zendesk Explore, eesel AI was built with embedding as a core feature:
- iFrame embedding - Drop any dashboard or report into external sites, portals, or tools
- API access - Programmatic access to all analytics data via REST API
- Real-time reporting - No batch exports or data syncing delays
- Multi-source integration - Combine Zendesk data with other tools in unified dashboards
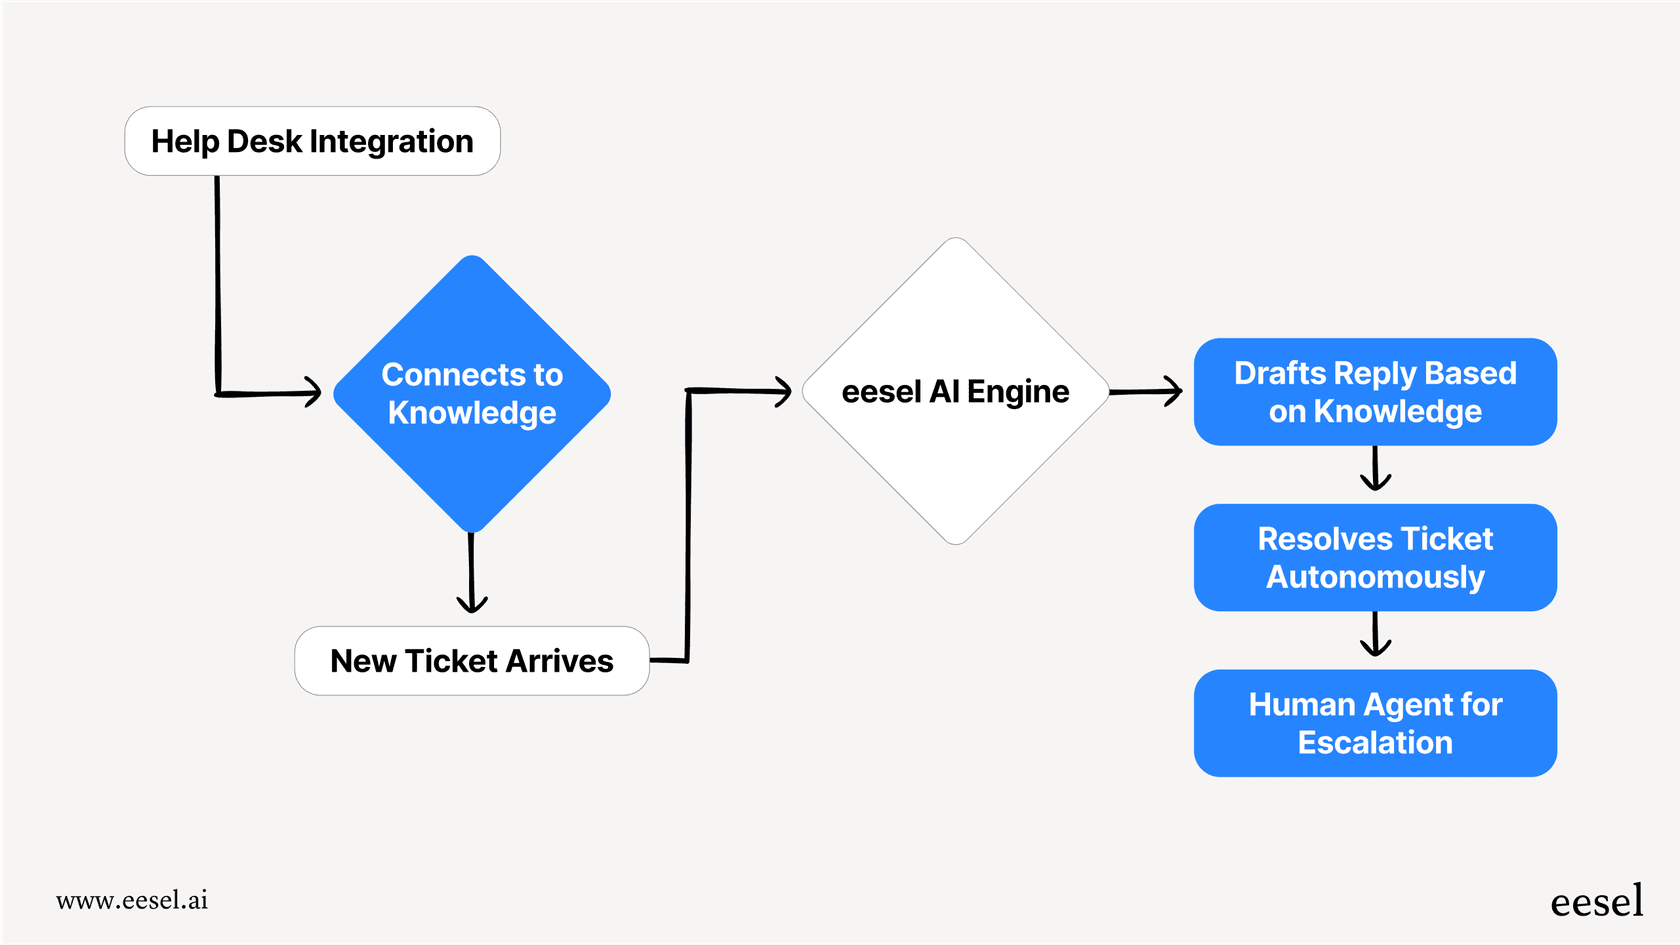
How it works
Getting started with eesel AI is straightforward:
- Connect your Zendesk - We integrate directly with your help desk in minutes, not weeks
- Build your reports - Our AI learns from your data and helps create meaningful analytics
- Embed anywhere - Use iFrames or API calls to put insights where your team works
Because we handle the data pipeline, you get real-time analytics without the engineering overhead of building custom solutions.
Use cases that work today
Teams use eesel AI for embedding scenarios that Zendesk Explore cannot support:
- Leadership dashboards - Executive summaries in corporate BI tools
- Customer portals - Self-service analytics for enterprise clients
- Internal tools - Support metrics integrated into team workflows
- Slack/Teams reporting - Automated analytics delivered where conversations happen
Pricing that scales with value
Our pricing is based on AI interactions, not seats:
| Plan | Monthly | Annual | Bots | Interactions/mo |
|---|---|---|---|---|
| Team | $299 | $239/mo | Up to 3 | 1,000 |
| Business | $799 | $639/mo | Unlimited | 3,000 |
| Custom | Contact | Custom | Unlimited | Unlimited |
For teams currently paying for Zendesk plus multiple third-party BI tools, consolidating with eesel AI often reduces total costs while improving capabilities.
Choosing the right approach for your Zendesk Explore API embed reports needs
Every team's situation is different. Here's how to decide which path makes sense for you.
Decision matrix
| Your Need | Best Approach | Why |
|---|---|---|
| Simple ticket counts | Views API | Low complexity, near real-time |
| Historical trend analysis | Export + BI tools | Full data access, customizable |
| Real-time embedded dashboards | eesel AI | Native embedding without engineering |
| One-time data migration | Native export | Built-in, no additional tools |
Factors to consider
Technical resources available Do you have developers who can build and maintain API integrations? If not, third-party tools or eesel AI will be more practical than custom solutions.
Data freshness requirements How current does your data need to be? Views API provides near real-time counts. Native exports are point-in-time. Real-time dashboards require solutions like eesel AI.
Budget constraints Factor in both upfront and ongoing costs. Custom development has high upfront costs. Third-party tools have ongoing subscription fees. eesel AI consolidates multiple capabilities into one platform.
Long-term scalability Will your reporting needs grow? Starting with simple API calls might work today but require rebuilding as requirements expand.
Our recommendation
If you need embedded Zendesk analytics today, here's our practical advice:
- Start with the Views API for simple metrics. It's free, built-in, and works immediately.
- If you need more than basic counts, evaluate whether building custom pipelines or using a platform like eesel AI makes more sense for your timeline and budget.
- For teams already paying for multiple BI tools to work around Zendesk's limitations, consolidating with a purpose-built platform often delivers better results at lower total cost.
The bottom line? You don't have to accept Zendesk's embedding limitations as permanent. Whether through APIs, exports, or alternative platforms, your support data can live where your team works.
Frequently Asked Questions
Share this article

Article by
Stevia Putri
Stevia Putri is a marketing generalist at eesel AI, where she helps turn powerful AI tools into stories that resonate. She’s driven by curiosity, clarity, and the human side of technology.