Ticket tags are the backbone of organization in Zendesk Support. They help you categorize tickets, trigger automations, and route work to the right teams. But reporting on those tags requires a different approach from standard ticket fields.
The Ticket tags attribute in Zendesk Explore lets you analyze how tags are being used across your support operation. This attribute is part of the broader metrics and attributes available in Zendesk Support. Unlike simple ticket fields that hold a single value, tags are multi-value attributes that need special handling in reports.
In this guide, you'll learn how to use the Zendesk Explore attribute ticket tags to build reports that actually answer your questions. We'll cover everything from basic tag counts to advanced calculated formulas. And if you find yourself drowning in Explore formulas, we'll touch on simpler alternatives, too.
For a broader look at Zendesk reporting capabilities, check out our Zendesk Explore reporting tutorial.
What is the Ticket tags attribute?
The Ticket tags attribute in Zendesk Explore represents all the tags applied to a ticket. While a ticket can only have one status or one assignee, it can have multiple tags simultaneously. This is what makes tag reporting both powerful and tricky.
Here's what you need to know:
- Multi-value storage: Unlike single-value fields, tags are stored as a collection. When you add Ticket tags to a report, you're working with all tags on each ticket at once.
- Available datasets: You'll find the Ticket tags attribute in the Support - Tickets dataset, the Updates History dataset, and the Backlog History dataset.
- Sync delay: When you add or change tags in Zendesk Support, it can take up to an hour for those changes to sync with Explore. This catches a lot of people off guard when they're testing new reports.
The key distinction to understand is between the Ticket tags attribute (which shows all tags on a ticket as a combined value) and filtering by individual tags. If you're trying to answer "How many tickets have the 'escalated' tag?" you'll need a different approach than simply adding Ticket tags to your rows.
Getting started: Your first tag report
Let's build a simple report that shows which tags are being used most frequently. This is often the starting point for deeper tag analysis.
What you'll need:
- Zendesk Explore Professional or Enterprise
- Editor or Admin permissions in Explore
- Some tickets with tags in your Zendesk account
Step 1: Create a new report In Explore, click the Reports icon, then click New report. Select the Support - Tickets dataset and click Start report.
Step 2: Add your metric In the Metrics panel, click Add and select Tickets. This gives you a count of tickets to work with.
Step 3: Add Ticket tags to rows In the Rows panel, click Add and search for Ticket tags. Select it and click Apply. You'll now see a list of all tag combinations in your tickets.
Step 4: Add a date filter In the Filters panel, add Ticket created - Date and set it to your desired timeframe, like "Last 30 days."

The results show you how many tickets have each specific combination of tags. Click the Tickets column heading to sort by frequency. This tells you which tags (and tag combinations) appear most often in your tickets.
What you're actually seeing: Each row represents a unique combination of tags. If you have tickets tagged with just "billing" and others tagged with "billing" and "urgent," those appear as separate rows. This is why the numbers might not match what you expect if you're thinking about individual tag counts.
Filtering tickets by specific tags
Now that you can see all your tags, you'll probably want to filter for specific ones. This is where the multi-value nature of tags creates challenges.
Using the Ticket tags filter In the Filters panel, add the Ticket tags attribute. You can then select specific tags to include in your report. This works well for simple "show me tickets with this tag" scenarios.
The multiple tag problem If you select multiple tags in the filter, your metric values get multiplied by the number of matching tags. A ticket with three selected tags counts three times. This is rarely what you want.
The exclusion limitation You can't use native filters to exclude tickets with specific tags. The filter only works for inclusion. If you need to find tickets that don't have a particular tag, you'll need to use calculated metrics (covered in the next section).

Best practice: Use native filters for simple single-tag filtering. For anything more complex (multiple tags, exclusions, conditional logic), use calculated metrics or attributes instead. For more details, see Zendesk's guide on reporting with tags.
Using calculated metrics and attributes for Zendesk Explore attribute ticket tags
When native filtering isn't enough, calculated metrics and attributes give you precise control. These formulas let you define exactly which tickets to count based on their tags.
Finding tickets WITH a specific tag
Create a standard calculated metric with this formula:
IF [Ticket tags]="escalated" THEN [Ticket ID] ENDIF
Add this metric to your report with the COUNT aggregator. It will count only tickets that have the exact tag "escalated."
Finding tickets WITHOUT a specific tag
To find tickets that don't have a particular tag, use:
IF (NOT INCLUDES_ANY([Ticket tags], "spam")) THEN [Ticket ID] ENDIF
This counts all tickets except those tagged with "spam." The NOT INCLUDES_ANY function is essential here because you can't achieve this with native filters.
Grouping similar tags
Often you'll have related tags that you want to group together. Maybe you have "billing_issue," "billing_question," and "billing_refund" and want to report on all billing-related tickets as a category.
Create a standard calculated attribute:
IF (CONTAINS([Ticket tags],"billing")) THEN "Billing"
ELIF (CONTAINS([Ticket tags],"technical")) THEN "Technical"
ELSE "Other" ENDIF
This technique is covered in Zendesk's recipe for reporting on tickets with similar tags. Add this attribute to your Rows or Columns panel. Now your report groups tickets by category rather than showing every individual tag.

Calculated metric vs. calculated attribute: Use calculated metrics when you want to change what gets counted (tickets with/without specific tags). Use calculated attributes when you want to change how tickets are grouped (categories, tag groups, formatted tag names). For advanced formatting options, check out this custom formatting recipe for ticket tags.
Common use cases for ticket tag reporting
Here are practical ways teams use the Ticket tags attribute to gain insights:
- Product category tracking: Tag tickets by product line, then use the CONTAINS formula to group tickets by product family in your reports.
- Escalation monitoring: Tag tickets when they're escalated to senior agents. Create a calculated metric to track escalation volume over time.
- Customer segment analysis: Apply tags for customer tiers (enterprise, mid-market, smb). Break down resolution times by segment to spot service level differences.
- Macro effectiveness: Add a unique tag to each macro. Report on which macros are used most and correlate with CSAT scores.
- Missing tag identification: Use calculated attributes to flag tickets that should have tags but don't. For example, identify tickets missing a "category" tag for data quality purposes.
The key is consistency. Tags are only useful for reporting if they're applied systematically. A tag that's applied to 80% of relevant tickets is less useful than one that's applied to 100%.
Troubleshooting common issues
Even experienced Explore users run into these tag reporting problems:
"My tag changes aren't showing up" Remember the one-hour sync delay. If you just added tags to tickets, wait before expecting to see them in Explore. This applies to tag additions, removals, and changes. For more troubleshooting tips, see Zendesk's community tips for reporting on tags.
"My numbers are wrong when I filter by multiple tags"
This is the multiplication issue mentioned earlier. Each ticket gets counted once for every matching tag. Use calculated metrics with INCLUDES_ANY instead of native filters for accurate multi-tag reporting.
"I can't exclude tags from my report"
Native filters don't support exclusion. You must use a calculated metric with NOT INCLUDES_ANY to find tickets without specific tags.
"Tags appear differently than in Support" Tag matching in formulas is case-sensitive. "Escalated" and "escalated" are treated as different tags. Check your formula case against what's actually applied to tickets.
"My report has too many rows to read" When you add Ticket tags to rows, every unique tag combination creates a separate row. Use calculated attributes to group similar tags into categories, or filter for specific tags of interest.
When to consider alternatives to Explore
Zendesk Explore is powerful, but it's not always the right tool for the job. Consider alternatives when:
Formulas become too complex If your team spends more time debugging Explore formulas than analyzing results, you might need a simpler approach. Not every support manager wants to write REGEXP formulas.
You need real-time data The one-hour sync delay means Explore is always showing you historical data. For real-time tag analysis or immediate alerts, you'll need a different solution.
You want automated categorization Manual tagging requires discipline and consistency. If your team struggles with tag hygiene, AI-powered categorization might work better. Tools like eesel's AI agent for Zendesk can analyze ticket content and automatically categorize tickets without relying on manual tags.
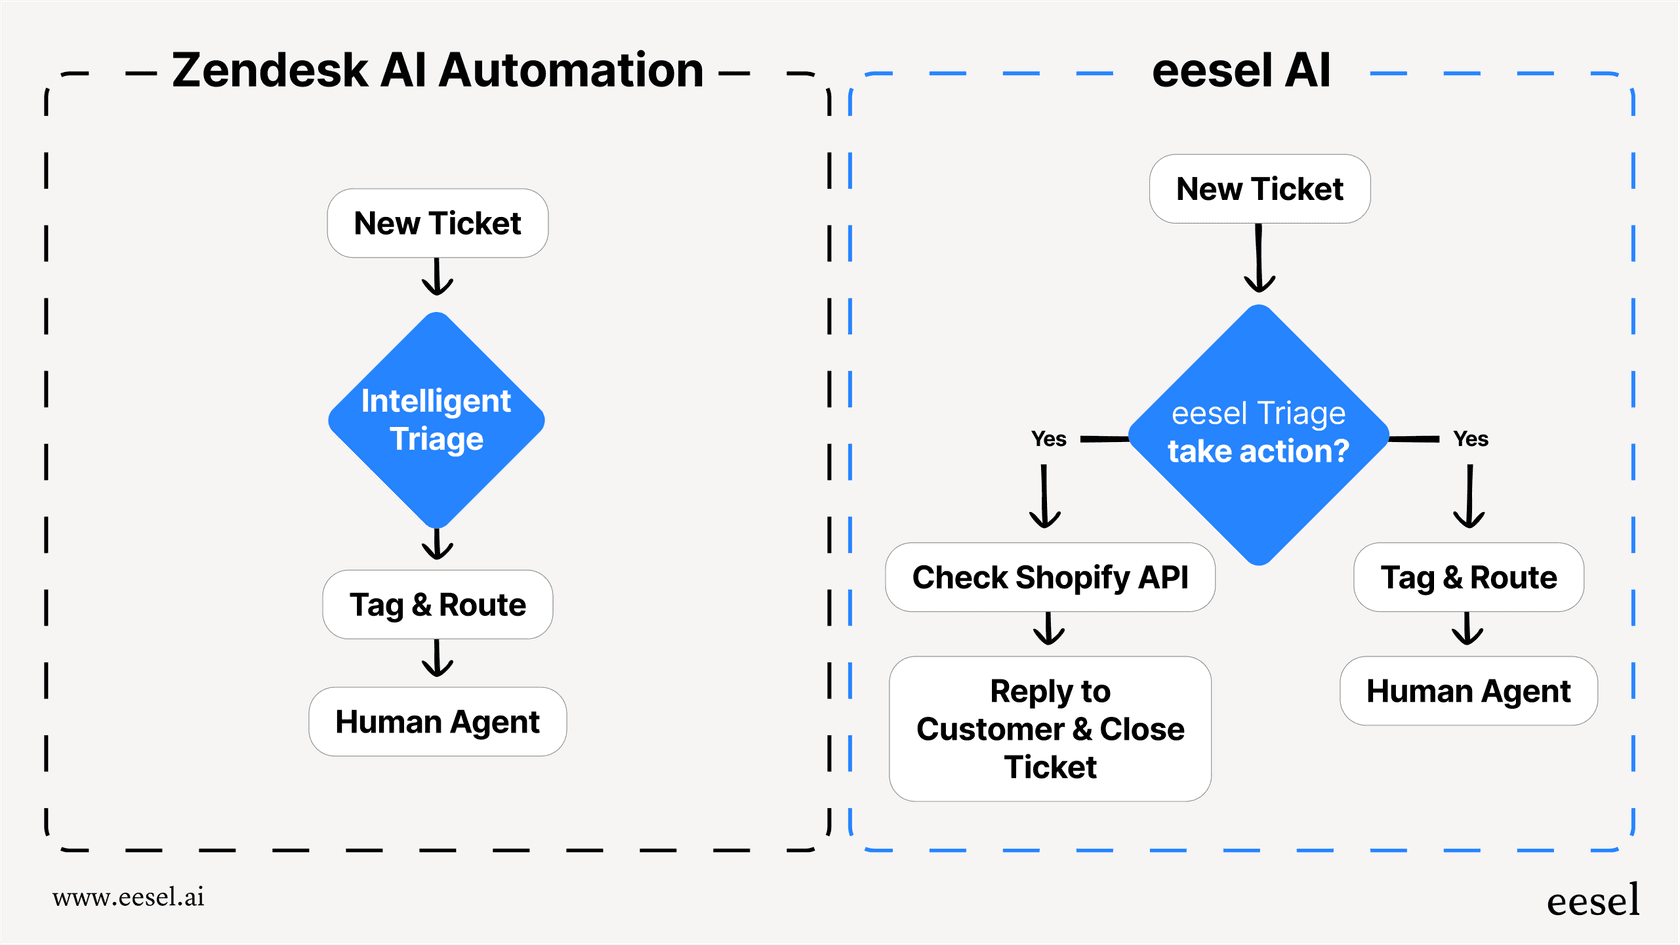
Our AI Triage product, for example, automatically tags, routes, and prioritizes tickets based on their content. It learns from your past tickets to categorize new ones consistently, eliminating the manual tagging burden.
Start analyzing your tickets by tags today
The Ticket tags attribute in Zendesk Explore opens up powerful reporting possibilities once you understand how to work with it. Start simple: build a basic tag frequency report to see what you're working with. Then gradually add calculated metrics and attributes as your questions get more specific.
Remember that tag reporting is only as good as your tagging discipline. Before diving into complex formulas, make sure your team is applying tags consistently. A simple report with clean data beats a complex report with messy data every time.
If you find yourself fighting with Explore formulas or waiting on sync delays, it might be time to explore alternatives. Whether you stick with native Zendesk reporting or add AI-powered automation to the mix, the goal is the same: understanding your support data so you can improve your customer experience.
Ready to simplify your ticket analysis? Try eesel AI free or book a demo to see how AI-powered categorization works with your Zendesk data.
