The ultimate guide to Zendesk BI tools in 2026
Stevia Putri
Stanley Nicholas
Last edited January 12, 2026

Your Zendesk account is packed with customer data. Every single ticket tells a story about what your customers need, where your product has issues, and how your agents are performing. Zendesk provides a robust foundation to capture this information, and by digging in, you can truly understand your customer journey.
This is where Business Intelligence (BI) tools enter the picture.
Picking the right tool is about finding the best fit for your team's goals. Do you leverage the power of Zendesk’s native tools? Do you integrate a heavy-duty platform like Power BI for company-wide data? Or is there a complementary way? This guide will break down the options for you, comparing their capabilities and strengths, so you can start turning your Zendesk data into a real advantage.
What are Zendesk BI tools?
So, what exactly are Zendesk BI tools? In short, they're apps that help you grab, sort through, and visualize all your support data so you can spot patterns and optimize your operations.
The idea is to go beyond counting tickets and start understanding the trends behind the numbers. For instance, you might use these tools to analyze customer satisfaction trends or identify which ticket types are most common during peak hours.
These tools usually come in two flavors:
- Native Reporting: The mature analytics tools that are already built into Zendesk.
- External BI Platforms: Separate platforms like Power BI, Tableau, or SquaredUp that you connect to Zendesk and other business applications.
We’ll look at both of these, plus a third, AI-native option that focuses on enhancing agent efficiency in real-time.
Option 1: Native Zendesk BI tools - Zendesk Explore
Zendesk Explore is the platform's own analytics tool. It's the standard choice for most teams because it's seamlessly integrated. It makes perfect sense: you want to understand your support data, and there's a powerful tool right inside the platform you already use every day.
Features and capabilities
Zendesk Explore gives you a comprehensive set of pre-built dashboards for essential metrics: ticket volume, first response time, agent productivity, and more. You can also build your own reports, drill down into specific tickets, and monitor key metrics as they happen.
The pros: Why teams start here
- It’s built-in: There's no complex setup required. It’s already part of your Zendesk account and ready to provide value.
- User-friendly dashboards: The ready-made dashboards are excellent for a quick health check on your support operations without needing a dedicated data analyst.
- Purpose-built for Zendesk: All the metrics and reports are designed specifically to help support teams thrive within the Zendesk ecosystem.
Considerations for advanced reporting
While Explore is a powerful starting point for support-centric analysis, some teams find they need additional flexibility as their reporting needs grow more complex. As some users in the Zendesk community forums mention, certain advanced data queries may require a more specialized approach.
Points to consider when scaling your reporting:
- Advanced customization: Creating highly bespoke, non-standard reports can have a learning curve for those unfamiliar with data modeling.
- Cross-platform integration: While excellent for Zendesk data, combining it with information from external CRMs or marketing tools may require additional integration steps.
- Broad sharing needs: Sharing insights with stakeholders who do not have Zendesk access typically requires manual exports or additional licenses.
Option 2: Connecting to external BI tools like Power BI
When your organization needs deep, cross-departmental analytics, the next step is often a full-blown BI platform like Microsoft Power BI. These tools are built for comprehensive data analysis across your entire business.
Why use external BI tools? The need for deeper analytics
The biggest reason to use an external tool is to pull all your data into one central hub. With a platform like Power BI, you can integrate your Zendesk ticket data with sales figures from Salesforce, website traffic from Google Analytics, and payment info from Shopify. This lets you answer holistic questions, such as "How does our first-response time correlate with customer lifetime value across different segments?"
The typical setup process for external BI tools
Note that getting your Zendesk data flowing into Power BI is a comprehensive project. It's a strategic investment that typically requires technical resources. The process often involves using an ETL (Extract, Transform, Load) tool like Stitch or Panoply to pull data from Zendesk, organize it, and send it to a data warehouse (like Snowflake). From there, you connect Power BI to the warehouse to build your reports.
graph TD A[Zendesk] -->|ETL Tool e.g. Stitch| B(Data Warehouse e.g. Snowflake) B --> C{Power BI} D[Salesforce] -->|ETL Tool| B E[Google Analytics] -->|ETL Tool| B C --> F[Custom Reports & Dashboards]
The pros: What you gain with external BI tools like Power BI
- Comprehensive connectivity: Pull in data from virtually any source in your business for a 360-degree view.
- Advanced analytics: You can perform complex data modeling, build predictive reports, and create highly interactive, multi-layered dashboards.
- Flexible sharing: It's easy to share reports across the company or embed them in internal wikis for everyone to see.
Considerations for external BI tools: Resources and costs
For all its power, this route involves significant organizational commitment:
- Technical requirements: You'll likely need a data analyst or engineer to manage the integration and maintain data integrity.
- Data refresh cycles: Most of these setups provide periodic updates rather than real-time data, which is a factor to consider for immediate support needs.
- Cumulative investment: You are investing in the Power BI license, the ETL tool, and the data warehouse simultaneously.
Option 3: Enhancing Zendesk with an AI-native approach
Traditional BI tools are fantastic for historical analysis. But you can also use your data to improve ticket handling in real-time. An AI-native approach is a complementary strategy that focuses on providing useful insights and automation right inside your daily Zendesk workflow.
Moving from retroactive analysis to real-time action
Instead of only looking at dashboards to see which tickets could have been automated last week, AI can analyze your ticket history, identify patterns, and help you resolve similar issues immediately today.
This is where a tool like eesel AI comes into play. It works alongside Zendesk and your other knowledge sources to help you automate responses, route tickets efficiently, and support your agents.
How eesel AI turns Zendesk data into automated resolutions
The insights from eesel AI are actionable because they are integrated into an automation engine.
- Learning from history: eesel AI can learn from your past resolved Zendesk tickets. It identifies common issues and your brand's unique tone of voice to provide consistent support.

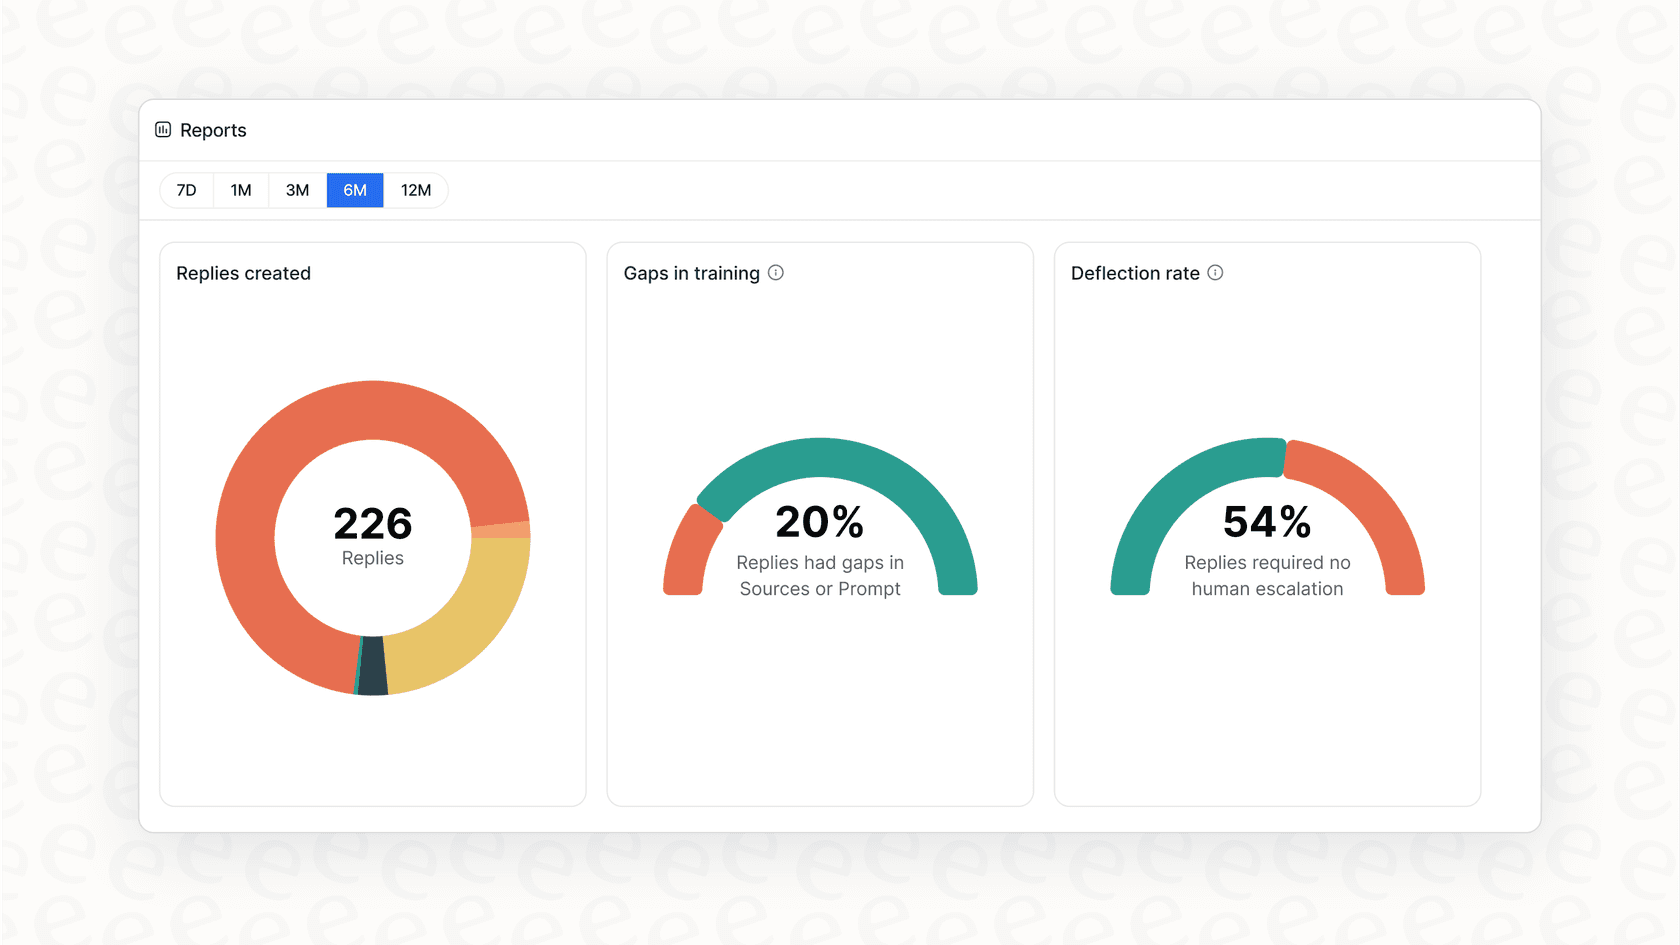
- Simulation capabilities: You can forecast impact by running simulations on your historical tickets. eesel AI shows you how many tickets it could have assisted with, providing a clear picture of potential efficiency gains.
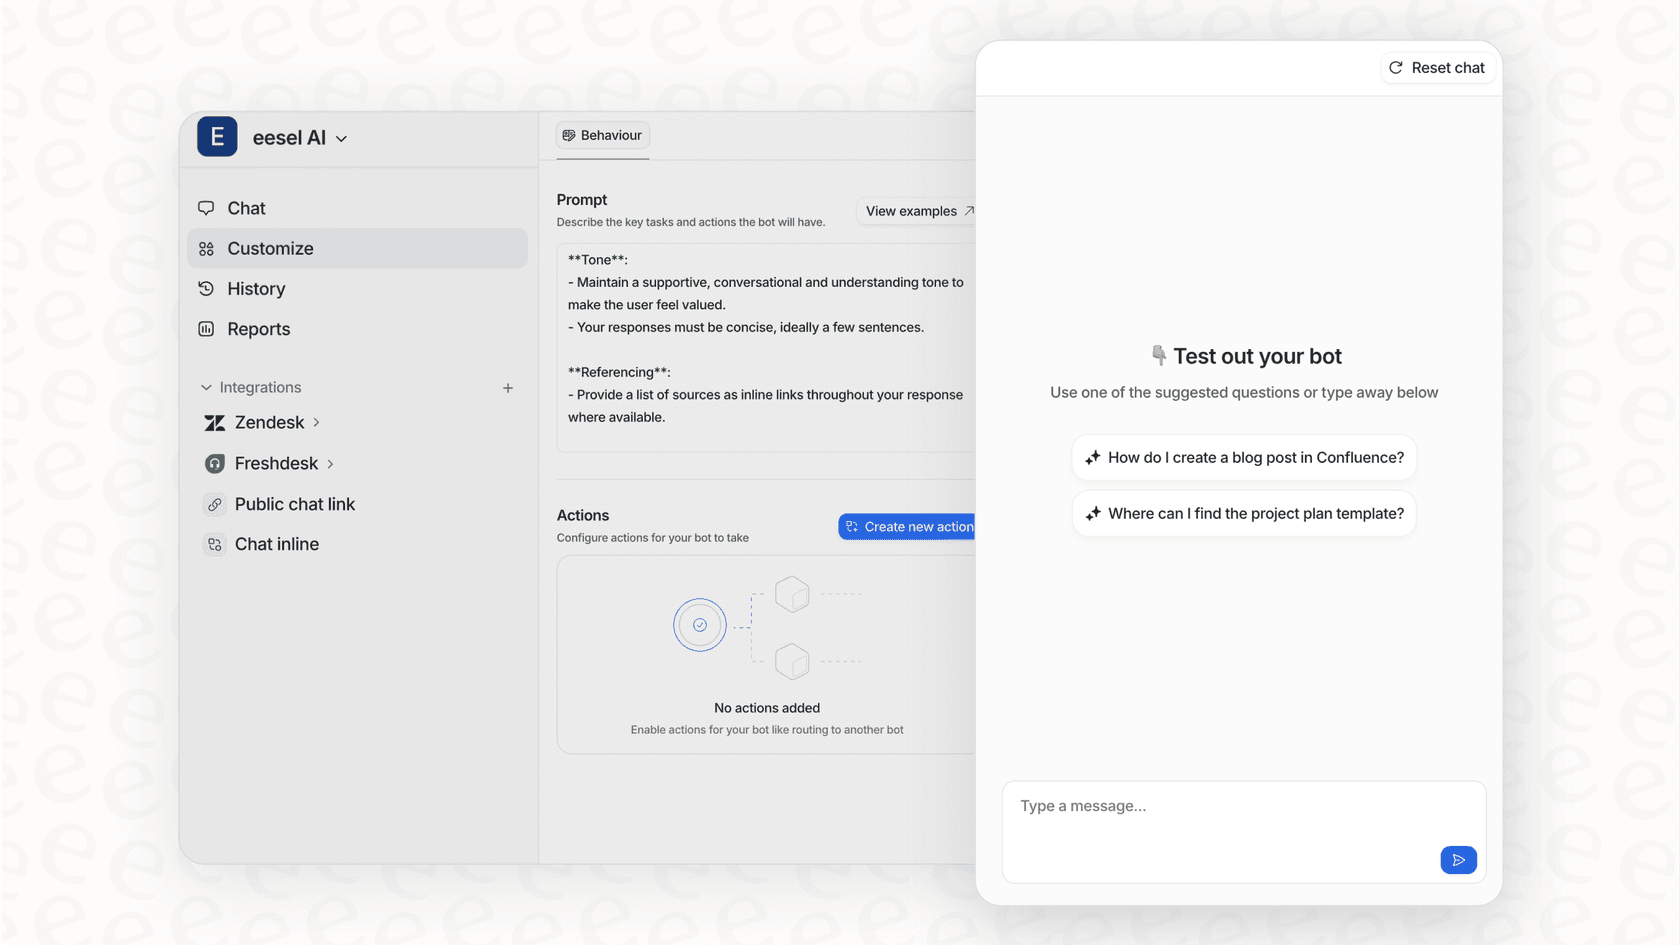
- Actionable analytics: The dashboard identifies gaps in your knowledge base and highlights emerging trends, giving you a clear roadmap for improving your self-service content.
Comparing the setup: Efficiency and integration
While a large-scale BI project can take significant time to implement, eesel AI is designed for rapid deployment. You can connect it to your Zendesk environment and your knowledge sources in minutes, allowing it to complement your existing setup without requiring a major overhaul.
Pricing and plans compared
Cost is an important part of your decision. Here’s how these options generally look in 2026.
Zendesk Suite pricing
Zendesk’s reporting features are included in its Suite plans. Each tier offers increasingly sophisticated capabilities to match your team's growth.
| Plan | Price (per agent/month, billed annually) | Key Analytics Features |
|---|---|---|
| Suite Team | $55 | Prebuilt analytics dashboards |
| Suite Professional | $115 | Customizable reporting with real-time insights, CSAT surveys |
| Suite Enterprise | $169 | Advanced features like visual data alerts and custom agent roles |
(Pricing from Zendesk's official page as of early 2026.)
Investment considerations for external BI tools like Power BI
While the Power BI license itself is competitively priced, the total investment for a business includes:
- ETL Services: Solutions like Stitch or Fivetran are billed based on data volume.
- Data Storage: Platforms like Snowflake or Google BigQuery represent an additional usage-based cost.
- Professional Expertise: The cost of the technical talent required to manage the infrastructure.
eesel AI's straightforward pricing
eesel AI offers a transparent model based on features and usage, designed to scale with your needs.

| Plan | Effective /mo (Annual) | AI Interactions/mo | Key Features |
|---|---|---|---|
| Team | $239 | Up to 1,000 | Train on docs, Copilot for help desk, Slack. |
| Business | $639 | Up to 3,000 | Everything in Team + train on past tickets, AI Actions, bulk simulation. |
This model provides predictability, helping you avoid the multi-vendor complexity of traditional BI projects.
Which Zendesk BI tools approach is right for your team?
Choosing the right tool depends on your specific objectives.
If you need immediate, reliable reporting on your core support activities, Zendesk Explore is the gold standard and the perfect place to start. If your organization has a dedicated data team and requires deep, cross-functional analysis across multiple departments, an external BI tool like Power BI is a robust choice for your long-term strategy.
If your goal is to use your data to actively drive efficiency and automate resolutions in real-time, an AI-native tool like eesel AI is an excellent complementary option to make your Zendesk setup even more powerful.
Start turning insights into action
Ready to maximize the value of your Zendesk data? With eesel AI, you can enhance your support capabilities and drive automated resolutions in minutes.
Start your free trial with eesel AI today.
Frequently asked questions
Zendesk BI tools are applications that help you collect, organize, and visualize your support data. They are crucial for understanding customer needs, identifying product issues, and [improving agent performance](https://www.eesel.ai/blog/zendesk-reporting-analytics) by uncovering patterns you might otherwise miss.
Native Zendesk BI tools are built-in and designed specifically for support teams, offering a user-friendly experience for core reporting. External platforms offer advanced data integration across your entire business for specialized analytics, which often involves different technical requirements and resource considerations.
Built-in Zendesk BI tools are highly effective for standard support metrics. Teams with highly specialized reporting needs may occasionally look to integrations to combine Zendesk data with other business systems or to share insights with stakeholders who do not use the Zendesk platform daily.
Yes, integrating external Zendesk BI tools like Power BI typically requires a significant technical effort. It often involves building data pipelines using ETL tools and a [data warehouse](https://panoply.io/connectors/zendesk/analytics/), which demands expertise and can take time to implement and maintain.
Traditional Zendesk BI tools are excellent for historical analysis and trend spotting. An AI-native approach, however, focuses on real-time data to [automate resolutions](https://www.eesel.ai/blog/zendesk-automations-explained-features-limitations-and-alternatives) and provide immediate, actionable recommendations within the workflow.
The AI-native approach, exemplified by eesel AI, complements traditional analysis. It uses AI to proactively automate resolutions, route tickets, and [assist agents](https://eesel.ai/solution/ai-agent-assist) in real-time, working alongside Zendesk’s reporting tools which focus on retrospective dashboards.
Beyond the Power BI license, [considerations for external Zendesk BI tools](https://www.eesel.ai/blog/zendesk-support-pricing-explained-in-2025) include resources for ETL (Extract, Transform, Load) tools, data warehousing solutions, and the dedicated time of a data professional required for setup and maintenance.
Share this article

Article by
Stevia Putri
Stevia Putri is a marketing generalist at eesel AI, where she helps turn powerful AI tools into stories that resonate. She’s driven by curiosity, clarity, and the human side of technology.