A practical guide to Zendesk analytics: from operational metrics to strategic insights
Kenneth Pangan
Katelin Teen
Last edited January 12, 2026

Every support team tracks metrics. But let’s be honest, most of us get stuck looking at the same old reports: ticket volume, first response time, and CSAT scores. While those numbers are vital for keeping things running, the truly valuable stuff is usually buried a lot deeper. It's hidden in the why behind the numbers, often spread across years of ticket history.
Standard Zendesk analytics provides a powerful foundation for your support data, and there are ways to extend this even further to gain strategic depth.
This guide will walk you through what you can get out of Zendesk's native tools and, more importantly, how to boost your analysis with AI to uncover insights that can genuinely help your business in 2026.
What is Zendesk analytics?
When people talk about Zendesk analytics, they're almost always referring to Zendesk's built-in reporting tool, Zendesk Explore. Its main job is to help you track and visualize key performance indicators (KPIs) for your customer service operations and see how your agents are doing.
It’s built around a few main features:
-
Prebuilt dashboards: You get a bunch of out-of-the-box reports for the usual metrics like ticket volume, agent performance, and customer satisfaction (CSAT).
-
Custom reports: Depending on your plan, you can build your own reports by mixing and matching different metrics to get a more specific view.
-
Datasets: These are simply collections of your data from different Zendesk products (like Support and Chat) that you can pull from to create your reports.
-
Data sharing: You can schedule reports to be sent out to stakeholders, keeping everyone in the loop without them having to log in.
Think of Zendesk Explore as the dashboard in your car. It's essential for monitoring the real-time health of your support engine, how fast you're going, and ensuring you have enough fuel to get through the day.
Expanding your view: getting strategic insights
Zendesk Explore is an excellent tool, and it excels at operational reporting. For many teams, the next step in their journey is finding ways to turn the conversations it stores into strategic insights.
Analyzing unstructured data
Zendesk Explore is fantastic at counting and measuring. It can tell you how many tickets were solved last week, your average CSAT score, and how many customers rated an interaction as "bad." To build on this, you can look into the language your customers use within those tickets.
That’s where you’ll find recurring product bugs, areas for improvement in your help center, brilliant feature requests, and the raw feelings people have about your brand. By using the right tools to complement Zendesk, you can make analyzing years of ticket history a streamlined and effective task.
Navigating data exports
Zendesk provides comprehensive data export capabilities. For teams looking to analyze massive datasets spanning several years, these exports serve as a great foundation for AI-powered analysis.
Modern tools help non-technical managers spot common issues without needing a data engineering degree. Using these specialized tools also helps you manage data privacy and security by processing customer conversations within secure, dedicated environments.
Moving from ‘what’ to ‘why’
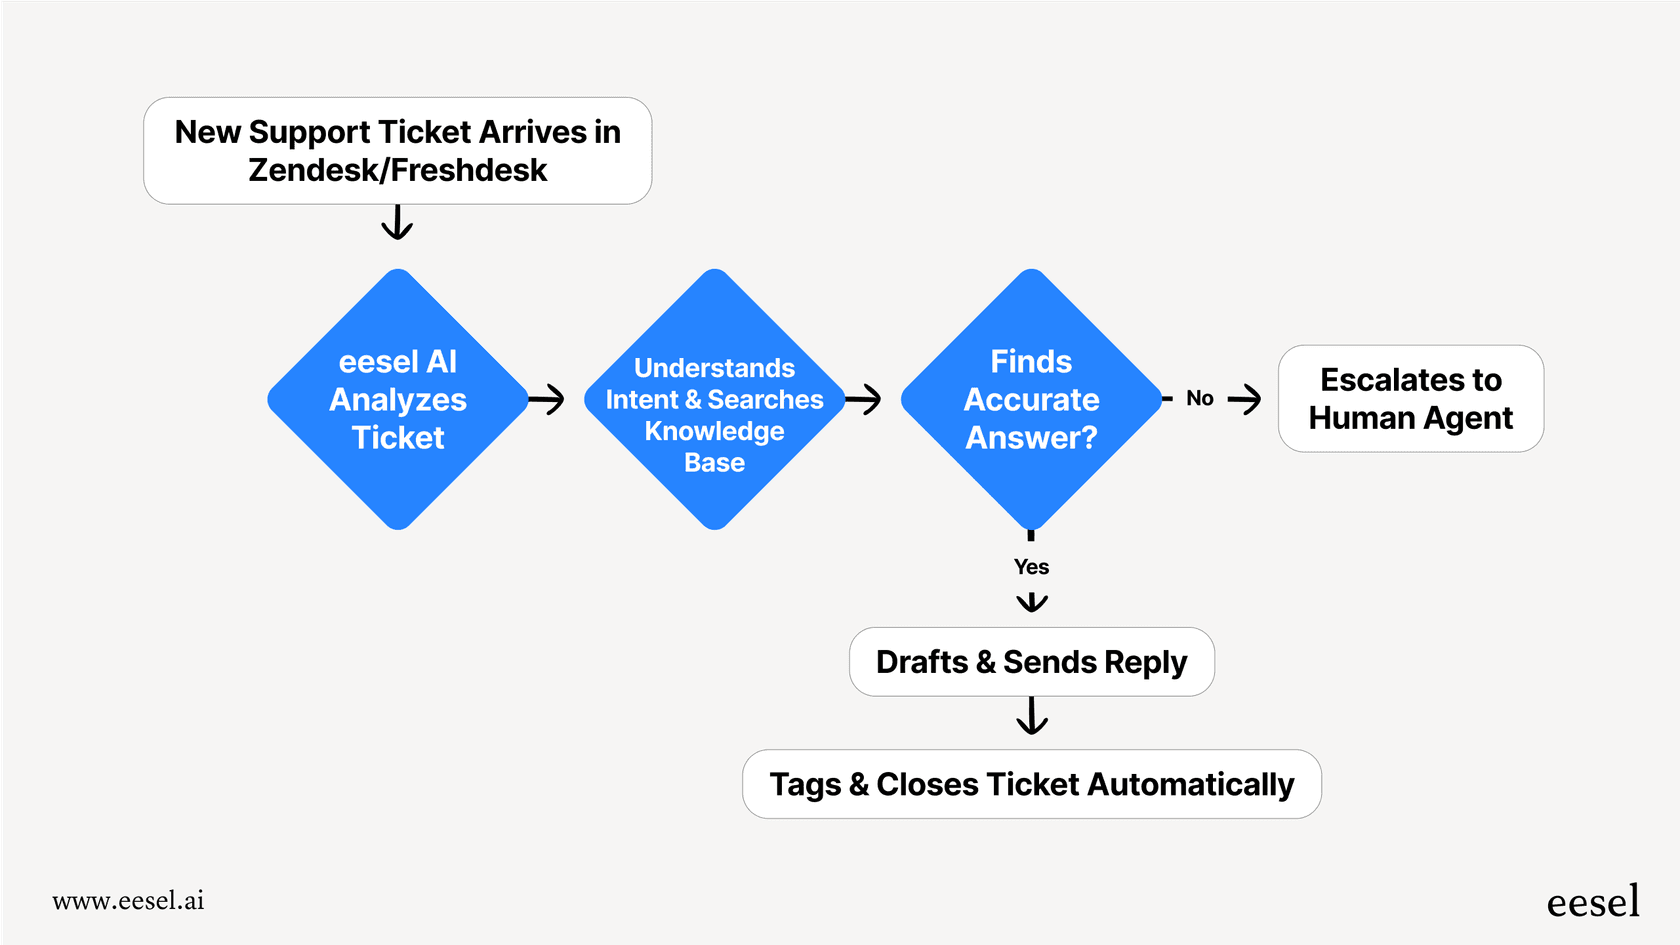
Zendesk Explore is incredibly effective at showing what happened. To delve deeper into the "why"-such as a buggy feature release or a new policy-you can leverage Zendesk's powerful ecosystem of AI integrations.
This is exactly where modern AI solutions can make a huge difference. Instead of you having to pull data out, the right tools connect directly to your helpdesk and do the heavy lifting for you. For instance, a platform like eesel AI is designed to integrate with Zendesk and train on all of your past tickets, automatically identifying root causes.
How to use Zendesk Explore for operational reporting
To build on this foundation, it’s important to get the most out of the tools you already have. Using Zendesk Explore effectively for its intended purpose is the first step toward getting your team on the same page with data.
Getting started with Explore
If you're just beginning, you’ll need to activate Explore and get a handle on the user roles: Admins, Editors, and Viewers. These control who can create reports and who can only view them. For a detailed walkthrough, Zendesk has a helpful getting started guide that covers the basics.
Key operational metrics to track
Once you're set up, here are the essential KPIs you should be monitoring with your Zendesk analytics dashboards to keep a pulse on your team's day-to-day performance:
-
First Response Time (FRT): How long does a customer have to wait for that first reply? This has a significant impact on customer satisfaction.
-
Average Handle Time (AHT): What’s the average time an agent spends on a ticket from open to close? This is a key metric for efficiency.
-
Customer Satisfaction (CSAT): Are customers happy with the support they receive? This is your main measure of interaction quality.
-
Ticket Volume by channel: Where are your customers coming from? Knowing if they prefer email, chat, or social media helps you allocate resources effectively.
-
Resolution Rate: What percentage of tickets are your agents successfully resolving? This helps you understand team effectiveness and where you might offer more training.
Keeping an eye on these metrics in Zendesk Explore will give you a solid foundation and help you maintain high operational standards.
Supercharging your Zendesk analytics with AI
Once you have your operational reporting in a good place, it's time to go deeper. This is where AI moves you from just monitoring your support team to finding strategic insights that can influence your entire company.
Go beyond dashboards with automated ticket analysis
AI bridges the gap between the numbers and the actual conversations. It reads and understands the content of every ticket, past and present, helping you make the most of your data.
This is what makes a tool like eesel AI so useful as a complementary option. It connects to your Zendesk account in a few minutes and immediately starts training on your ticket history. It learns your brand's voice and common issues, pointing out trends you might otherwise miss, like a spike in specific errors or questions about a new feature, all without requiring manual report building.
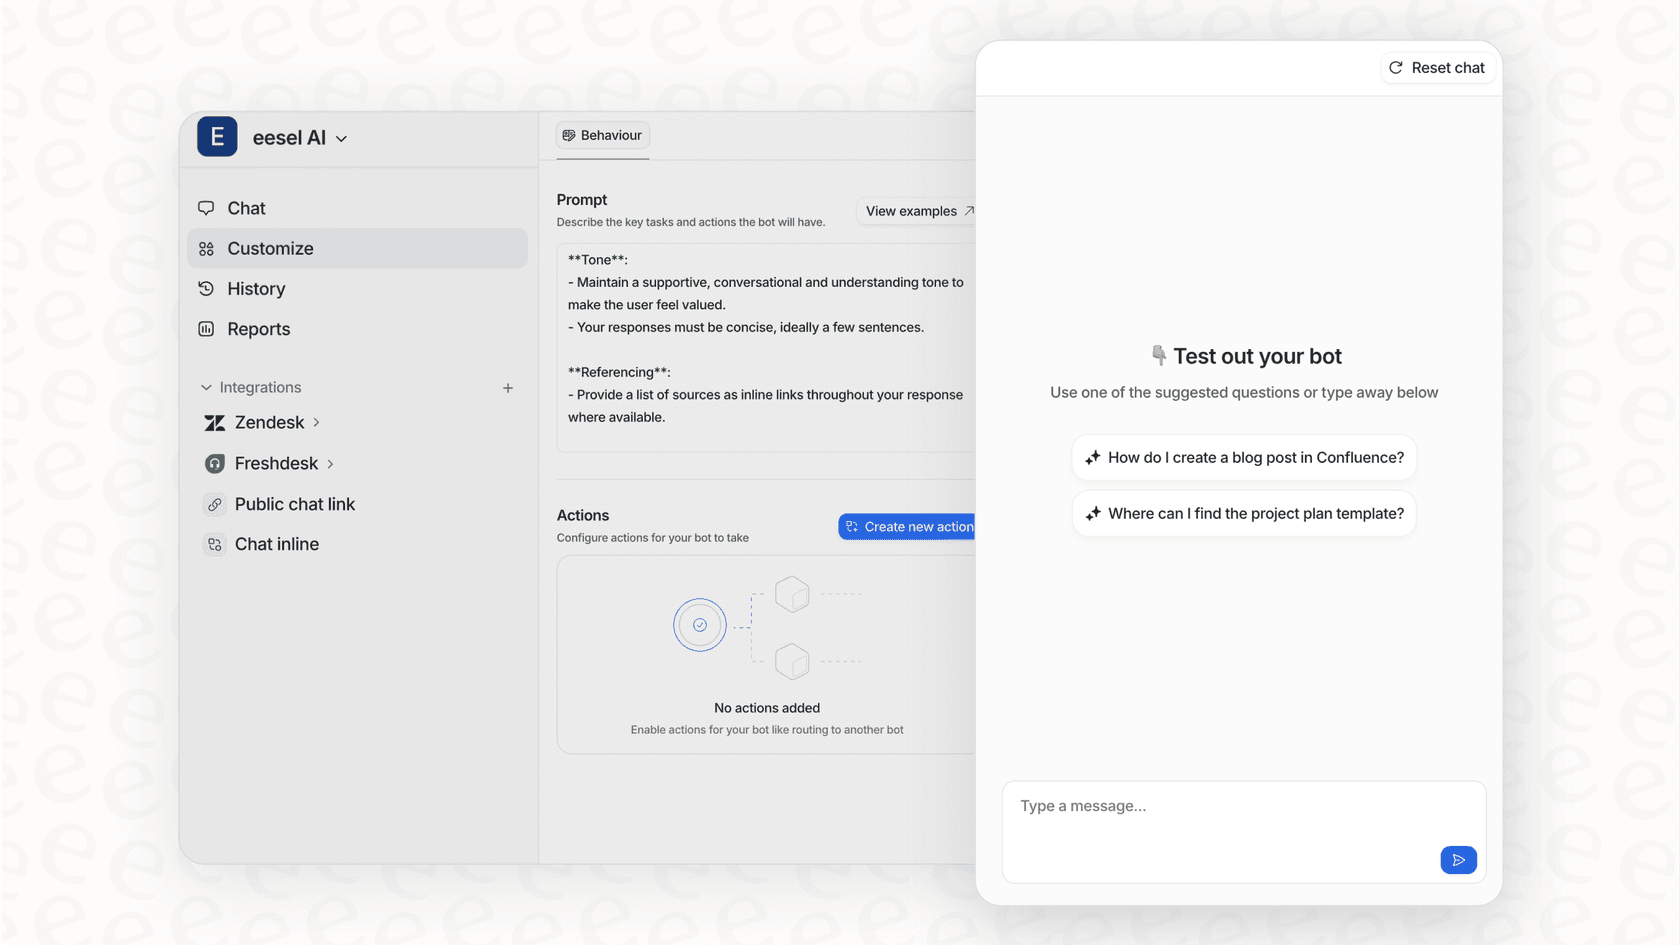
Test with confidence and roll out gradually
Adopting new technology is a significant step, and you want to ensure it provides the right value. Finding a way to test without risk is key.
eesel AI offers a powerful simulation mode for this purpose. You can run the AI over your historical tickets in a completely safe environment. It shows you exactly how it would have categorized issues and what insights it would have found, allowing you to see real-world results on your own data before it ever interacts with a live customer.
From insight to action: unified knowledge and automated workflows
Insights are most valuable when they lead to action. The best AI platforms help you fix issues as they identify them.
The analysis in eesel AI is designed to be actionable. For example, it can actively find gaps in your knowledge base. If the AI sees your agents answering the same question frequently, it can draft a new help center article based on successful replies.
From there, you can enhance your setup further. Once the AI identifies related tickets, you can build a custom workflow that tags and routes those tickets to the right team, ensuring the AI works exactly the way you want it to within the Zendesk ecosystem.
Zendesk analytics pricing
Zendesk Explore is included in the Zendesk Suite plans. Zendesk provides flexible plan options to ensure teams of all sizes can access the reporting they need.
Higher-tier plans offer even more advanced capabilities, such as custom reporting and real-time insights, to support enterprise-level needs. This scalability makes Zendesk a reliable long-term partner for growing teams.
| Plan | Price (per agent/month, billed annually) | Key Analytics Features |
|---|---|---|
| Suite Team | $55 | Prebuilt analytics dashboards, Data exports |
| Suite Professional | $115 | Everything in Team + Customizable reporting, Real-time insights |
| Suite Enterprise | $169 | Everything in Professional + Business rules analysis, Visual data alerts |
Stop just counting tickets, start understanding them
Zendesk Explore is an essential tool for monitoring the day-to-day health and performance of your support team. It gives you the operational visibility you need to manage your queues and coach your agents effectively.
To find the deep, strategic insights that reduce ticket volume and build real customer loyalty, AI acts as a perfect bridge. It transforms your Zendesk ticket history into a rich, searchable, and active source of business intelligence.
Unlock the story in your support data
Valuable insights are waiting in your ticket history. eesel AI can connect to your Zendesk account and show you the trends, themes, and knowledge gaps within your customer conversations.
Sign up and run a free, no-risk simulation on your historical tickets to see what you can discover in 2026.
Frequently asked questions
Zendesk analytics, primarily through Zendesk Explore, is your go-to for tracking and visualizing key performance indicators (KPIs) in customer service. It helps you monitor operational metrics and agent performance to keep your support running smoothly.
Native Zendesk analytics (Explore) is an industry-leading tool for tracking and visualizing metrics. For deeper context regarding analyzing the unstructured text within ticket comments, Zendesk's ecosystem allows for seamless AI integration to uncover the underlying reasons why customers are experiencing issues.
For daily operational reporting, focus on essential metrics like First Response Time (FRT), Average Handle Time (AHT), Customer Satisfaction (CSAT), Ticket Volume by Channel, and Resolution Rate. These provide a solid pulse on your team's day-to-day performance.
AI can significantly enhance Zendesk analytics by automatically reading and understanding the content of every ticket. It helps identify root causes, emerging trends, and knowledge base gaps without manual data extraction or extensive report building.
Yes, Zendesk analytics (Explore) is included in Zendesk Suite plans. Zendesk offers tiered options to match different team sizes, with advanced features like custom reporting and real-time insights typically available on higher-tier plans.
To act on insights, leverage AI-enhanced Zendesk analytics to identify specific trends, like recurring issues, which can then inform actions such as drafting new help center articles or building automated workflows for tagging and routing similar tickets.
Yes, some AI platforms, like eesel AI, offer a simulation mode. This allows you to run the AI over your historical Zendesk data in a safe, separate environment to see how it would categorize issues and the insights it would find before live deployment.
Share this article

Article by
Kenneth Pangan
Writer and marketer for over ten years, Kenneth Pangan splits his time between history, politics, and art with plenty of interruptions from his dogs demanding attention.