If you're running an e-commerce brand, chances are you use a tool like Gorgias to handle customer support. It’s a powerful and reliable helpdesk that powers support for thousands of brands. The real path to growth comes from digging into your data and actually understanding what your customers are saying and how your team is performing.
Gorgias gives you a comprehensive set of built-in analytics that help you keep your operations running smoothly. As your team grows, you might look for ways to build upon these reports to truly level up your support operations. In this guide, we'll walk through what the native Gorgias analytics can do and how you can layer in modern AI tools to get even more detailed answers.
What is Gorgias analytics?
Gorgias analytics is the robust reporting toolset built right into the Gorgias platform. It’s designed to give you a clear overview of your support performance without needing to export data or use another app.

You’ll find most of it under the "Statistics" tab in your dashboard. It’s flexible and user-friendly, letting you filter data by date ranges, agents, channels, and tags. According to their own docs, the main reports you'll be using are:
-
Support performance: Your main dashboard for team and individual agent metrics.
-
AI Agent report: A specific report to see how Gorgias's own automation features are performing.
-
Live statistics: A real-time look at ticket volume and what agents are working on at this moment.
-
Custom dashboards: Lets you build your own views to track the specific KPIs that matter most to your team.
Think of it as the central control panel for your support desk, providing all the essential readouts for effective day-to-day monitoring.
Key metrics you can track with native Gorgias analytics
So, what can you measure straight out of the box? Gorgias splits its analytics into several useful areas, helping you keep an eye on both your human agents and your automated workflows.
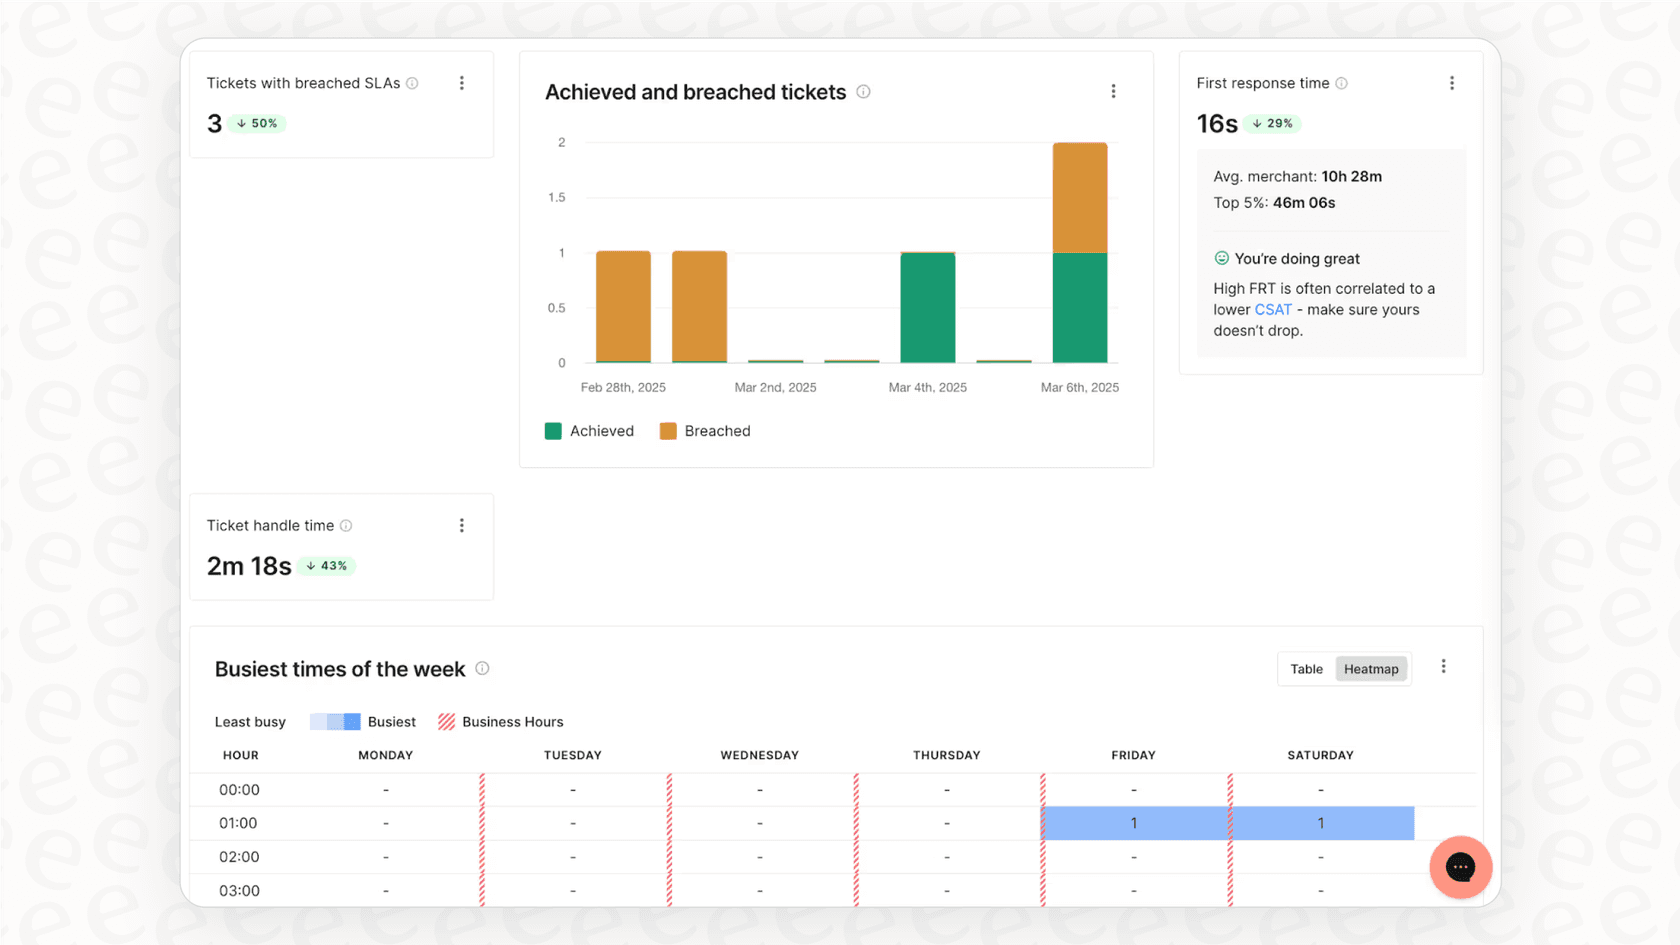
Agent and team performance metrics
This is the core of any professional support analytics tool. Gorgias provides the essential metrics you need to see how your team is handling the queue.
-
First Response Time (FRT): A vital metric that measures how long a customer waits for that first reply after opening a ticket.
-
Resolution Time: This tracks a ticket's entire journey, from the moment it’s created to when it’s successfully resolved.
-
Closed Tickets: A clear count of how many tickets an agent or the team has resolved over a specific period.
-
Customer Satisfaction (CSAT): This pulls in the average score from the satisfaction surveys you send out after a conversation ends, giving you direct feedback from customers.
-
One-Touch Tickets: An efficiency metric that shows the percentage of tickets solved with just a single reply from your agent.
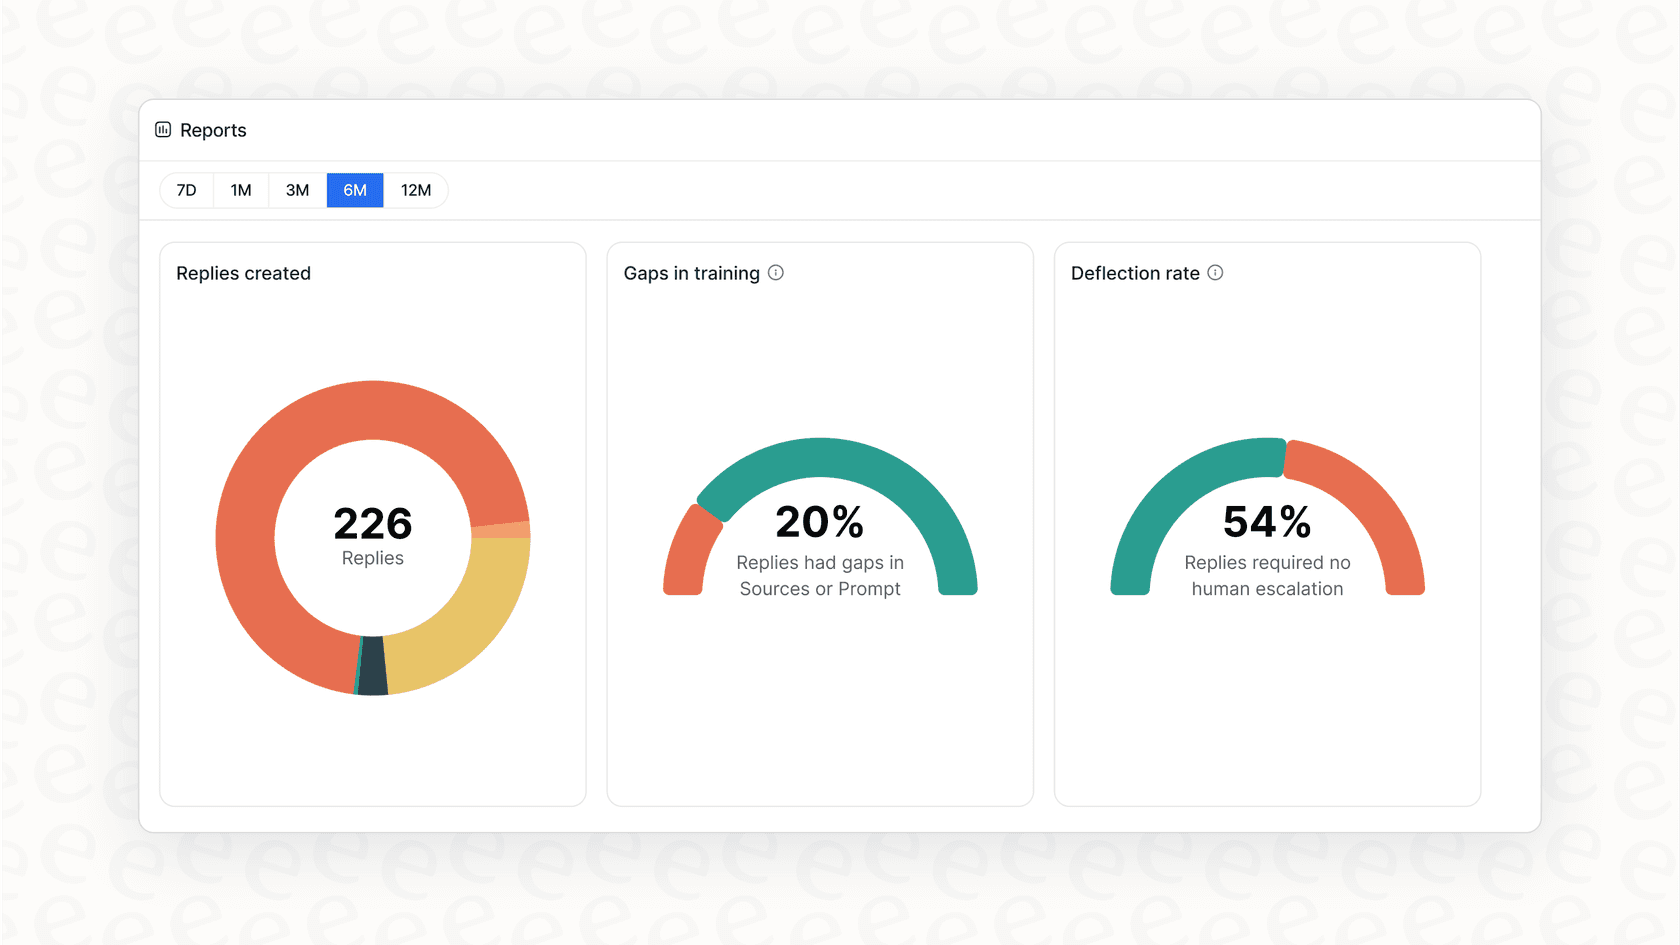
AI performance and ticket intent
If you're using the Gorgias AI Agent, it comes with its own specialized report to track performance. This is where you can gauge the positive impact of automation on your support load.
The report breaks down several key areas:
-
Automated Interactions: This counts how many tickets the AI handled independently, providing quick resolutions for customers.
-
AI Intent: Gorgias accurately categorizes what each ticket is about (like "order status" or "refund request"), helping you identify the most common customer needs.
-
AI Agent Outcome: This shows you the result of the AI's work, whether it successfully resolved the ticket or appropriately passed it to a human agent for more complex help.
This data is incredibly helpful for identifying which types of questions your AI handles best and where you can provide more information to improve it.
Business intelligence and third-party integrations
Gorgias is a mature platform that offers great integrations to send your data to advanced business intelligence (BI) tools. Many brands connect Gorgias to platforms like Daasity or Glew to combine support data with sales and marketing information, creating a comprehensive view of the entire business.
It also includes a built-in integration for Google Analytics to track how customers interact with your Help Center, giving you a better understanding of self-service engagement.
Exploring opportunities to enhance Gorgias analytics
While the built-in reports are excellent for daily management, many teams find that as they scale in 2026, they want to add even more layers of depth to their data. Here are a few ways teams look to expand their reporting capabilities.
Adding more contextual insights
Gorgias analytics is great at showing you the data on what happened. To dive deeper into the specific context behind a trend - like a sudden change in response times - some teams choose to augment their setup with AI layers that can analyze the sentiment and specific details within ticket threads more deeply.
Connecting data across the organization
Gorgias analytics provides a focused and accurate look at everything happening within the helpdesk. For teams that want to see how these interactions connect to internal documentation in Confluence, product specs in Google Docs, or discussions in Slack, they can use integration tools to create a more unified knowledge ecosystem.
Advanced testing and simulation
While Gorgias is optimized for live performance, some teams like to have a dedicated environment to test new automation ideas on historical tickets. Using specialized complementary tools, you can simulate and forecast your potential automation rates and outcomes before going live, adding an extra layer of data-driven confidence to your strategy.
How to get more from your Gorgias analytics with an AI platform
Instead of making major changes to your tech stack, you can simply add a complementary AI layer on top of your existing Gorgias setup. A platform like eesel AI plugs directly into Gorgias, enhancing its capabilities while keeping your team's workflow intact.
Unify knowledge sources for even more accurate reporting
eesel AI works within the Gorgias ecosystem to help break down data silos. You can connect it to all of your company knowledge, allowing your AI to pull from Confluence, Google Docs, Notion, Slack, and more.

This gives the AI an even broader picture of your business, leading to more accurate answers and higher automation rates. Your Gorgias analytics will reflect an even more efficient support operation as a result.
Simulate performance and forecast ROI alongside Gorgias analytics
With eesel AI, you can test your AI setup on thousands of historical tickets before it interacts with live customers. This is a perfect complement to the live reporting you already get in Gorgias.

You can see exactly how the AI would have responded to real customer questions in the past, allowing you to fine-tune its behavior. This simulation provides a clear, data-backed forecast of your potential results, helping you make informed decisions for 2026.
Get reporting that identifies new knowledge opportunities
The reporting in eesel AI is designed to be a helpful addition to your Gorgias dashboard. It analyzes conversations where the AI couldn't find a complete answer and highlights specific areas where you can add to your knowledge base, effectively creating a helpful roadmap for documentation updates.
It even includes a feature that can help draft new knowledge base articles based on successful resolutions from your human agents, helping you turn your team's expertise into helpful self-service content.
A look at Gorgias's tiered pricing options
To understand the full value, it helps to see how Gorgias structures its pricing. Gorgias offers tiered plans to match different team sizes and ticket volumes, ensuring you only pay for what you need.
The AI Agent is a powerful add-on that scales with your automated interactions.
| Plan | Monthly Price | Billable Tickets/mo | Overage Cost | AI Agent Cost (per interaction) |
|---|---|---|---|---|
| Starter | $10/mo | 50 | $0.40/ticket | $1.00 |
| Basic | $60/mo | 300 | $40/100 tickets | $0.90 - $1.00 |
| Pro | $360/mo | 2,000 | $36/100 tickets | $0.90 |
| Advanced | $900/mo | 5,000 | $36/100 tickets | $0.90 |
| Enterprise | Custom | Custom | Custom | $0.90 |
Gorgias's model allows you to scale up as your business grows. For teams looking for additional options, a platform like eesel AI offers a complementary pricing structure based on features and capacity, providing another way to manage your automation budget.
A better way to use Gorgias analytics for your support
Gorgias analytics is a powerful and reliable starting point for any professional support team. It provides the essential data you need to maintain a high level of service and keep your customers happy.
Replacing such a capable helpdesk is a massive project, and often unnecessary. The smarter move is to enhance the robust tool you already have. A platform like eesel AI is self-serve and easy to set up. It plugs directly into your Gorgias workflow and provides additional simulation, unified knowledge, and useful context, making your Gorgias setup even more effective.
Why not see for yourself? You can connect your Gorgias account and run a free, no-risk simulation to see how you can further enhance your automation results today.
Frequently asked questions
What exactly is Gorgias analytics, and where can I access it within the platform?
Gorgias analytics is the built-in reporting toolset within the Gorgias platform, designed to provide an overview of your support performance. You can typically find it under the "Statistics" tab in your Gorgias dashboard.
What key performance metrics can I track with native Gorgias analytics?
With native Gorgias analytics, you can track essential metrics like First Response Time (FRT), Resolution Time, Closed Tickets, Customer Satisfaction (CSAT), and One-Touch Tickets. It also provides specific reports for AI Agent performance, including automated interactions and AI intent.
How can I expand on native Gorgias analytics for even deeper strategic improvements?
While Gorgias analytics provides a robust foundation, teams looking for even deeper contextual insights can supplement their data with specialized AI analytics layers. This helps connect support trends with broader business intelligence and allows for more advanced simulation of automation performance.
Can Gorgias analytics help me understand the root causes behind changes in support performance?
Gorgias analytics does an excellent job of showing you the trends in your support metrics. To dive deeper into the specific context or 'why' behind these numbers, many teams choose to augment Gorgias with an advanced AI layer that provides additional contextual insights.
How can I integrate Gorgias analytics with other business data for a complete view?
Gorgias offers excellent integration capabilities, allowing you to export data to external business intelligence tools or connect with platforms like eesel AI. This allows you to unify support data with information from other departments, providing a holistic business view.
Does Gorgias analytics allow me to test the impact of AI automation on historical data?
Native Gorgias analytics focuses on live and historical performance reporting. To specifically simulate or forecast the impact of new AI automation on past tickets before deployment, you can use complementary tools that integrate seamlessly with the Gorgias platform.
How does an external AI platform enhance the capabilities of Gorgias analytics for better reporting?
An external AI platform, such as eesel AI, works alongside Gorgias analytics by unifying more knowledge sources and enabling simulation of AI performance. This provides additional reporting that helps identify specific knowledge gaps and suggests new content for continuous improvement.