Zendesk Guide community analytics: A complete guide for 2026
Stevia Putri
Last edited February 25, 2026
Community forums can be a goldmine of customer insights. But only if you are actually tracking what happens inside them. Zendesk Guide community analytics gives you visibility into how your community is performing, what your customers care about, and where you might be missing opportunities to help them.
Here is a breakdown of what is available, how to access it, and what you should actually do with the data once you have it.
What is Zendesk Guide community analytics?
At its core, community analytics is the practice of measuring activity in your Zendesk Guide community forums. Think of it like a health check for your community: it tells you how active your members are, which topics are getting traction, and whether people are finding what they need.
The data available includes:
- Posts: How many new discussions are being started
- Views: How many times posts are being read (including by your agents)
- Votes: Upvotes and downvotes on posts
- Comments: Replies and discussions happening on posts
- Subscriptions: Users following topics or specific posts
Why does this matter? Because a community that is not measured tends to stagnate. You might have dozens of unanswered questions sitting in your forums, or popular topics that should be turned into knowledge base articles. Without analytics, you are flying blind.
Teams often set up communities with good intentions, but without regular monitoring, they become ghost towns or messy repositories of unanswered questions. Analytics helps you stay on top of it.
Analytics options: What you get at each plan level
Here is where it gets a bit complicated. Zendesk offers two tiers of community analytics depending on your plan.
Without Zendesk Explore (Basic reporting)
If you are on a Professional, Enterprise, or Enterprise Plus Support plan, you get access to basic community reporting right inside Zendesk Support.
To access it: Go to Support > Reporting > Community tab.

You will see five core datasets:
- Posts: Total new posts created during the reporting period
- Views: Total views (including internal agent views)
- Net Votes: The difference between upvotes and downvotes
- Subscriptions: Total subscriptions to topics and posts
- Comments: Total comments added to posts
The limitations here are real. You cannot filter by specific topics, you cannot see upvotes and downvotes separately (just the net), and you cannot create custom reports. But for smaller communities or teams just getting started, it covers the basics.
With Zendesk Explore (Advanced analytics)
If you have Zendesk Explore (available on Explore Light, Professional, or Enterprise plans), you get a significantly more powerful setup.
Access it through: Analytics > Zendesk Knowledge dashboard > Community tab.
The prebuilt Community dashboard includes 10+ reports:
- Headline metrics (posts, views, votes, subscriptions, comments)
- Posts by user role (staff vs. end users)
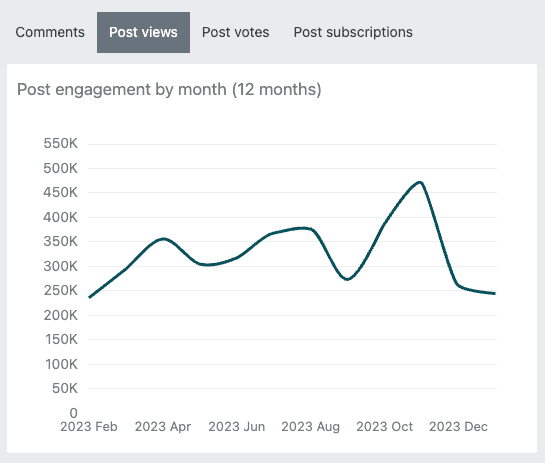
- Post engagement by date and month
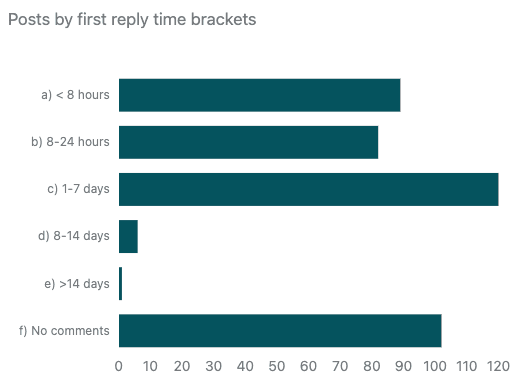
- Posts by first reply time brackets
- Active members table
- Community engagement overview
You can filter by brand, channel, topic title, and user role. You can also clone dashboards and create custom reports if the prebuilt ones do not show exactly what you need.
One thing to note: the Community dashboard only reflects data from February 9, 2022 onwards. If you need historical data before that, it is not available.
Plan comparison
| Feature | Without Explore | With Explore |
|---|---|---|
| Posts metric | ✅ | ✅ |
| Views metric | ✅ | ✅ |
| Votes tracking | Net votes only | Upvotes + downvotes separately |
| Comments metric | ✅ | ✅ |
| Subscriptions | ✅ | ✅ |
| Custom reports | ❌ | ✅ |
| Filter by topic | Limited | ✅ |
| Filter by user role | ❌ | ✅ |
| Data export | Limited | ✅ |
| Real-time data | ❌ | Live dashboards available |
Bottom line? If community is a serious channel for your support strategy, Explore is worth the investment. The ability to segment by topic and user role alone makes it much more actionable.
Key community metrics explained (and what to do with them)
Having data is one thing. Knowing what to do with it is another. Let us look at each key metric and how to turn it into action.
Posts and post creation trends
This tracks how many new posts are being created over time.
Why it matters: Post volume is a direct indicator of community engagement. Growing post counts usually mean your community is gaining traction. Declining numbers might indicate people are either finding answers elsewhere or have stopped engaging.
What to do with it: If you see a decline, ask why. Are your topic categories too broad? Is the community hard to find? Are questions going unanswered, discouraging new posts? Sometimes adding more specific topics or promoting the community in your help center can reignite activity.
Views and engagement
This shows how many times posts are being viewed.
Why it matters: Views tell you about reach. Even if people are not posting, they might be reading. High views with low posts could indicate a "lurker" community, which is not necessarily bad, but it does mean you have an opportunity to convert readers into participants.
What to do with it: If certain posts have high views but few comments, consider adding a call to action at the end. Something simple like "Have a similar question? Post it here" can help convert passive readers into active community members.
Votes (upvotes and downvotes)
Community feedback on post quality and usefulness.
Why it matters: Votes are a quick signal of what is working. Highly upvoted posts represent content your community finds valuable. Downvoted posts might be unclear, off-topic, or unhelpful.
What to do with it: Review your most upvoted posts monthly. Can any of them be turned into knowledge base articles? Popular community discussions often reveal gaps in your documentation. Teams using eesel AI's Zendesk integration use this data to identify their most-needed help center content.
Comments and reply time
Tracks discussions and how quickly your team responds.
Why it matters: Reply time directly impacts community health. Posts that sit unanswered for days send a message that the community is not monitored, which discourages future participation.
What to do with it: Set internal targets for first reply time. If you have Explore, use the "Posts by first reply time brackets" report to see how you are doing. Posts with no comments after 14 days should be reviewed: either answer them, close them, or create tickets from them if they need individual attention.
Active members
Shows who is participating and how much.
Why it matters: Every community has power users, the people who consistently answer questions and drive discussions. Identifying them helps you understand who your community champions are.
What to do with it: Recognize top contributors. This could be as simple as a thank-you message, or you might consider a formal community champion program. These users are doing free support work for you. Acknowledging that goes a long way.
Third-party analytics solutions
Sometimes native analytics are not enough. Here are scenarios where third-party tools make sense:
- You need deeper insights than Zendesk provides
- You want to track self-service effectiveness across help center and community
- You need search analytics to see what users are looking for
- You want content performance analysis beyond basic metrics
Swifteq Help Center Analytics
Swifteq's Help Center Analytics is a Zendesk Marketplace app that extends your analytics capabilities significantly.

Key features include:
- Search analytics: See what users are searching for, including unsuccessful searches
- Content performance: Track helpfulness votes and user feedback by article
- Self-Service Score: Measure how many visitors it takes to generate one ticket
- User journey tracking: See what users do after reading an article
- Conversion tracking: Percentage of article views that result in ticket creation
Pricing starts at €49 per month for up to 200,000 page views, with tiers up to €139 per month for 2 million views. Enterprise plans are available for larger deployments.
The app is privacy-focused (no PII stored) and installs with a simple script addition to your help center theme.
Lotus Themes add-ons
If you are looking to enhance community UI alongside analytics, Lotus Themes offers add-ons like Hot Posts for displaying popular content. This does not replace analytics, but it can help surface valuable community content to your users.
Turning community data into action
Data without action is just numbers on a screen. Here is how to actually use your community analytics to improve your support.
Identifying knowledge gaps
Your community is essentially a window into what customers cannot find in your help center. When you see the same questions coming up repeatedly in community posts, that is a signal.
Review your top posts by views and votes monthly. Which ones could have been answered by a knowledge base article? Create those articles, then link to them from the community posts. This both deflects future tickets and trains users to check the help center first.
Improving response times
Set up internal alerts for posts that have not received a comment within 24 hours. If you do not have Explore, this might be a manual check. With Explore, you can use the first reply time brackets to set benchmarks.
For posts that need individual attention, use Zendesk's "Create ticket from post" feature. This moves the conversation into your formal support queue where it will not get lost.
Building community engagement
Recognition drives participation. Pin helpful posts to highlight quality content. Close or merge duplicate discussions to keep the community organized. Consider featuring top contributors in a monthly spotlight.
The goal is to create a community where users feel heard and valued. Analytics helps you identify where you are succeeding and where you are falling short.
Scaling with AI
As communities grow, manual moderation becomes a bottleneck. This is where AI can help.
eesel AI is an AI teammate that integrates directly with Zendesk. It can monitor community posts, flag content that needs attention, draft responses to common questions, and route complex issues to human agents. The AI learns from your existing content (past tickets, help center articles, community discussions) so responses sound like they came from your team, not a generic bot.

The difference from Zendesk's built-in features is the learning capability. Instead of rigid rules, you are essentially training a team member who gets better over time.
Getting started with Zendesk Guide community analytics
If you are ready to start tracking your community performance, here is your action plan:
-
Enable your Help Center and community. You will need Guide Manager permissions for this. If you have not set up your community yet, start with Zendesk's getting started guide.
-
Access basic reporting. In Zendesk Support, go to Reporting > Community. Familiarize yourself with the five datasets and what they show.
-
Activate Explore if you have it. If your plan includes Explore, activate it and allow time for data preparation. Depending on your data volume, this could take minutes to hours.
-
Review the prebuilt Community dashboard. Once Explore is ready, check out the Community tab in the Zendesk Knowledge dashboard. Get a feel for what is available.
-
Set a regular review schedule. Whether weekly or monthly, put community analytics review on your calendar. Consistency matters more than frequency.
-
Create action items from insights. Every time you review the data, identify at least one action: a post to answer, a knowledge gap to fill, or a top contributor to thank.
If you are looking to take your community management further, consider how AI can help scale your efforts. eesel AI works alongside your existing Zendesk setup to monitor community activity, draft responses, and keep your community healthy as it grows. You can also explore eesel AI's full range of integrations to connect with your existing tools.
Frequently Asked Questions
Share this article

Article by
Stevia Putri
Stevia Putri is a marketing generalist at eesel AI, where she helps turn powerful AI tools into stories that resonate. She’s driven by curiosity, clarity, and the human side of technology.