Custom ticket fields are only useful if you can actually report on them. You might've carefully configured drop-downs for product categories, checkboxes for priority flags, or text fields for order numbers. But without proper reporting, that structured data just sits there, untapped.
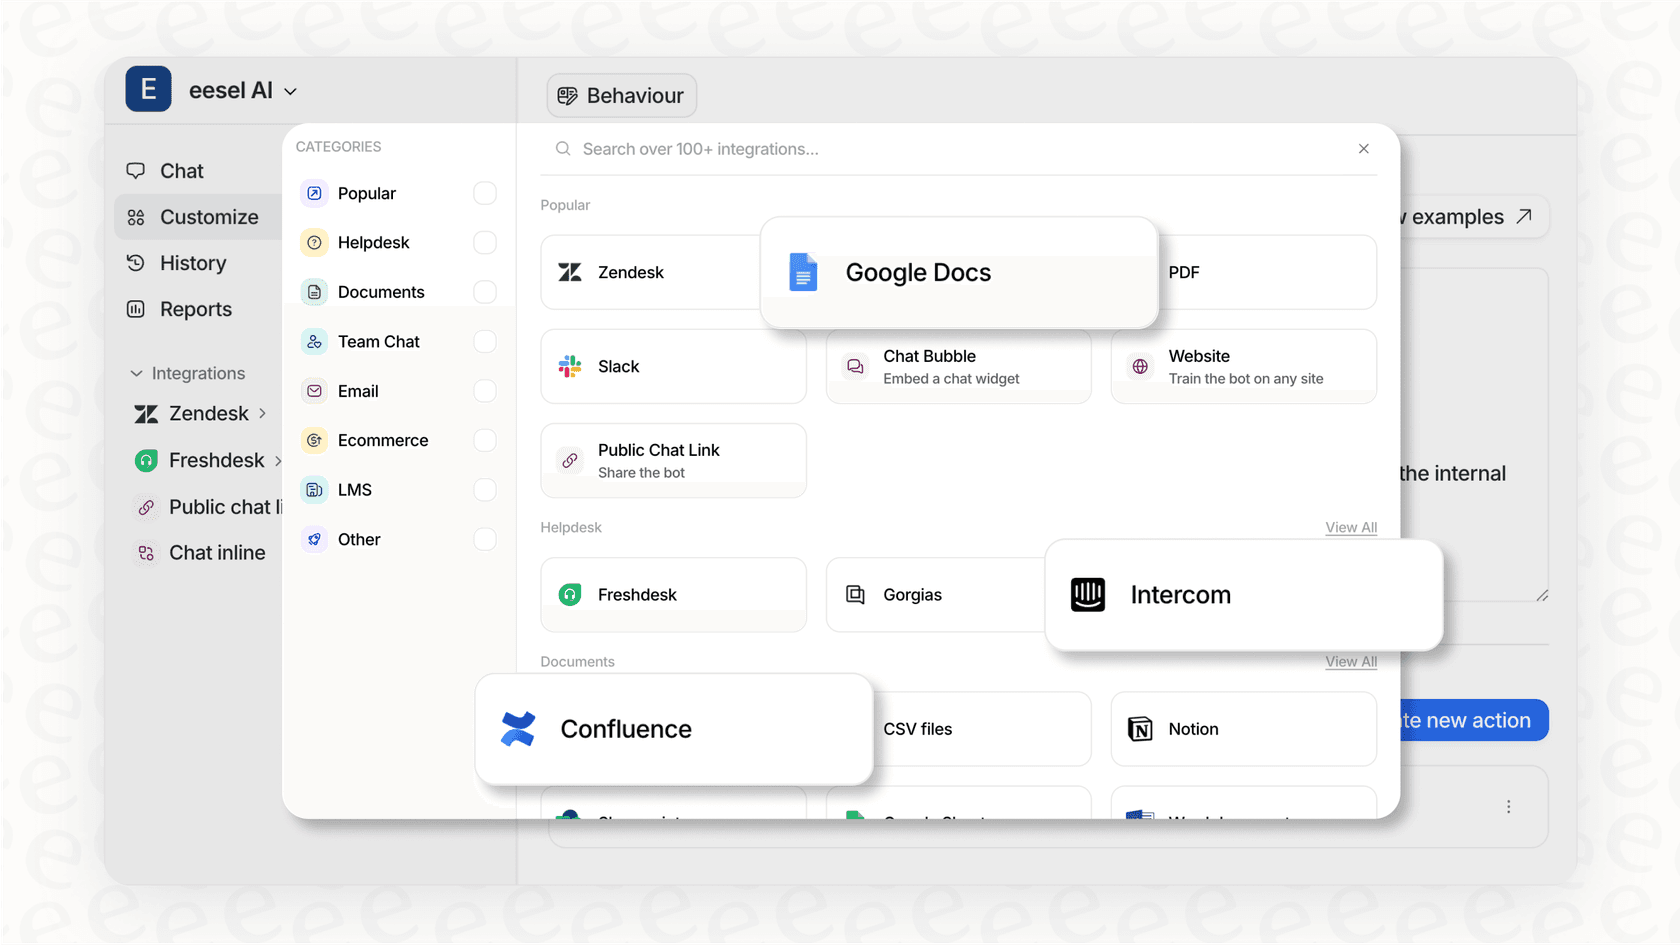
This guide walks you through five practical Zendesk Explore recipes for reporting on custom ticket fields. Whether you need a simple overview, trend analysis, or advanced duration tracking, you'll find step-by-step instructions here. We'll also look at how eesel AI's Zendesk AI agent can help you turn that reporting data into automated actions.

What you'll need to get started
Before diving into these recipes, make sure you've got the basics covered:
- Zendesk Explore Professional or Enterprise these features aren't available on the Lite plan
- Editor or Admin permissions in Explore viewers can't create or modify reports
- Custom ticket fields already created in Zendesk Support the fields need to exist before you can report on them
- Tickets actually using those fields empty fields won't show meaningful data
One thing that trips people up: non-numeric custom fields (drop-downs, multi-select, checkboxes, text) appear under the Ticket custom fields folder in the Rows or Columns panel. Numeric fields show up in the Metrics panel instead. If you can't find your field, double-check that you're looking in the right place.
Recipe 1: Creating a basic Zendesk Explore recipe for custom ticket fields overview
Let's start with the foundation: a simple table showing tickets broken down by a custom field value. This is the report you'll probably use most often.
- In Zendesk Explore, click the reports icon, then New report
- Select Support > Support - Tickets, then click Start report
- In the Metrics panel, click Add, select Tickets > Tickets, then click Apply
- In the Filters panel, click Add, select Time created - Date, and set a small time range (like the last week). This prevents timeouts while you're building
- In the Rows panel, click Add, expand Ticket custom fields, select your custom field (like "Product" or "Issue Type"), then click Apply
- Set the Visualization type to Table if it isn't already
- Give your report a descriptive name and click Save

This basic report answers questions like: "How many tickets did we get for each product last week?" or "Which issue types are most common?" You can add it to a dashboard, export it, or schedule regular deliveries. For more ways to streamline your support workflow, check out our AI Copilot.
Recipe 2: Counting tickets by custom field value
Sometimes a chart communicates better than a table. This recipe creates a column chart showing ticket volume by custom field value.
- Create a new report using the Support - Tickets dataset
- Add the Tickets metric
- Add your custom field to the Rows panel from the Ticket custom fields folder
- Explore automatically selects a Column chart visualization keep it, or switch to bar/pie if you prefer
- Save the report

Use this for presentations or dashboards where you want to spot patterns at a glance. High columns jump out immediately, making it easy to identify your top issues or most-requested products. Looking to automate ticket analysis? See how AI Triage can help.
Recipe 3: Tracking percentage change over time
Seeing current numbers is helpful. Seeing how those numbers changed from last month is actionable. This recipe shows percentage change broken down by custom field value.
- Create a new report with the Support - Tickets dataset
- From the Calculations menu, select Date range calculated metric
- Create your first metric:
- Name: Tickets created last month
- Original metric: Tickets
- Defined on: Ticket created
- Date range: Simple > Last month
- Click Save
- Create a second metric with the same settings, but choose This month for the date range
- In the Metrics panel, add both calculated metrics you just created, and change their aggregators to COUNT
- From the result manipulation menu, click Result metric calculation
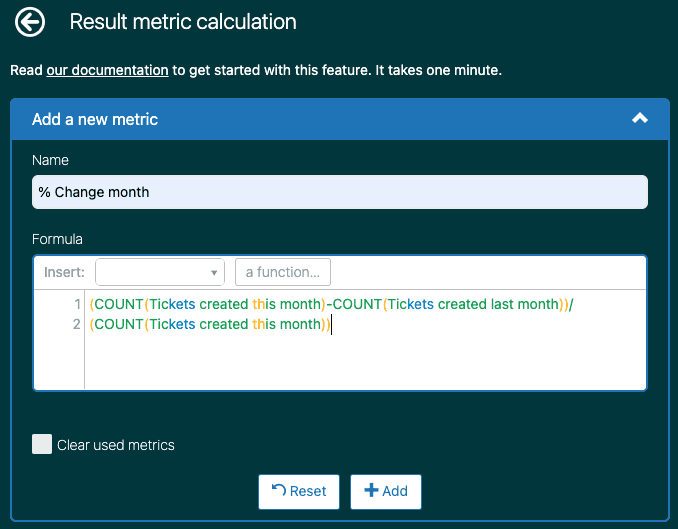
- Add a new metric:
- Name: % Change month
- Formula:
(COUNT(Tickets created this month)-COUNT(Tickets created last month))/(COUNT(Tickets created this month)) - Important: Disable the "Clear used metrics" checkbox so your original metrics stay visible
- Click the chart configuration menu, then Display format, and set your calculation to display as %
- Add your custom field to the Rows panel to break down the percentage change by field value
This report helps you spot trends. Are tickets for a particular product spiking? Is a specific issue type declining after a recent fix? The percentage change makes trends visible even when overall volume varies. For more on tracking support metrics, see our guide to AI for customer service.
Recipe 4: Reporting on duration of custom field values
This intermediate recipe answers a more sophisticated question: how long do tickets spend with a specific custom field value? This is useful for SLA analysis and bottleneck identification.
The setup is more complex because you'll use the Updates history dataset and need to find specific field values via API.
- Create a new report using Support > Support - Updates history
- Find your custom field ID: in Admin Center, go to Objects and rules > Tickets > Fields, and note the ID column value
- Find the specific field value: visit
https://yourdomain.zendesk.com/api/v2/ticket_fields/{field_id}in your browser - Look for the
"value"property in the JSON response (not the display name) you'll need this exact string - From the Calculations menu, select Standard calculated metric
- Configure your metric:
- Name: Time in [field value] (hours)
- Formula:
IF ([Changes - Field name]="Your Field Name") AND ([Changes - Previous value] = "field_value_from_api") THEN VALUE(Field changes time (min))/60 ENDIF - Click Save
- Add your calculated metric to the report and set the aggregator to AVG or SUM depending on your needs
- Add time attributes (like Update - Month) to provide context

Use cases include measuring how long tickets sit in "Waiting for customer" status, tracking time spent with specific priority levels, or analyzing resolution time by product category. Learn more about automating these workflows with AI for IT operations.
Recipe 5: Custom formatting for ticket tags
Tags generated from custom fields often look messy in reports (think "product_premium" instead of "Product Premium"). This advanced recipe uses REGEXP functions to clean them up.
- Create a new report with any dataset containing tags
- From the Calculations menu, select Standard calculated attribute
- For proper case formatting:
- Name: Proper case ticket tags
- Formula:
REGEXP_REPLACE(REPLACE([Ticket tags],"_"," "),"^[a-z]", UPPERCASE(REGEXP_EXTRACT(REPLACE([Ticket tags],"_"," "),"^[a-z]"))) - To remove a prefix (like "retail_" from "retail_product_a"):
- Name: Clean ticket tags
- Formula:
IF CONTAINS([Ticket tags], "retail") THEN REGEXP_REPLACE(REPLACE(RIGHTPART([Ticket tags],LENGTH([Ticket tags])-7),"_"," "),"^[a-z]",UPPERCASE(REGEXP_EXTRACT(REPLACE(RIGHTPART([Ticket tags],LENGTH([Ticket tags])-7),"_"," "),"^[a-z]"))) ENDIF- Replace "retail" with your prefix and "7" with the character count (including underscore)
This is especially useful when you've renamed field options over time or want to consolidate historical reporting with consistent naming. For more advanced automation, explore our AI Internal Chat for team knowledge sharing.
Common issues and troubleshooting
Even with clear steps, things sometimes go wrong. Here's how to fix the most common problems:
Report timeouts or "Network error" Your dataset is too large. Add a smaller time filter (try last 7 days instead of last 30) or add more filters to narrow the results.
Custom field doesn't appear in the list Double-check that you're looking in the right panel non-numeric fields are attributes, numeric fields are metrics. Also verify the field has permissions that allow Explore access.
Empty results when you know data exists Make sure you're filtering on the right date field. Tickets "created" last month are different from tickets "solved" last month or "updated" last month.
Formula errors in calculated metrics Double-check field names and values are in quotes. Verify you're using the API value (like "advanced_support") not the display name (like "Advanced Support").
Data looks wrong after field changes Remember that changing a drop-down option doesn't retroactively update historical tickets. The old value persists as a tag on closed tickets. This is useful for accurate historical reporting, but can be confusing if you expect everything to show the new value.
If you're spending significant time building and maintaining these reports, consider whether an AI agent could help. Our platform reads custom field values automatically and can generate insights or take actions based on that data without manual report building. For teams looking to go further, explore our AI for ITSM solution.

Start leveraging custom field data with eesel AI
Custom ticket field reporting in Zendesk Explore gives you visibility into structured support data. The recipes in this guide cover the most common use cases, from basic overviews to advanced duration tracking and formatting.
The real value comes from acting on that data. When you know which products generate the most tickets, which issue types are trending up, or where tickets get stuck longest, you can make informed decisions about staffing, process improvements, and product fixes.
At eesel AI, we help teams go beyond reporting to automation. Our AI agents can read your custom field values, route tickets based on that data, and even update fields based on conversation content. Instead of just knowing that VIP customers wait longer, an AI agent can automatically prioritize their tickets and notify the appropriate team. Check out our AI service desk solution for more details.
If you're ready to turn your Zendesk custom field data into automated workflows, explore our Zendesk integration or try eesel AI free to see how it works with your existing setup.