How to report on field duration in Zendesk Explore: A complete guide
Stevia Putri
Last edited February 26, 2026
Ever wondered how long tickets actually sit in each status? Or how much time they spend with specific support groups before moving on? These are critical questions for SLA compliance and bottleneck identification, but getting answers in Zendesk Explore requires a specific approach.
This guide walks you through creating Zendesk Explore recipes that measure field duration. You'll learn how to track time spent in ticket statuses, measure group assignment duration, and even monitor custom field values. All you need is Zendesk Explore Professional or Enterprise with Editor or Admin permissions.
If you're spending hours building these reports manually, there's a faster way. Our AI agent can read your custom field values automatically and take action on that data without complex report building. But first, let's master the Explore approach.
What you'll learn in this guide
Field duration reporting in Zendesk Explore helps you answer questions like:
- What's the average time a ticket sits in each status through its lifecycle?
- How long do tickets spend with each of my support groups?
- How much time passes while tickets have specific custom field values applied?
These insights matter for SLA analysis, identifying bottlenecks, and understanding workload distribution across teams. The recipes in this guide take about 20-30 minutes each to set up, assuming you have the prerequisites in place.
Before you start, make sure you have:
- Zendesk Explore Professional or Enterprise (these features aren't available on the Lite plan)
- Editor or Admin permissions in Explore
- Ticket data in Zendesk Support
Understanding the Updates history dataset
Here's something that trips up a lot of people: you cannot use the standard Support - Tickets dataset for field duration reporting. That dataset only captures the current state of tickets, not the history of changes.
Instead, you need the Support - Updates history dataset. This dataset stores every update and event that happens in Zendesk Support, including field changes, status transitions, and group reassignments. It's the only place where you can find the timestamps needed to calculate duration.
The key metrics you'll work with include:
- Field changes time (min) - the raw duration in minutes
- Duration - Field changes (hrs) - pre-calculated hourly metrics for common fields
The attributes that make this possible:
- [Changes - Field name] - identifies which field changed (like "status" or "group_id")
- [Changes - Previous value] - the value before the change
- [Changes - New value] - the value after the change
When a ticket field changes, Explore logs the old value, the new value, and how long the ticket had the old value. That's the foundation of all duration reporting.
Recipe 1: Average time in each ticket status
This recipe shows you the average time solved tickets spent in each status throughout their lifecycle. It's useful for SLA compliance and understanding where tickets get stuck.
Step 1: Create a new report
In Zendesk Explore, click the reports icon, then New report. Select Support > Support - Updates history, then click Start report.
Step 2: Add the duration metrics
In the Metrics panel, click Add. From the list of metrics, expand Duration - Field changes (hrs), and choose:
- New status time (hrs)
- Open status time (hrs)
- Pending status time (hrs)
After adding each metric, click it and change the aggregator to AVG. This displays the average of all returned values. If you have the On-hold status enabled, you can also add On-hold status time (hrs).

Step 3: Set the visualization
From the Visualization type menu, choose Table. Explore displays the finished report showing average hours spent in each status.
The result answers questions like: "Do tickets sit in Pending status longer than they should?" or "Are we resolving tickets quickly once they reach Open status?"
Recipe 2: Time spent with a specific support group
This recipe creates a calculated metric that shows how long tickets spend in a specific support group. It's valuable for workload analysis and understanding handoff patterns between teams.
Step 1: Find your group ID
Before creating the metric, you need the group ID number. In your web browser, visit:
https://yourdomain.zendesk.com/api/v2/groups.json
Replace "yourdomain" with your actual Zendesk subdomain. You'll see a JSON response with all your groups and their IDs. Look for the group you want to track and note its ID number.
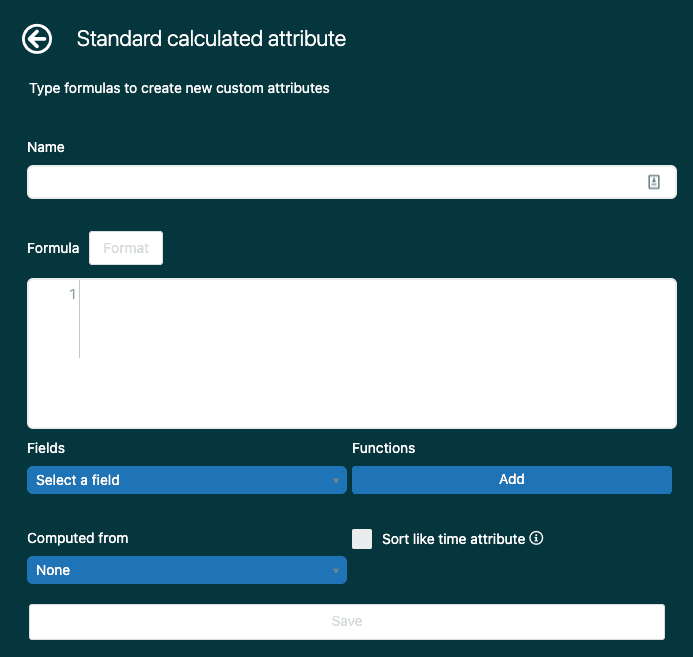
Step 2: Create the calculated metric
In your report, click the Calculations menu and select Standard calculated metric. Give it a name like "Time spent in Support Group 1".
In the Formula field, enter:
IF ([Changes - Field name]="group_id")
AND ([Changes - Previous value]="YOUR_GROUP_ID")
THEN VALUE(Field changes time (min))/60
ENDIF
Replace YOUR_GROUP_ID with the actual ID number you found in Step 1. The formula checks for group assignment changes, looks for tickets that left your target group, and calculates the time spent there in hours.
Step 3: Add the metric to your report
Click Save to create the metric. Then in the Metrics panel, click Add and select your new calculated metric from the Calculated metrics folder. Set the aggregator to AVG, SUM, or MED depending on what you want to see.
This metric measures time spent in a group before being moved to another group. It doesn't include time spent in the group before the ticket was solved.
Recipe 3: Duration for custom ticket fields
Custom fields add another layer of complexity because you need to find the specific API value, not just the display name. This recipe tracks how long tickets maintain specific custom field values.
Step 1: Find the custom field ID
In Admin Center, click the Objects and rules icon in the sidebar, then select Tickets > Fields. In the Field ID column, find the ID number of your custom field and make a note of it.

Step 2: Find the specific field value
Visit this URL in your browser:
https://yourdomain.zendesk.com/api/v2/ticket_fields/YOUR_FIELD_ID
Replace YOUR_FIELD_ID with the ID from Step 1. In the JSON response, look for the "value" property of the option you want to track. This is different from the display name. For example, a field might display as "Advanced Support" but have a value of "advanced_support".
Step 3: Create the calculated metric
Create a new Standard calculated metric with a formula like this:
IF ([Changes - Field name]="Your Field Name")
AND ([Changes - Previous value] = "field_value_from_api")
THEN VALUE(Field changes time (min))
ENDIF
Use the field's display name for [Changes - Field name] and the API value (not display name) for [Changes - Previous value]. If you use the display name instead of the API value, the formula will be valid but won't return any results.
Add this metric to your report, set the aggregator to AVG or SUM, and add time attributes like Update - Month to provide context.
Important limitations to know
Before you build these reports, understand what they can't do.
Business hours limitation
Any time duration calculations for ticket fields in customized metrics are limited to calendar hours only. If you need business hours calculations, use the default duration metrics that are available within the Updates history dataset:
- First resolution time - Business hours (hrs)
- Full resolution time - Business hours (hrs)
- Requester wait time - Business hours (hrs)
These pre-built metrics respect your business hours schedule. Custom calculated metrics do not.
Performance considerations
Large datasets can cause report timeouts. If you encounter errors, try:
- Adding a smaller time filter (last 7 days instead of last 30)
- Adding more filters to narrow results
- Breaking the report into smaller segments
Historical data behavior
Changing a drop-down option doesn't retroactively update historical tickets. The old value persists as a tag on closed tickets. This is useful for accurate historical reporting, but can be confusing if you expect everything to show the new value.
Troubleshooting common issues
Even with clear steps, things sometimes go wrong. Here's how to fix the most common problems.
Empty results when you know data exists
Check your date filters first. Tickets "created" last month are different from tickets "solved" last month or "updated" last month. Make sure you're filtering on the right date field for your analysis.
Formula errors
Double-check that field names and values are in quotes. Verify you're using the API value (like "advanced_support") not the display name (like "Advanced Support"). Check for typos in field names, they're case-sensitive.
Report timeouts or "Network error"
Your dataset is too large. Add a smaller time filter or add more filters to narrow the results. Try filtering by specific groups, ticket types, or date ranges.
Custom field doesn't appear in the list
Non-numeric custom fields appear under Ticket custom fields in the Rows or Columns panels. Numeric fields show up in the Metrics panel. If you still can't find it, verify the field has permissions that allow Explore access.
Data looks wrong after field changes
Remember that changing a drop-down option doesn't retroactively update closed tickets. The old value persists as a tag. This affects historical reporting accuracy but ensures data integrity.
Going beyond Explore with automated insights
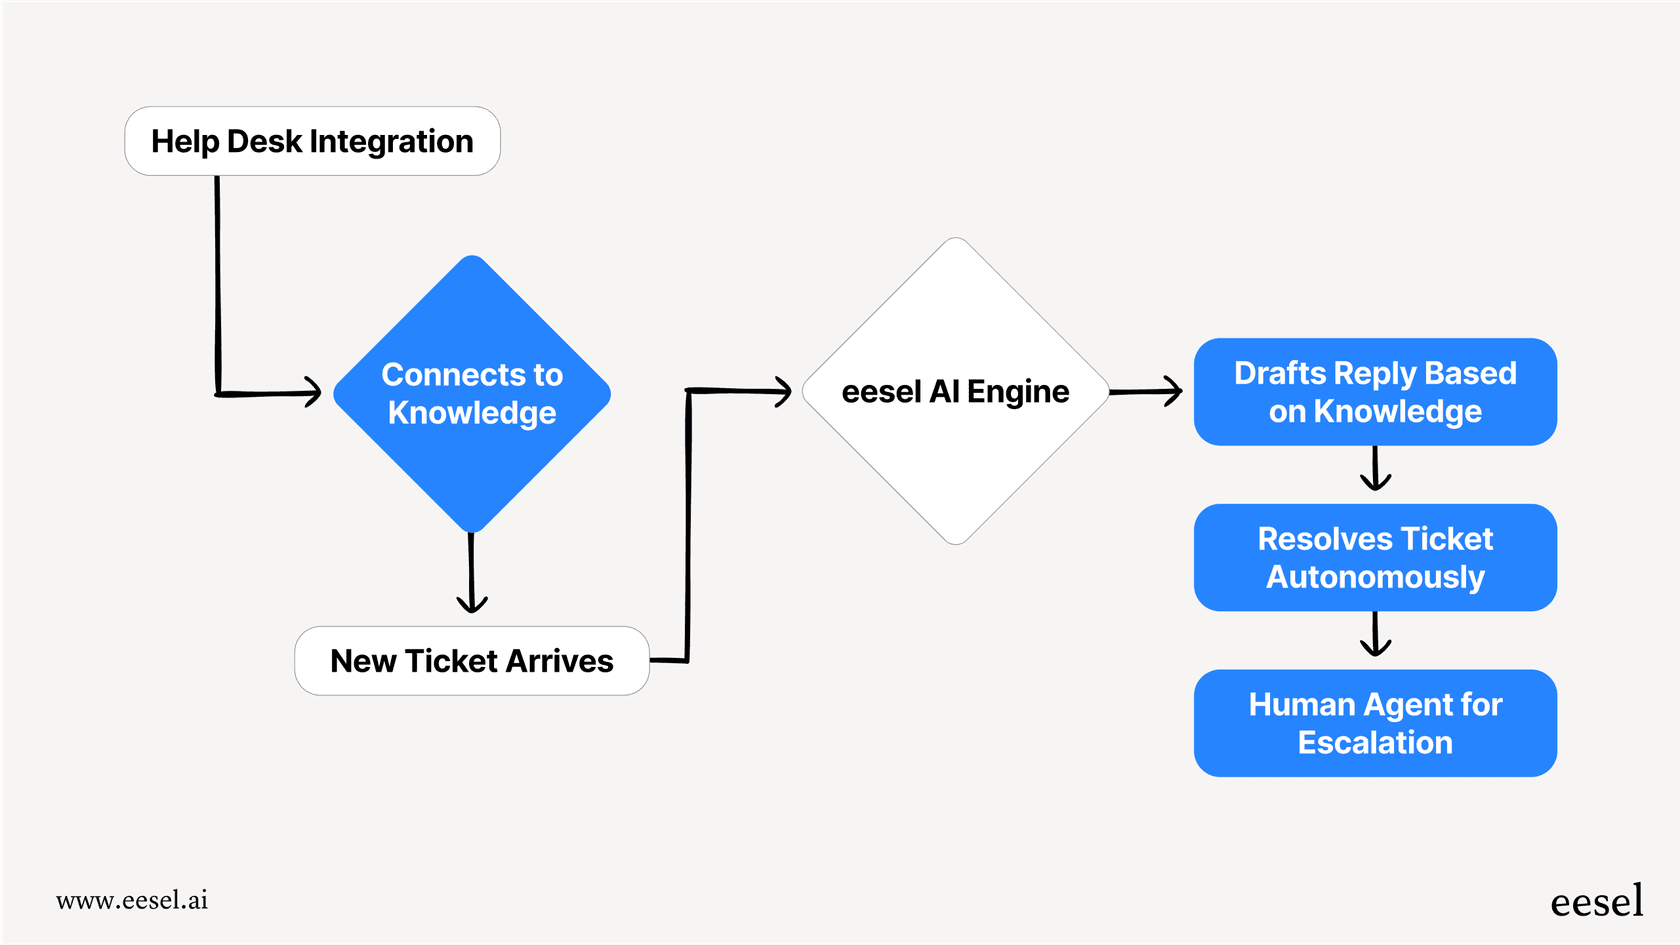
Building these reports gives you visibility into structured support data. But there's a difference between knowing that VIP customers wait longer and automatically prioritizing their tickets.
At eesel AI, we help teams go beyond reporting to automation. Our AI agent reads your custom field values automatically, routes tickets based on that data, and can even update fields based on conversation content. Instead of just knowing that tickets sit in Pending too long, an AI agent can send follow-up reminders and escalate when needed.
The recipes in this guide cover the most common use cases for field duration reporting in Zendesk Explore. When you're ready to turn that data into automated workflows, explore our Zendesk integration or try eesel AI free to see how it works with your existing setup.
Frequently Asked Questions
Share this article

Article by
Stevia Putri
Stevia Putri is a marketing generalist at eesel AI, where she helps turn powerful AI tools into stories that resonate. She’s driven by curiosity, clarity, and the human side of technology.