How to fix Zendesk Explore query performance issues
Stevia Putri
Last edited February 26, 2026
If you've ever stared at a loading spinner in Zendesk Explore wondering if your report will ever finish, you're not alone. Slow query performance is one of the most common frustrations support teams face when trying to analyze their data. The good news? There are proven techniques to speed things up.
This guide walks you through why Explore slows down, how to optimize your queries, and when it might be time to consider alternatives. We'll also look at how AI-powered tools like eesel AI can complement your reporting setup to deliver faster insights without the wait.

Understanding why Zendesk Explore query performance slows down
Before diving into fixes, it helps to understand what's happening behind the scenes when you run a report in Explore.
How Explore processes your data
Zendesk Explore is built on an OLAP (Online Analytical Processing) architecture. In plain terms, this means it's designed to crunch large amounts of historical data and present it in meaningful ways. But here's the catch: behind every simple-looking report could be thousands of users, millions of tickets, and billions of ticket events that need to be scanned and calculated.
When you build a query, Explore has to:
- Scan through your dataset to find matching records
- Apply any filters you've set
- Run calculations on the metrics you've selected
- Format and display the results
The more data involved in each step, the longer it takes. This is why a report that runs fine with last week's data might time out when you try to pull a full year.
Common performance bottlenecks
Based on user reports and Zendesk's own infrastructure analysis, these are the main culprits behind slow queries:
-
Data volume: The most obvious factor. Comparing year-over-year data or pulling reports for large teams means scanning significantly more records.
-
Complex calculations: Reports with multiple metrics, calculated fields, or custom attributes require more processing power.
-
Dashboard overload: Loading a dashboard with 10+ queries simultaneously is asking Explore to run multiple heavy operations at once.
-
Plan limitations: Lower-tier plans have longer data refresh intervals. On Support Team and Suite Team plans, data only updates once per day. Professional and Enterprise plans get hourly refreshes (or real-time for live dashboards on Enterprise).
I have some queries that show data from this year and compare it with data from last year, it easily adds up to larger quantities of data. Unfortunately Explore is super slow when handling this.
Quick fixes to speed up your Zendesk Explore queries
Let's start with the optimizations that require the least effort but can deliver significant improvements.
Filter your data before loading
This is the single most effective way to improve performance. Instead of loading everything and then filtering, set your filters at the query level:
-
Use date range filters aggressively: If you only need last month's data, don't pull last year's. The narrower your date range, the faster your query runs.
-
Filter by specific agents, groups, or ticket types: Rather than running organization-wide reports, break them down by team or channel.
-
Apply filters at the query level, not just dashboard level: Dashboard filters are applied after the data loads. Query filters reduce the data volume before processing begins.
Simplify your queries
Complex queries look impressive but often cause timeouts. Here's how to streamline:
-
Break all-in-one queries into smaller, focused reports: Instead of one mega-report with 15 metrics, create three focused reports with 5 metrics each.
-
Remove unnecessary metrics and attributes: Every field you add increases processing time. Ask yourself: "Do I actually need this column?"
-
Use "Displayed values" to limit visible data: If you're only interested in top performers, set your visualization to show the top 10 or 20 results rather than everything.
Optimize your dashboard design
How you structure your dashboards matters:
-
Limit the number of queries per dashboard: Aim for 5-7 widgets maximum. If you need more, split them across multiple dashboards.
-
Use bookmarks strategically: Set up bookmarks with pre-applied filters so users don't have to load the full dataset before narrowing down.
-
Consider refresh intervals: If you're on a plan with hourly or daily refreshes, don't set dashboards to auto-refresh more frequently than your data actually updates. According to Zendesk's documentation, each new data sync starts one hour after the most recent sync ends, and some syncs can take up to four hours to complete.
Advanced optimization techniques for Zendesk Explore
If the quick fixes aren't enough, these advanced strategies can help squeeze more performance out of Explore.
Query structure best practices
The Zendesk community has developed some clever workarounds for persistent performance issues:
Build "fake" queries first: Create a query with a very small data range (like a single agent on a single day) to set up your filters and metrics. Once everything is configured correctly, expand the date range. This prevents timeouts while you're still building the report.
Use minimum data values: Set data minimums to 1 to exclude blank or zero values from your calculations. This reduces the dataset size without affecting meaningful results.
Control filters at the dashboard level: Instead of embedding filters inside each query, apply them at the dashboard level. This way, the filters work across all queries consistently and you avoid duplicating filter logic.
Dataset selection tips
Choosing the right foundation for your report makes a difference:
-
Pick the right dataset for your report type: Explore offers different datasets for Support, Chat, Talk, and other products. Using the wrong dataset means Explore has to work harder to find relevant data.
-
Understand your plan's refresh intervals: On Support Team and Suite Team plans, data refreshes once per day. Suite Professional gets hourly refreshes for pre-built and custom dashboards. Suite Enterprise offers real-time refreshes for prebuilt live dashboards (though custom dashboards still update hourly).
-
Know when to use live data vs. cached data: Live data is great for real-time monitoring but puts more load on the system. Cached data is faster and perfectly fine for historical analysis.
When to look beyond Zendesk Explore
Sometimes, optimization isn't enough. Here are the signs you've outgrown Explore and what to consider instead.
Signs you've outgrown Explore
-
Consistent timeouts despite optimization: If you've applied all the best practices and queries still fail to load, you've hit Explore's limits.
-
Need for real-time or near-real-time data: When hourly refreshes aren't frequent enough for your operational needs, you need a different solution.
-
Complex cross-dataset analysis: Explore works best within individual datasets. If you need to correlate data across Support, Chat, Talk, and external systems, you'll need more powerful tools.
Alternative reporting approaches
When Explore can't meet your needs, consider these options:
BI tools for deep analysis: The Power BI Connector for Zendesk lets you export significant data volumes without performance drawbacks. It supports tickets, metrics, users, satisfaction ratings, and custom fields. Tableau offers similar capabilities for teams already using that ecosystem.
Dashboard tools for real-time monitoring: Geckoboard specializes in real-time KPI dashboards that refresh every few minutes (or even instantly for messaging metrics). Unlike Explore, which takes time to master, Geckoboard is built for quick setup and TV display. Pricing starts at $60/month for annual plans.
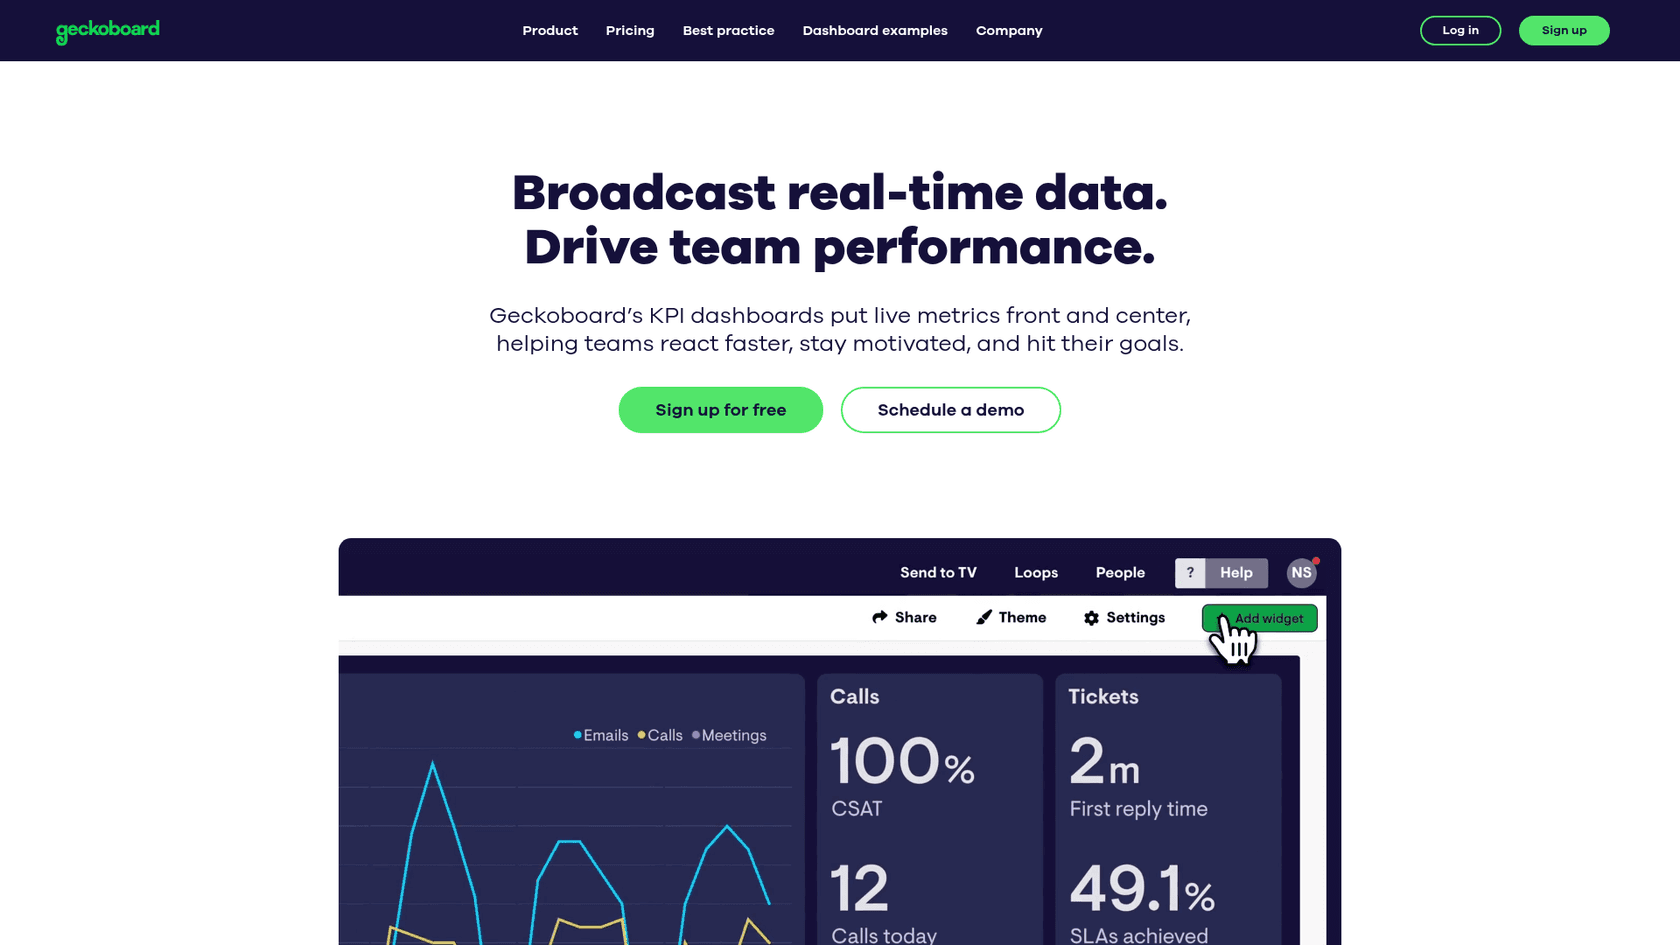
| Feature | Zendesk Explore | Geckoboard |
|---|---|---|
| Refresh rate | Daily to hourly | Every few minutes to instant |
| Best for | Deep analysis | Real-time team monitoring |
| Data sources | Zendesk only | 90+ integrations |
| Ease of use | Takes time to master | Quick setup |
| Live dashboards | Enterprise plan only | All plans |
Spreadsheet exports for ad-hoc analysis: Sometimes the simplest solution is to export data and analyze it in Excel or Google Sheets. This works well for one-off investigations rather than ongoing reporting.
Using AI to reduce your reporting burden
Here's where modern AI tools change the game. Instead of building reports manually and waiting for them to load, AI can surface insights automatically.
At eesel AI, we've built automatic topic detection that analyzes your tickets continuously without requiring you to build a single report. Our AI learns from your past tickets, identifies patterns, and surfaces trends in real time. No query building, no loading spinners, no waiting for hourly refreshes.
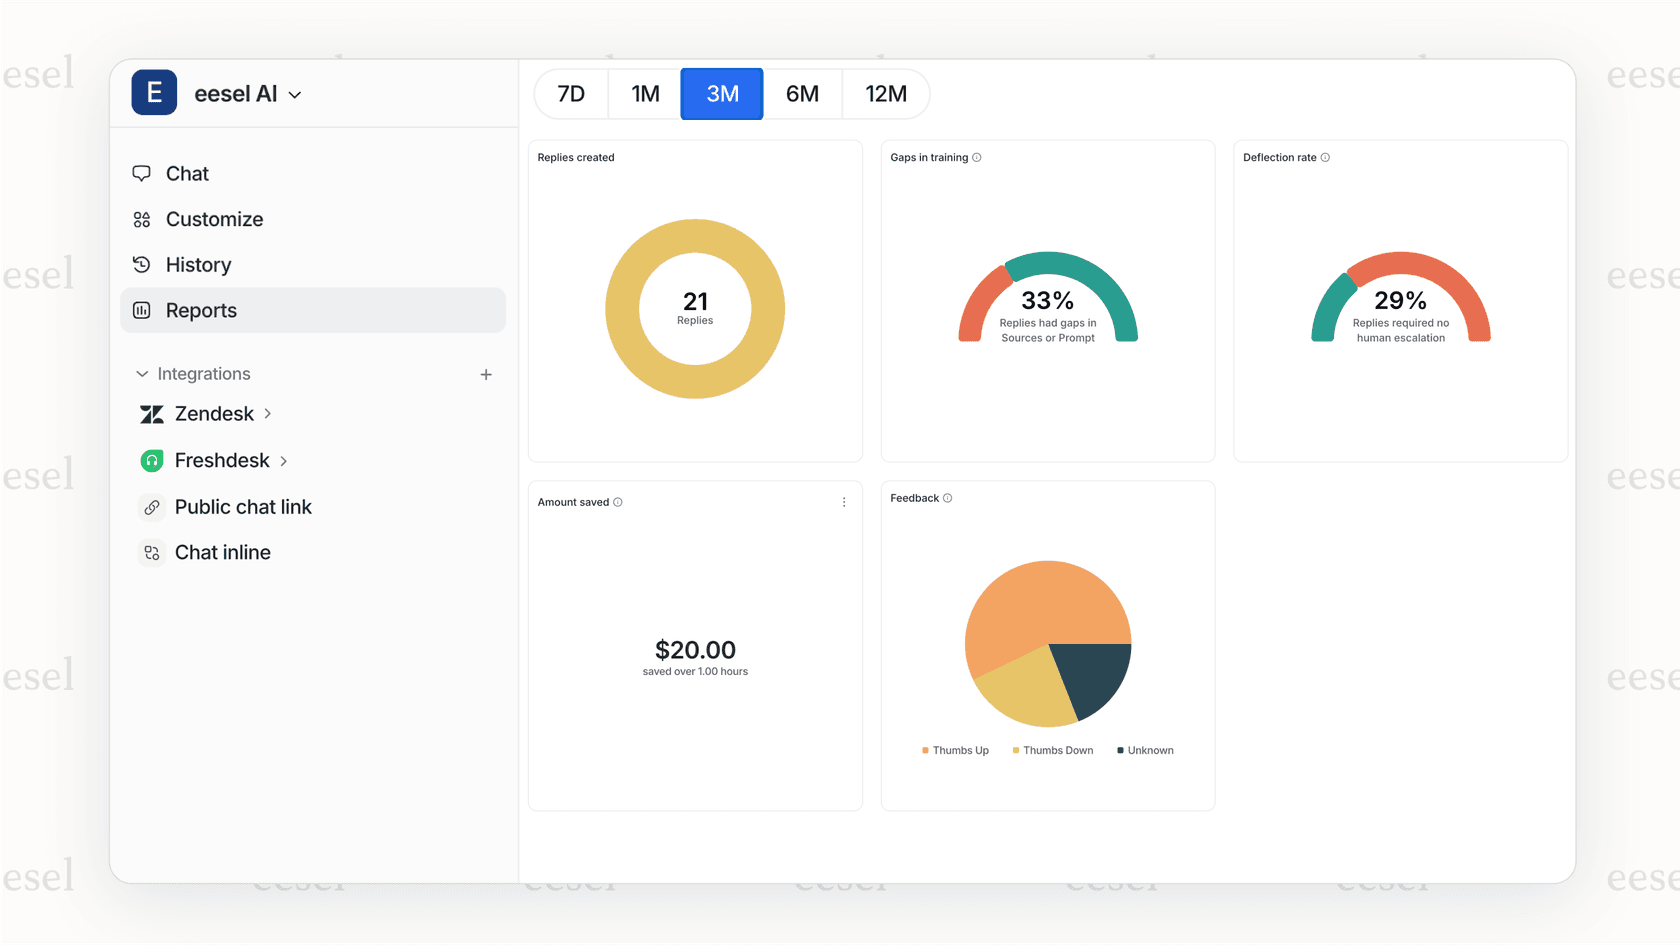
This doesn't replace Explore for detailed historical analysis, but it complements it beautifully. While Explore handles your deep-dive reporting needs, AI handles the ongoing monitoring and insight generation that keeps your team proactive rather than reactive.
Your Zendesk Explore query performance optimization action plan
Let's put this all together into a practical checklist you can use right now:
Immediate fixes (do these today):
- Audit your dashboards and remove any queries you don't actively use
- Add date range filters to every report, limiting to the minimum time period needed
- Split complex dashboards into multiple focused ones
This week:
- Review your plan level and understand your data refresh intervals
- Rebuild your slowest queries using the "fake query first" method
- Set up bookmarks with pre-applied filters for common use cases
This month:
- Evaluate whether your current plan meets your reporting needs
- Test one alternative tool (Geckoboard for real-time dashboards, or Power BI for deep analysis)
- Consider how AI-powered insights could reduce your overall reporting workload
Decision framework:
- If queries load but slowly → Optimize using the techniques in this guide
- If queries consistently time out → Consider upgrading your plan or exploring alternatives
- If you need real-time visibility → Look at Geckoboard or similar dashboard tools
- If you need cross-system analysis → Evaluate BI tools like Power BI
Start optimizing your support analytics today
Slow Zendesk Explore query performance is a solvable problem. Start with the quick wins: filter aggressively, simplify your queries, and optimize your dashboard design. If you've hit Explore's limits, alternatives like Geckoboard for real-time monitoring or Power BI for deep analysis are worth exploring.
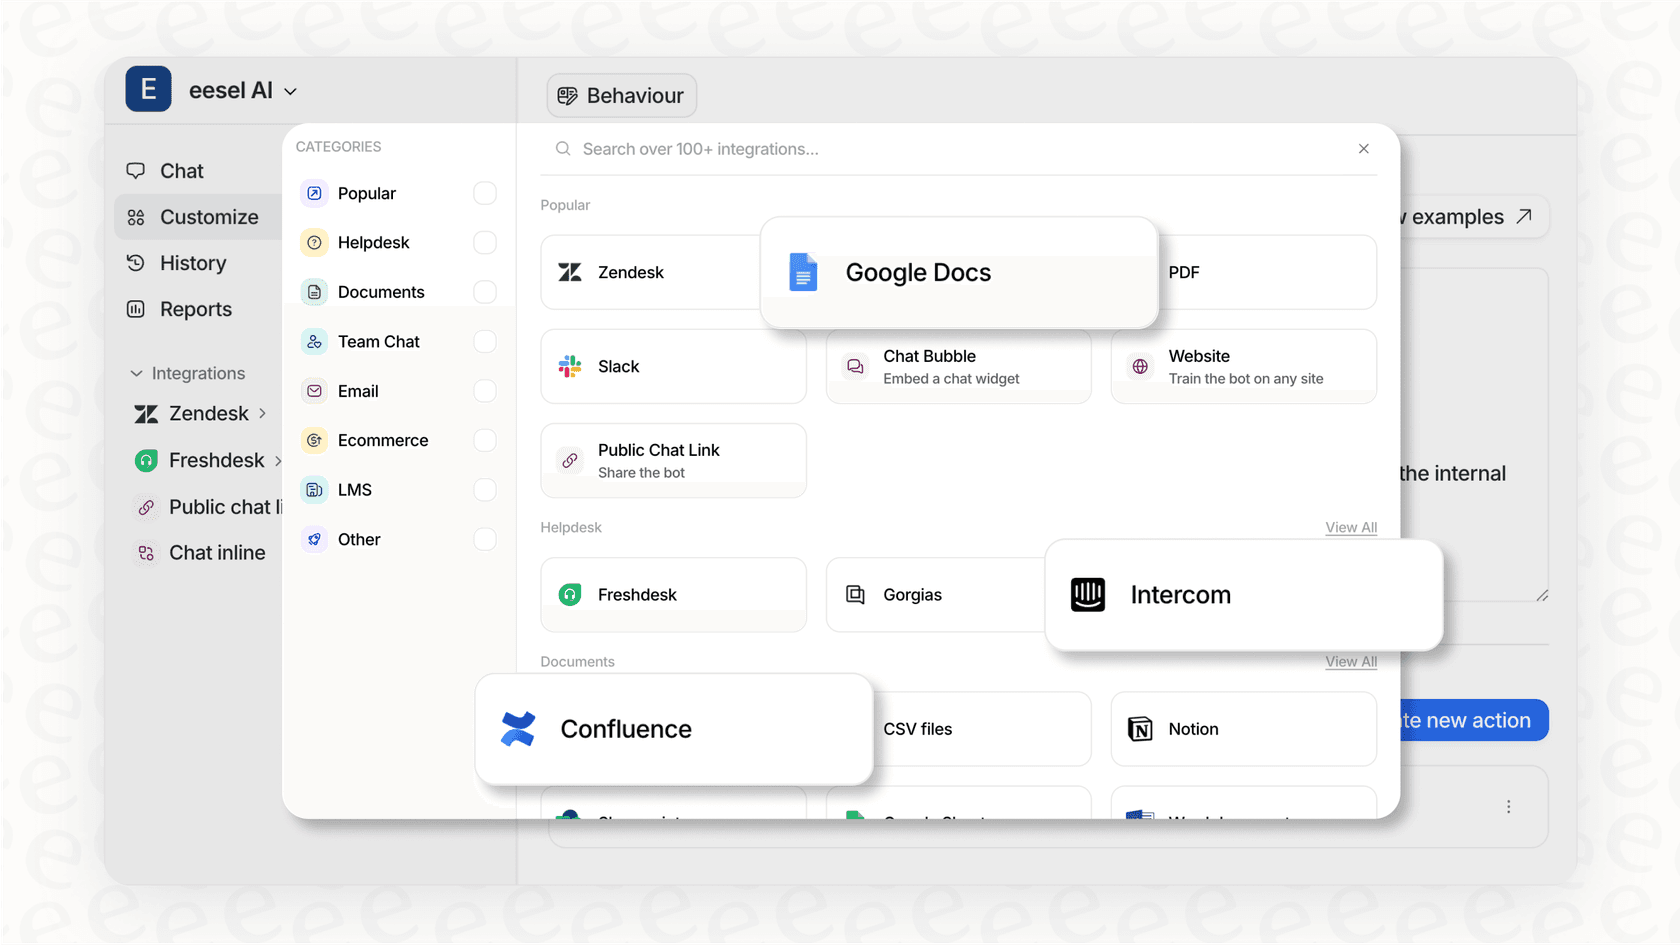
For teams tired of waiting for insights altogether, eesel AI integrates directly with Zendesk to deliver AI-powered analytics without the query-building overhead. Our AI learns your business automatically, surfaces trends as they happen, and helps you stay ahead of issues before they become problems.
The best reporting setup usually combines multiple approaches: Explore for historical deep-dives, real-time dashboards for operational monitoring, and AI for continuous insight generation. The key is matching the right tool to each job rather than forcing one tool to do everything.
Frequently Asked Questions
Share this article

Article by
Stevia Putri
Stevia Putri is a marketing generalist at eesel AI, where she helps turn powerful AI tools into stories that resonate. She’s driven by curiosity, clarity, and the human side of technology.