Understanding how long it takes to resolve customer issues is fundamental to running an effective support operation. While Zendesk provides several time-based metrics, the full resolution time metric stands out as one of the most comprehensive measures of your team's performance. It captures the complete journey from when a customer first reaches out to when their issue is finally solved.
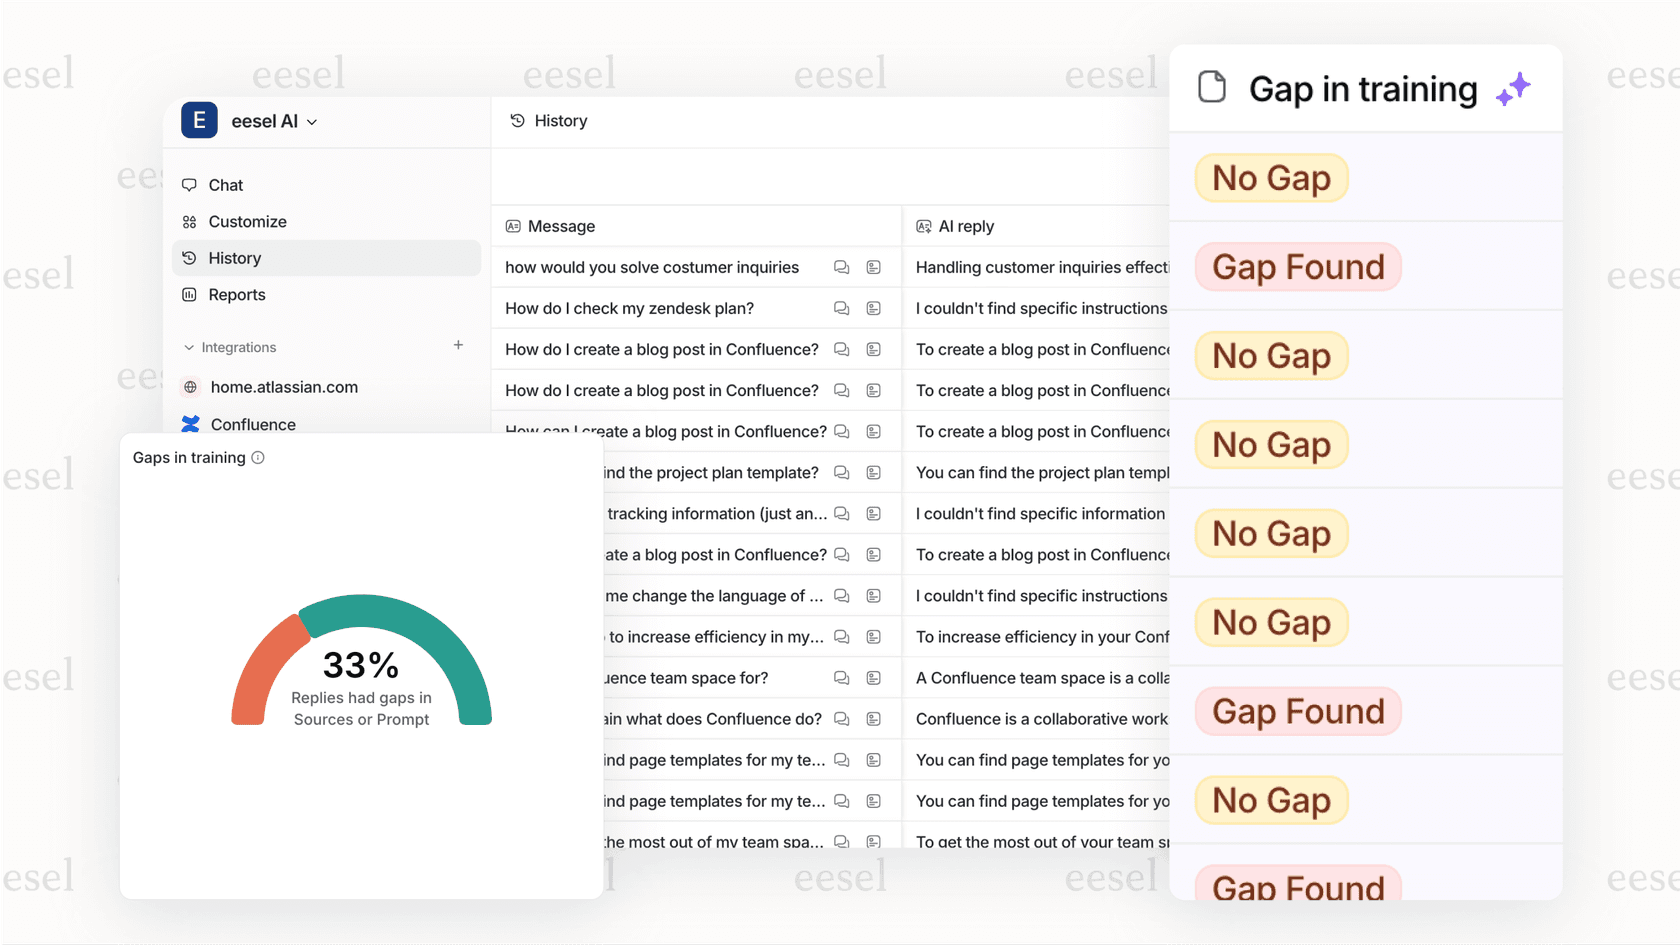
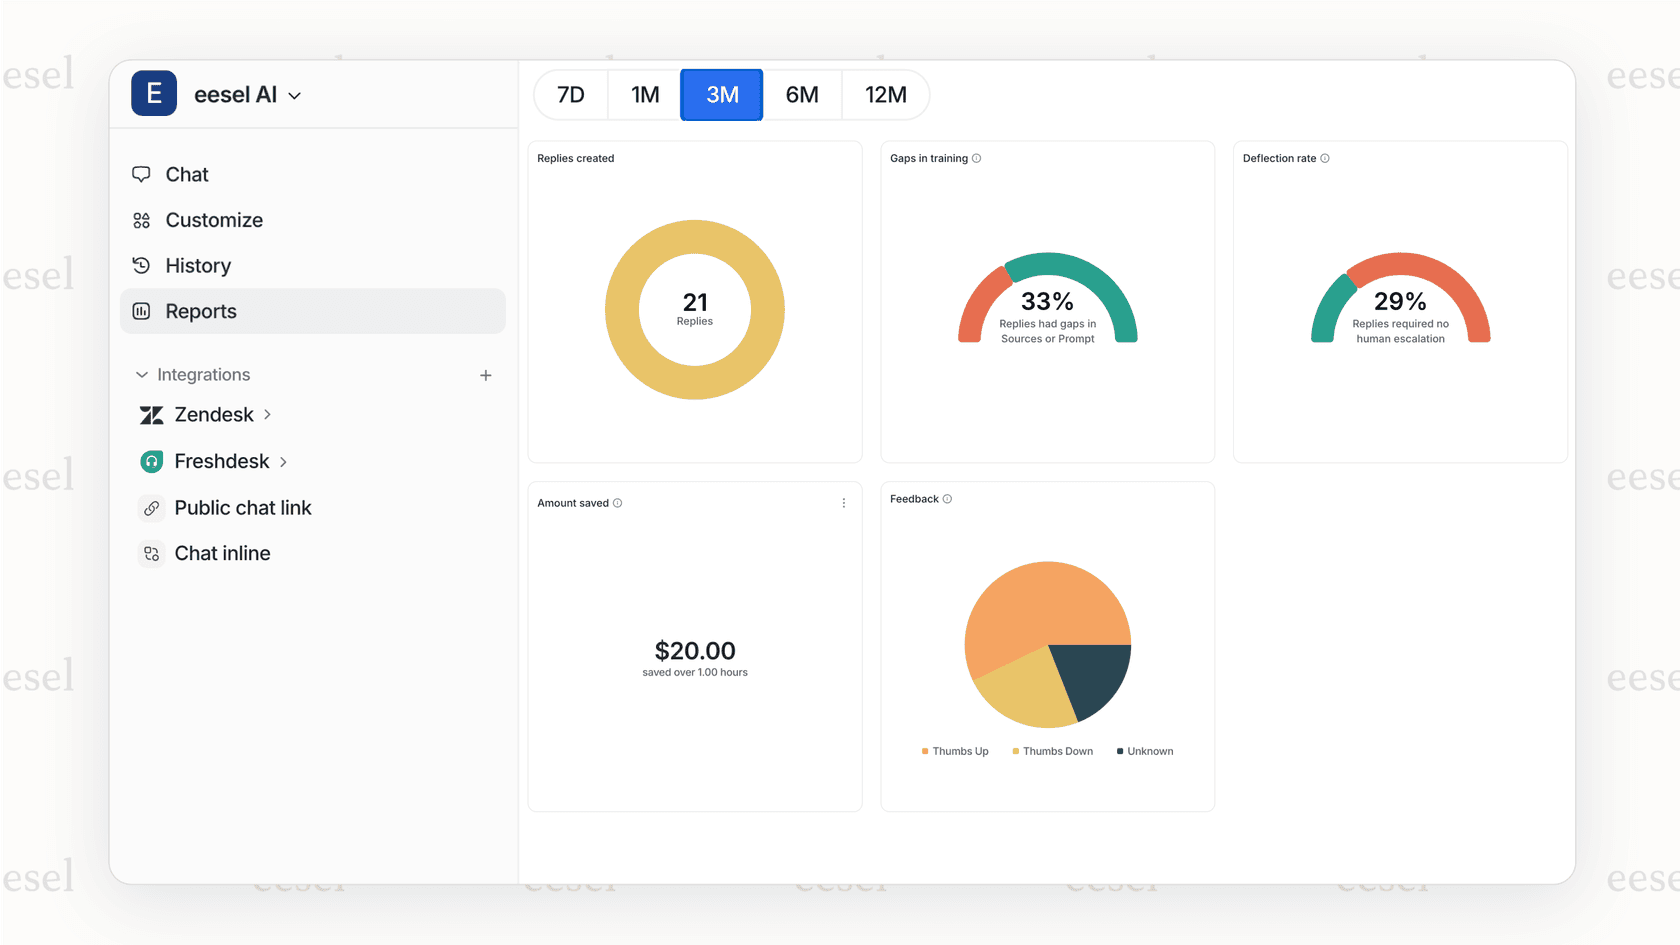
Unlike first resolution time, which only measures the time to the initial solve, full resolution time accounts for tickets that get reopened and require additional work. This makes it a more accurate reflection of the actual customer experience. For teams looking to reduce these resolution times, AI-powered solutions like eesel's AI agent for Zendesk can handle common queries automatically, freeing up agents for more complex issues.
What is full resolution time in Zendesk?
Full resolution time measures the total duration from when a ticket is created to when it is solved for the last time. This distinction matters because tickets can be reopened after being marked as solved. A customer might respond to a solved ticket with a follow-up question, or an agent might realize the initial solution didn't fully address the problem.
Here's how it breaks down:
- First resolution time: The time from ticket creation to the first time it's marked solved
- Full resolution time: The time from ticket creation to the final resolution, including any reopen cycles
The difference between these two metrics can reveal important insights about your support quality. If your first resolution time looks good but your full resolution time is significantly higher, you might have a reopen problem. Tickets are being closed too quickly or the initial solutions aren't thorough enough.
Full resolution time is available in several units depending on your reporting needs:
| Metric Unit | Best Used For | Formula |
|---|---|---|
| Full resolution time (min) | Detailed analysis, SLA tracking | Raw minutes |
| Full resolution time (hrs) | Standard reporting | VALUE(Full resolution time (min))/60 |
| Full resolution time (days) | High-level trends | VALUE(Full resolution time (min))/60/24 |
| Full resolution time - Business hours | SLA compliance | Only counts time within configured business hours |
The business hours variant is particularly important for SLA reporting. If your support team only operates during business hours, measuring resolution time in calendar hours will include nights and weekends when no one is working. This can make your performance look worse than it actually is.
What you'll need to get started
Before you start building reports, make sure you have the following:
- A Zendesk Suite plan: Professional, Enterprise, or Enterprise Plus
- Zendesk Explore access: Professional or Enterprise tier
- Editor or Admin permissions: Required to create and modify reports
- Ticket data: Historical tickets in your Zendesk Support account
If you're on a lower-tier plan, you won't have access to Zendesk Explore's custom reporting capabilities. The prebuilt dashboards won't give you the granular control you need to analyze full resolution time effectively.
Step-by-step: Creating a full resolution time report
Step 1: Create a new report in Explore
Start by navigating to Zendesk Explore from your main dashboard. Click the Explore icon (it looks like a small graph), then select New report from the Reports library.
You'll see a "Select a Dataset" page. Choose Support from the left menu, then Support - Tickets. This dataset contains all the ticket-level metrics you'll need, including the full resolution time metric. Click Start report to open the report builder.

The report builder is where you'll assemble your metrics, attributes, and visualizations. The interface has three main panels: Metrics on the left, attributes in the middle (Rows and Columns), and Filters on the right.
Step 2: Add the full resolution time metric
In the Metrics panel on the left, click Add. This opens a list of all available metrics organized by category.
Navigate to Duration between events - Calendar hours (hrs) and select Full resolution time (hrs). Click Apply to add it to your report.
By default, Explore uses the MEDIAN aggregator for time metrics. This is usually the right choice because median is less affected by outliers than average. One ticket that took 30 days to resolve won't skew your entire report.

At this point, your report will show a single number: the median full resolution time across all tickets in your dataset. To make this useful, you need to slice the data.
Step 3: Slice the data with attributes
Attributes let you break down your metrics by different dimensions. Here are some useful ways to analyze full resolution time:
By date: Add Ticket created - Date to the Columns panel. This shows you how resolution time trends over days, weeks, or months. You can group by week or month if daily data is too granular.
By assignee: Add Assignee name to the Rows panel to see resolution times by individual agent. This helps identify training opportunities or workload imbalances.
By ticket tags: Add Ticket Tags to analyze resolution times by issue type, product area, or customer segment. This can reveal which types of issues take longest to resolve.
When you add attributes, the report automatically recalculates the metric for each combination. You might discover that technical issues have a median resolution time of 4 hours, while billing questions are resolved in 30 minutes.
Step 4: Customize the visualization
Raw numbers are useful, but visualizations make patterns easier to spot. Click the Visualization type menu to change how your data is displayed.
- Line chart: Best for showing trends over time
- Column chart: Good for comparing values across categories
- Pie chart: Useful for showing proportions (though less common for time metrics)
You can also add filters to focus on specific time periods. Click Add in the Filters panel, select Ticket created - Date, and choose a date range. This is helpful for excluding old data that might not reflect your current performance.

Understanding full resolution time variants
Zendesk offers multiple versions of the full resolution time metric, and choosing the right one matters for accurate reporting.
Calendar hours count every hour that passes, including nights, weekends, and holidays. This is useful for understanding the total customer experience, but it can be misleading for SLA compliance. A ticket created Friday evening and solved Monday morning might show 72 hours in calendar time even though your team wasn't working for most of that period.
Business hours only count time within your configured business schedule. If your team works 9 AM to 5 PM on weekdays, a ticket created Friday at 4 PM and solved Monday at 10 AM would show just 2 business hours, not 66 calendar hours.
To configure business hours in Zendesk:
- Go to Admin Center
- Navigate to Objects and rules > Business rules > Business hours
- Set your schedule and holidays
Once configured, use the Full resolution time - Business hours (min) or (hrs) metrics for SLA reporting.
Related metrics you should know
Full resolution time doesn't exist in isolation. Understanding how it relates to other time metrics gives you a fuller picture of your support operation.
| Metric | What It Measures | When to Use It |
|---|---|---|
| First reply time | Time from ticket creation to first agent response | Measuring initial responsiveness |
| First resolution time | Time from creation to first solve | Measuring first-touch resolution effectiveness |
| Full resolution time | Time from creation to final solve | Measuring total effort to close |
| Requester wait time | Time ticket spends in New, Open, or On-hold | Understanding customer wait experience |
| Agent wait time | Time ticket spends in Pending | Measuring how long agents wait for customer replies |
These metrics work together to tell a story. If your first reply time is fast but your full resolution time is slow, you might be responding quickly but not resolving effectively. If your requester wait time is high, customers are spending too much time waiting for your team to act.
Common issues and how to troubleshoot them
Even with clear documentation, you might run into issues when working with full resolution time reports. Here are the most common problems and how to fix them.
Metric shows NULL values: This usually happens when a ticket hasn't been resolved yet. Only solved and closed tickets have resolution times. To exclude unresolved tickets, add a filter for Ticket status and select only "Solved" and "Closed".
Extremely long resolution times skewing averages: Outliers can make your average resolution time look much worse than reality. One ticket that took 90 days to resolve will pull your average up significantly. Use the MEDIAN aggregator instead of AVG, or add a filter to exclude tickets with resolution times above a certain threshold.
Data doesn't match expectations: Remember that Explore data syncs on a schedule, not in real time. It can take 1-4 hours for recent ticket updates to appear in your reports. If you just solved a ticket and don't see it reflected, wait for the next sync cycle.
Tickets solved and reopened multiple times: Full resolution time captures the total time to final resolution, but it doesn't show you how many times a ticket was reopened. To see reopen counts, add the Reopens metric to your report alongside full resolution time.
Using full resolution time to improve your support
Once you have your reports set up, the real work begins: using the data to drive improvements.
Set benchmarks: Establish what "good" looks like for your team. Industry benchmarks vary, but a general target for full resolution time is under 24 hours for standard support and under 4 hours for priority issues. Track your median and aim to improve it over time.
Identify problem areas: Use ticket tags or custom fields to categorize tickets, then analyze resolution times by category. You might find that technical issues take 3x longer than billing questions. This insight helps you allocate resources and training where they're needed most.
Analyze by time period: Look for patterns in your resolution times. Are Mondays slower because of weekend backlog? Do resolution times spike during product launches? Understanding these patterns helps with capacity planning.
Consider automation: For teams looking to reduce resolution times, AI-powered tools can handle routine queries automatically. eesel AI integrates with Zendesk to draft responses, suggest solutions, and even resolve common issues without agent involvement. This lets your team focus on complex problems while maintaining fast resolution times for simple requests.
Start measuring and improving your resolution times
Full resolution time is one of the most important metrics for understanding your support operation's performance. It captures the complete customer journey from first contact to final resolution, including the often-overlooked reopen cycles that can frustrate customers.
By following the steps in this guide, you can build reports that show you exactly where your team stands and where there's room for improvement. Start with a basic report showing median full resolution time by week, then add dimensions like assignee, tags, or priority to dig deeper.
Remember that metrics are only useful if you act on them. Set targets, review regularly, and use the insights to drive process improvements. And if you're looking for ways to reduce resolution times without adding headcount, consider how AI tools like eesel AI can automate routine work and help your team resolve tickets faster.