First reply time is one of those metrics that seems simple until you try to report on it accurately. You know the concept: how long does a customer wait before getting their first response? But when you dive into Zendesk Explore to build that report, you quickly discover there's more nuance than you expected.
Calendar hours or business hours? What about tickets created by agents? Why does your data look weird for certain ticket types?
This guide walks you through exactly how to use the first reply time metric in Zendesk Explore. We'll cover the configuration steps, explain the differences between metric types, and help you troubleshoot the common issues that trip up support teams.
What you'll need
Before you start building reports, make sure you have:
- Zendesk Explore Professional or Enterprise the first reply time metric isn't available on basic plans
- Editor or Admin permissions in Explore to create and modify reports
- Ticket data in Zendesk Support you'll need actual tickets with replies to see meaningful data
- A clear idea of whether you need calendar hours or business hours (we'll explain the difference shortly)
If you're on a lower-tier plan, you'll need to upgrade to access these reporting features.
Understanding the Zendesk Explore metric first reply time
Let's start with the basics. First reply time (FRT) measures the duration between when a ticket is created and when an agent posts the first public comment on that ticket. It's one of the most tracked customer service metrics because it directly reflects how quickly your team acknowledges customer issues.
Here's where it gets interesting: Zendesk actually stores two versions of this metric:
Calendar hours count every hour that passes, regardless of whether your team is working. If a customer submits a ticket at 5 PM on Friday and your team replies at 9 AM Monday, that's roughly 64 hours in calendar time.
Business hours only count time during your defined working schedule. Using the same example, if your business hours are 9-5 weekdays, that Friday evening ticket would show roughly 8 hours of first reply time (just the time between 9 AM and the reply on Monday).
Both metrics are stored with the ticket data, so you can use either in your reports. Business hours often gives you a more accurate picture of team performance because it reflects actual working time. Calendar hours, on the other hand, shows the full customer experience including waits over nights and weekends.
The metric works consistently across channels. Whether tickets come in via email, web form, or phone, the first reply time calculation works the same way. The timer starts at ticket creation and stops at the first public agent comment.
For a deeper dive into business hours configuration specifically, check out our guide on how to create a Zendesk report for first reply time in business hours only.
How to create a first reply time report in Explore
Now let's walk through building an actual report. These steps work for both calendar and business hours versions of the metric.
Step 1: Open Explore and create a new report
Navigate to Explore from your Zendesk admin panel. Click the Reports icon, then select New report. On the dataset selection screen, choose Support > Support - Tickets, then click Start report.
The report builder opens with your selected dataset. You're now working with ticket-level data that includes all the metrics and attributes you need.
Step 2: Add the first reply time metric
In the Metrics panel on the left, click Add. You'll see a list of available metrics organized by category. Navigate to Duration between events - Calendar hours (min) and select First reply time (min).
If you want business hours instead, look for Duration between events - Business hours (min) and select First reply time - Business hours (min).
Click Apply to add the metric to your report. By default, Explore uses the median aggregator for this metric, which gives you a more representative value than averages that can be skewed by outliers.
Step 3: Configure report dimensions
Raw first reply time numbers aren't very useful without context. You need to break down the data by meaningful dimensions.
In the Columns or Rows panel, click Add and select attributes to organize your data. Common choices include:
- Ticket created - Date see trends over time
- Assignee name identify which agents have the fastest response times
- Group compare performance across teams
- Ticket created - Day of week spot patterns by day
You can add multiple attributes to create more granular breakdowns. Just be careful not to over-segment your data to the point where individual cells have too few tickets to be meaningful.
Step 4: Set date ranges and visualization
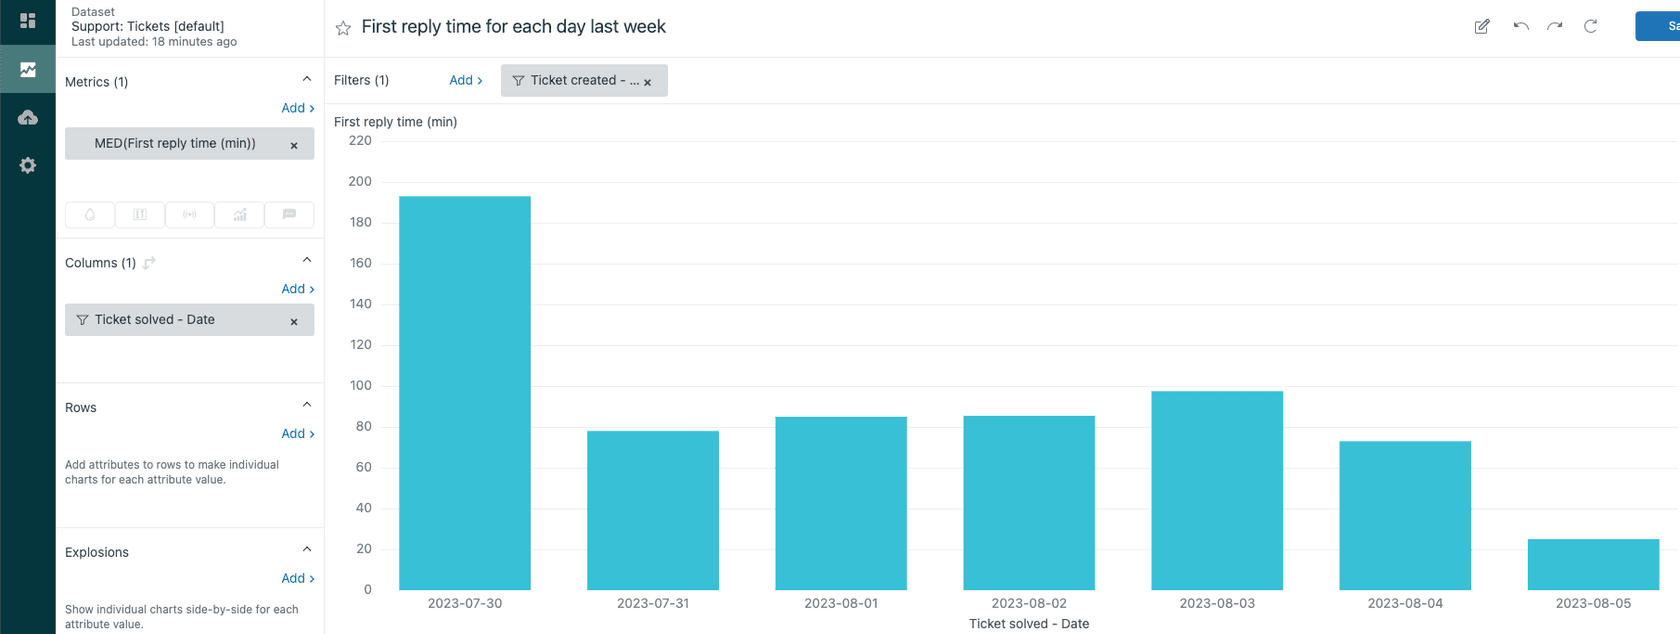
Click on any date attribute you've added, then select Edit date ranges to filter your data. For ongoing monitoring, you might choose Last 7 days or Last 30 days. For historical analysis, you can select custom ranges.
For visualization, the Column chart type works well for showing trends over time. If you're looking at day-of-week or hour-of-day patterns, a Table or Heatmap visualization can make patterns more obvious.
Once your report looks good, save it with a descriptive name like "First Reply Time by Day - Business Hours" so your team can find it later.
First reply time for messaging tickets
If your team handles messaging conversations (live chat, social messaging, etc.), there's an important distinction you need to understand.
Messaging tickets use a different calculation for first reply time. Instead of just measuring agent response time, the metric includes:
- Time the conversation spends in queue before assignment
- Time the agent spends typing their first response
This makes sense for messaging because customers experience the full wait, including queue time. But it means your messaging FRT numbers will typically be higher than email FRT for the same actual agent response speed.
To report on messaging tickets, use the Chat - Messaging tickets dataset instead of Support - Tickets. The metric is also measured in seconds rather than minutes, so you'll see values like 180 instead of 3.
One more nuance: AI agent replies don't count as agent replies for messaging FRT calculations. Only human agent responses stop the timer. This is different from email, where automated responses can affect your metrics depending on how they're configured.
Troubleshooting common issues
Even with the right configuration, you might run into confusing data. Here are the most common issues and how to fix them.
"First reply time not working" no data showing
If your report shows empty cells or zeros, check that you're using the right dataset. First reply time metrics only exist in the Support - Tickets and Chat - Messaging tickets datasets. They won't appear in other datasets like Ticket Updates or Backlog.
Off-the-charts FRT values
Seeing first reply times of thousands of minutes? This usually happens with edge cases:
- Proactive tickets: When an agent creates a ticket and immediately comments, the FRT is essentially zero. But if they create it and comment much later, you get inflated numbers.
- Ticket sharing: Comments from shared accounts don't count toward your FRT.
- Reopened tickets: FRT calculates from the first public comment after creation, not after reopening.
The fix is usually to exclude these tickets from your reporting. Add a tag to proactive tickets or shared tickets, then filter them out using a standard calculated attribute.
Business hours not calculating correctly
If your business hours FRT looks wrong, check your schedule configuration in the Admin Center. Make sure:
- Your business hours schedule is actually created and active
- Holidays are configured if you want them excluded
- The schedule is assigned to the right groups or tickets
Missing FRT data for some tickets
Tickets without any public agent comments won't have a first reply time. This includes tickets that were solved without a reply, spam tickets that were immediately deleted, or tickets still awaiting a first response.
Interpreting your first reply time data
Once your report is working, the next challenge is making sense of the numbers.
What's a "good" first reply time? It depends on your industry and support model, but here are some general benchmarks:
- Email support: 4-24 hours is typical for non-urgent issues
- Chat/messaging: Under 2 minutes is expected
- Social media: 1-4 hours is common
The key is looking at trends rather than absolute numbers. Is your FRT improving or getting worse? Are certain days or times consistently slower?
Always read FRT alongside ticket volume. A spike in first reply time might just mean you had a surge of tickets and your team was overwhelmed. That's different from a performance problem.
Use heatmaps to identify patterns. Create a report with Ticket created - Day of week on columns and Ticket created - Hour on rows. You'll quickly spot your busiest periods and potential staffing gaps.
Know when to investigate vs. when values are expected. If your FRT doubles during a product launch, that's probably normal. If it doubles during a quiet week, something's wrong.
Improving first reply time with AI
Measuring first reply time is important, but what if you could improve it without adding headcount?
AI-powered support tools can help teams respond faster in several ways. For common questions, an AI agent can provide instant answers based on your help center and knowledge bases, working 24/7 to support customers immediately. For tickets that need a human touch, AI copilots can draft accurate, on-brand replies that agents can review and send, cutting response time significantly.
At eesel AI, we built an AI agent for Zendesk to help teams move from tracking first reply time to actively improving it. Our AI Agent handles routine inquiries instantly, while our AI Copilot helps human agents draft faster responses. The result is lower first reply times without burning out your team.

The best part? You can run simulations on your past tickets to see exactly how AI would perform before going live. No guesswork, no risk to customer relationships.
Q1: How is the Zendesk Explore metric first reply time calculated?
A1: The first reply time metric measures the duration between ticket creation and the first public agent comment. Zendesk stores two versions: calendar hours (counts all time including nights and weekends) and business hours (only counts time during your defined working schedule).
Q2: Why is my Zendesk Explore metric first reply time showing no data?
A2: Empty first reply time data usually means you're using the wrong dataset (it only exists in Support - Tickets and Chat - Messaging tickets), or you're looking at tickets that never received a public agent comment. Check your dataset selection and verify the tickets actually have replies.
Q3: What's the difference between calendar hours and business hours in the Zendesk Explore metric first reply time?
A3: Calendar hours count every hour that passes, while business hours only count time during your defined schedule. Business hours gives you a better picture of team performance; calendar hours shows the full customer experience including off-hours waits.
Q4: Can I use the Zendesk Explore metric first reply time for messaging tickets?
A4: Yes, but messaging tickets use a different calculation that includes queue time plus agent typing time. Use the Chat - Messaging tickets dataset and note that the metric is measured in seconds, not minutes.
Q5: How do I fix extremely high values in my Zendesk Explore metric first reply time report?
A5: Off-the-charts values usually come from edge cases like proactive tickets (created by agents), ticket sharing, or reopened tickets. Exclude these by adding tags to such tickets and filtering them out of your reports using calculated attributes.
Q6: What permissions do I need to use the Zendesk Explore metric first reply time?
A6: You need Zendesk Explore Professional or Enterprise plan, plus Editor or Admin permissions in Explore to create and modify reports. The metric isn't available on basic plans.
Q7: How can I improve my first reply time beyond just reporting on it?
A7: AI tools can help by providing instant answers to common questions and drafting replies for agents. This reduces the time agents spend typing responses and can handle routine inquiries without human involvement, directly improving your first reply time metrics.