Blog
Tips, guides, and insights on AI teammates, smarter support, and building better teams.
How to migrate from Zendesk: a complete 2026 guide
A practical step-by-step guide to migrating from Zendesk - what to export, which tool to use, what you have to rebuild, and how to keep your team productive during the switch.
Zendesk AI agent review (2026): features, pricing, and what users actually think
A real-world Zendesk AI agent review for 2026: what agentic AI delivers, how AR pricing works, and what 6,837 G2 users and Reddit actually say.
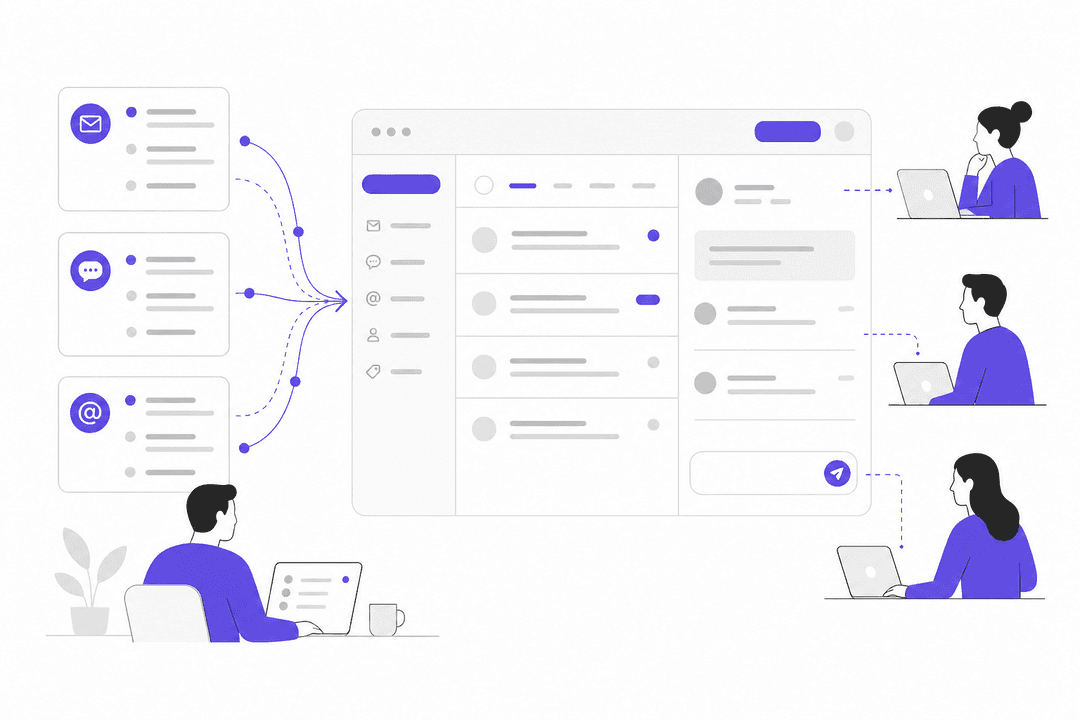
Best shared inbox software for teams in 2026
Six tools that turn a chaotic group email address into a structured, accountable inbox - with real pricing, G2 ratings, and who each one suits.

CapCut pricing 2026: A complete guide to free, standard, and pro plans
Confused by CapCut’s recent pricing changes? You're not alone. Our 2026 guide demystifies the Free, Standard, and Pro plans, comparing features, costs, and what you really get for your money.
A complete Claude overview: Models, pricing, and key limitations
Explore our comprehensive Claude overview to understand Anthropic's powerful AI. We break down the pricing for Claude Pro and the API, its core features like the 200k token window, and its limitations for support automation.

A clear guide to OpenAI Codex pricing in 2026
Unravel the complexities of OpenAI Codex pricing. Learn about the new GPT-5.2-Codex models, how they're accessed through ChatGPT subscriptions, and their per-token API costs.
OpenAI Codex pricing in 2025: A clear & simple guide
The old OpenAI Codex API was deprecated in 2023, leaving many developers confused about its current pricing and availability. This guide provides a clear, up-to-date breakdown of the new OpenAI Codex pricing structure for 2025.
Zendesk review 2026: is it still the right choice for your team?
An honest review of Zendesk in 2026: what you get at each plan, what it actually costs with add-ons, and what 10,000+ reviews reveal about life on the platform.
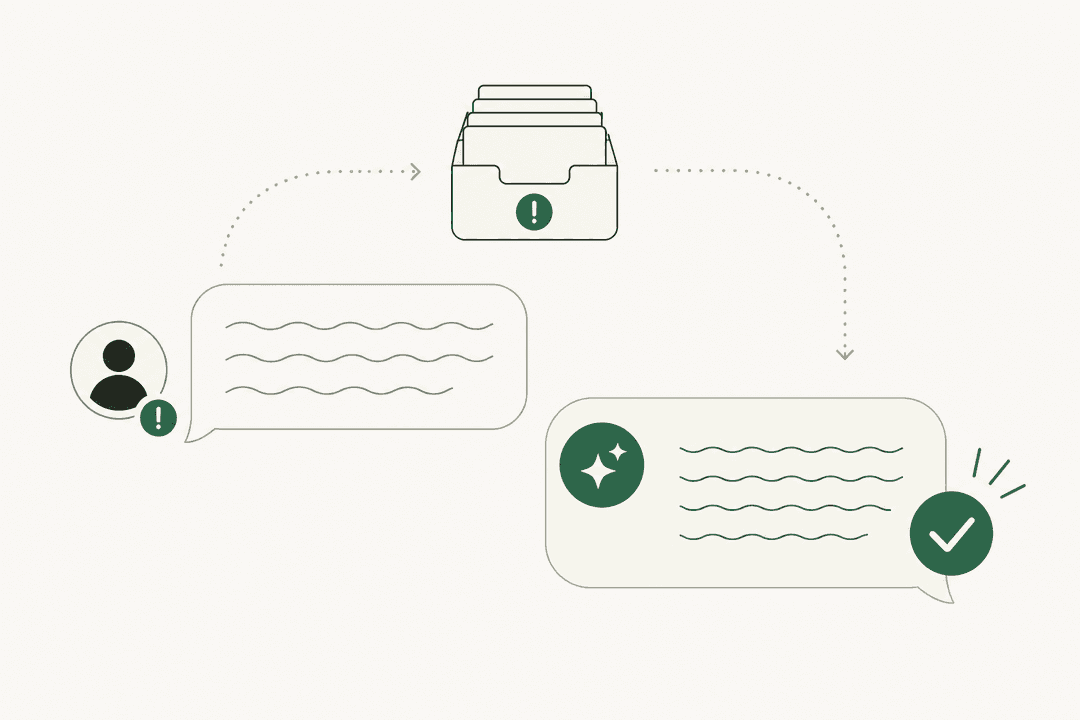
AI for customer complaints: how to handle them faster, without losing the human touch
Customer complaints demand more than speed - they demand accuracy and the right escalation. Here's how AI handles the volume without driving customers away.
Ready to hire your AI teammate?
Set up in minutes. No credit card required.