How to filter by group and brand in Zendesk Explore
Stevia Putri
Last edited February 26, 2026
If you're managing support across multiple teams or brands in Zendesk, you need reports that show exactly what each group is handling. Filtering your Explore reports by group and brand lets you segment data so you can see which teams are busiest, which brands need more attention, and where to allocate resources.
In this guide, I'll walk you through how to filter Zendesk Explore reports by group and brand. I'll cover the step-by-step process for both report-level and dashboard-level filters, explain a common limitation that trips up many users, and share some tips to make your reporting more effective.
What you'll need
Before you start filtering reports, make sure you have:
- Zendesk Support Professional or Enterprise plan (multi-brand requires these tiers)
- Zendesk Explore Professional or Enterprise access
- Editor or Admin permissions in Explore to create and modify reports
- Multi-brand feature enabled in your account settings (only needed for brand filtering)
- Basic familiarity with Explore datasets, particularly Support - Tickets
If you're missing any of these, you'll need to upgrade your plan or request permissions from your account admin.
How to filter by ticket group in Zendesk Explore
Let's start with the most common use case: filtering reports to show only tickets assigned to specific groups.
Step 1: Create or open a report
Navigate to Explore in your Zendesk account, then click on Reports in the left sidebar. You can either create a new report or open an existing one. If you're creating a new report, select the Support - Tickets dataset, since that's where the Ticket group attribute lives.
Step 2: Add the Ticket group filter
Once your report is open, look for the Filters panel on the right side. Click Add to see the list of available attributes. You can either scroll through the list or type "Ticket group" in the search box to find it faster. Select Ticket group from the list and click Apply.
The filter will appear in your Filters panel, but it won't actually filter anything yet. You need to configure which groups to include.
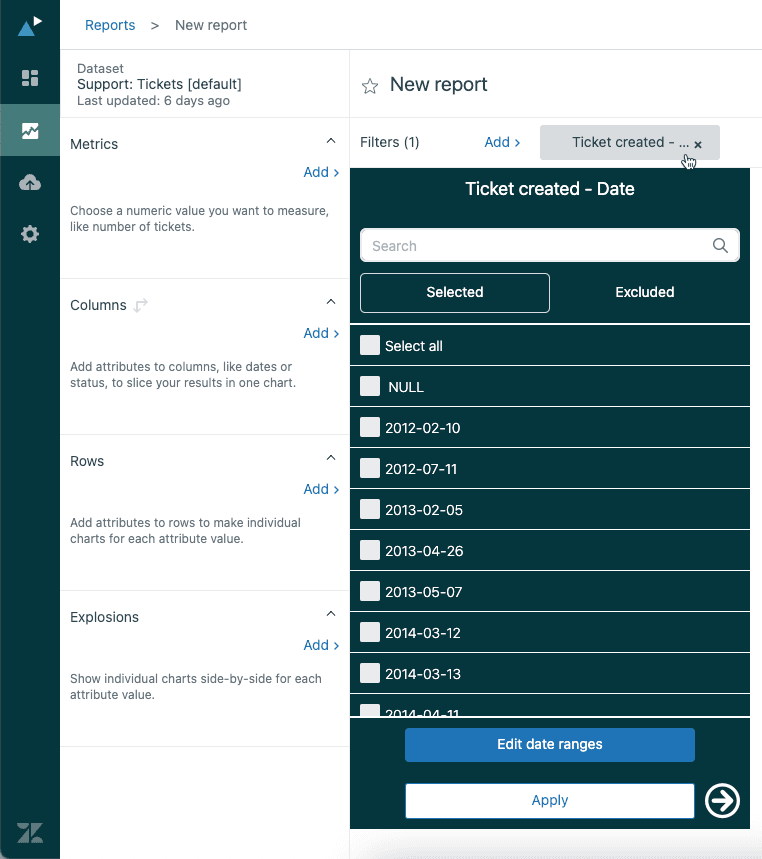
Step 3: Configure group filter values
Click on the Ticket group filter you just added. This opens a panel showing all the groups in your Zendesk account. You'll see checkboxes next to each group name.
Select the groups you want to include in your report. If you have many groups, use the search box to find specific ones quickly. Only the first 100 values display by default, so click the arrow next to the Apply button if you need to see more.
Once you've selected your groups, click Apply. Your report results will update immediately to show only tickets assigned to the groups you selected.
Step 4: Save and verify results
Give your report a descriptive name that includes the filter criteria, something like "Ticket Volume - Support Group Only" or "Solved Tickets by Tier 1 Groups." This makes it easier to find later and helps teammates understand what the report shows.
Take a moment to verify the results make sense. The ticket counts should be lower than an unfiltered report, and you should only see the groups you selected. If something looks off, double-check your filter selections.
How to filter by brand in Zendesk Explore
Now let's look at filtering by brand, which is essential if you run multiple support operations from a single Zendesk account.
Step 1: Access the Ticket Brand attribute
The Ticket Brand attribute is available in the Support - Tickets dataset. There's also an Update ticket brand attribute in the Updates history dataset if you need to track brand changes over time.
Here's the difference: Ticket Brand shows the current brand assigned to a ticket, while Update ticket brand shows what brand a ticket belonged to after a specific update. If tickets get moved between brands, the Updates history dataset lets you see that movement.
Step 2: Add Ticket Brand as a filter
In your report's Filters panel, click Add and search for "Ticket Brand." Select it and click Apply. Like with the group filter, this adds the filter to your panel but doesn't filter the results yet.
Step 3: Select brands to include
Click the Ticket Brand filter to open the brand selection panel. You'll see all the brands configured in your Zendesk account. Select the ones you want to include and click Apply.
You can also add Ticket Brand to your Rows or Columns panels instead of (or in addition to) filtering. This shows a breakdown of your metrics by brand rather than filtering some brands out entirely.
Common use cases for brand filtering
Once you have brand filtering set up, you can use it for several practical purposes:
- Compare ticket volume across brands to see which ones generate the most support requests
- Analyze performance metrics by brand to identify which brands might need process improvements
- Plan resource allocation by showing ticket trends per brand to justify staffing decisions
- Track SLA compliance per brand since different brands often have different service level agreements
Combining group and brand filters in Zendesk Explore
The real power comes when you combine these filters to answer specific questions like "How many tickets did the Support group handle for Brand A last month?"
Using multiple filters together
You can add both Ticket group and Ticket Brand to your Filters panel. When you do this, Explore applies them with AND logic, meaning a ticket must meet ALL filter conditions to appear in the results.
For example, if you filter for Group = "Support" AND Brand = "Brand A," you'll only see tickets that are both assigned to the Support group AND belong to Brand A. Tickets assigned to Support but belonging to Brand B won't appear. Neither will tickets for Brand A that are assigned to a different group.
Creating calculated attributes for advanced filtering
Sometimes you need more sophisticated filtering than the standard attributes allow. Zendesk Explore lets you create calculated attributes that group or categorize your data in custom ways.
For example, you might want to group brands by region:
IF ([Ticket brand]="Brand A" OR [Ticket brand]="Brand B") THEN "North America"
ELIF ([Ticket brand]="Brand C" OR [Ticket brand]="Brand D") THEN "Europe"
ELIF ([Ticket brand]="Brand E") THEN "Asia-Pacific"
ELSE "Other"
ENDIF
This creates a new attribute you can use for filtering or breakdowns. Calculated attributes are useful when you need rollup categories for executive reporting or when you want to group related brands together.
Adding group and brand filters to dashboards
Report-level filters are great for fixed reports, but dashboard filters let viewers change what they see without editing anything.
Step 1: Open dashboard in edit mode
Navigate to Explore > Dashboards and select the dashboard you want to modify. Click Edit to enter edit mode. You'll see your existing reports and any current filters.
Step 2: Add interactive filters
Click the + icon on your dashboard and select Add data filter. In the Data filters panel, choose either Ticket group or Ticket Brand as the attribute. You can add multiple data filters if you want viewers to filter by both.

Step 3: Configure filter behavior
After adding the filter, you can configure how it behaves:
- Set default values if you want the dashboard to open with specific groups or brands pre-selected
- Enable multi-select so viewers can choose multiple values at once
- Arrange the filter placement by dragging it to where you want it on the dashboard
Using filtered views for preset combinations
If you find yourself constantly switching between the same filter combinations (like "Support group + Brand A" vs. "Billing group + Brand B"), you can save these as filtered views. These are essentially bookmarks that remember your filter settings.
To create a filtered view, set your filters the way you want them, then click the bookmark icon and give your view a name. You can set one as the default so the dashboard always opens with those filters applied. This is especially useful for creating dashboard tabs that show different team views.

Understanding the user group limitation
Here's something that confuses a lot of Zendesk users: there's a difference between "ticket group" and "user group," and Explore handles them differently.
Ticket group is the group assigned to a ticket. This is what we've been filtering by so far, and it works well.
User group is the group a user belongs to. Here's the limitation: you cannot filter reports by whether a user is a member of a specific group. For example, you can't easily create a report showing "all tickets where the assignee is a member of the Support group."
It's seems that in explore (same as in insights) we still don't have the ability to filter based on a users group. I know we can filter based on ticket group, but I'm looking more at a group of users rather than what type of ticket they are looking at.
This is a real limitation that Zendesk hasn't addressed. If you need this kind of filtering, your workarounds are:
- Manually add individual users to filters (time-consuming but works for small teams)
- Use filtered views to create preset combinations
- Export data and filter it in a spreadsheet
- Consider an alternative analytics tool that supports this type of filtering
Tips and best practices for Zendesk Explore filter by group brand
After working with these filters for a while, a few patterns emerge that can save you time and headaches.
Use consistent naming conventions. When you save filtered reports, use names that describe both what the report shows and what filters are applied. Something like "Brand A - Support Group - Monthly Volume" is more useful than "Report v3."
Watch out for performance issues. Complex filters on large datasets can slow down report loading. If your reports are sluggish, try adding date filters to limit the time range, or move some filtering logic into the report itself rather than applying it at the dashboard level.
Understand report-level vs. dashboard-level filters. Report-level filters are baked into the report itself and always apply. Dashboard-level filters can be changed by viewers and override report filters. If you set a filter in both places, the dashboard filter wins.
Handle re-branded tickets carefully. When a ticket moves from one brand to another, the Ticket Brand attribute updates to show the current brand. If you need to track the original brand for historical analysis, consider using custom fields to capture that data at ticket creation.
Remember data sync delays. Explore data isn't real-time. Depending on your plan, there can be delays of 1-24 hours between ticket updates and when they appear in reports. Don't rely on Explore for real-time operational decisions.
A simpler alternative for complex filtering
Working with Zendesk Explore filters can be tedious. The interface requires clicking through multiple panels, the formulas for calculated attributes have a learning curve, and getting exactly the data you want often involves trial and error.
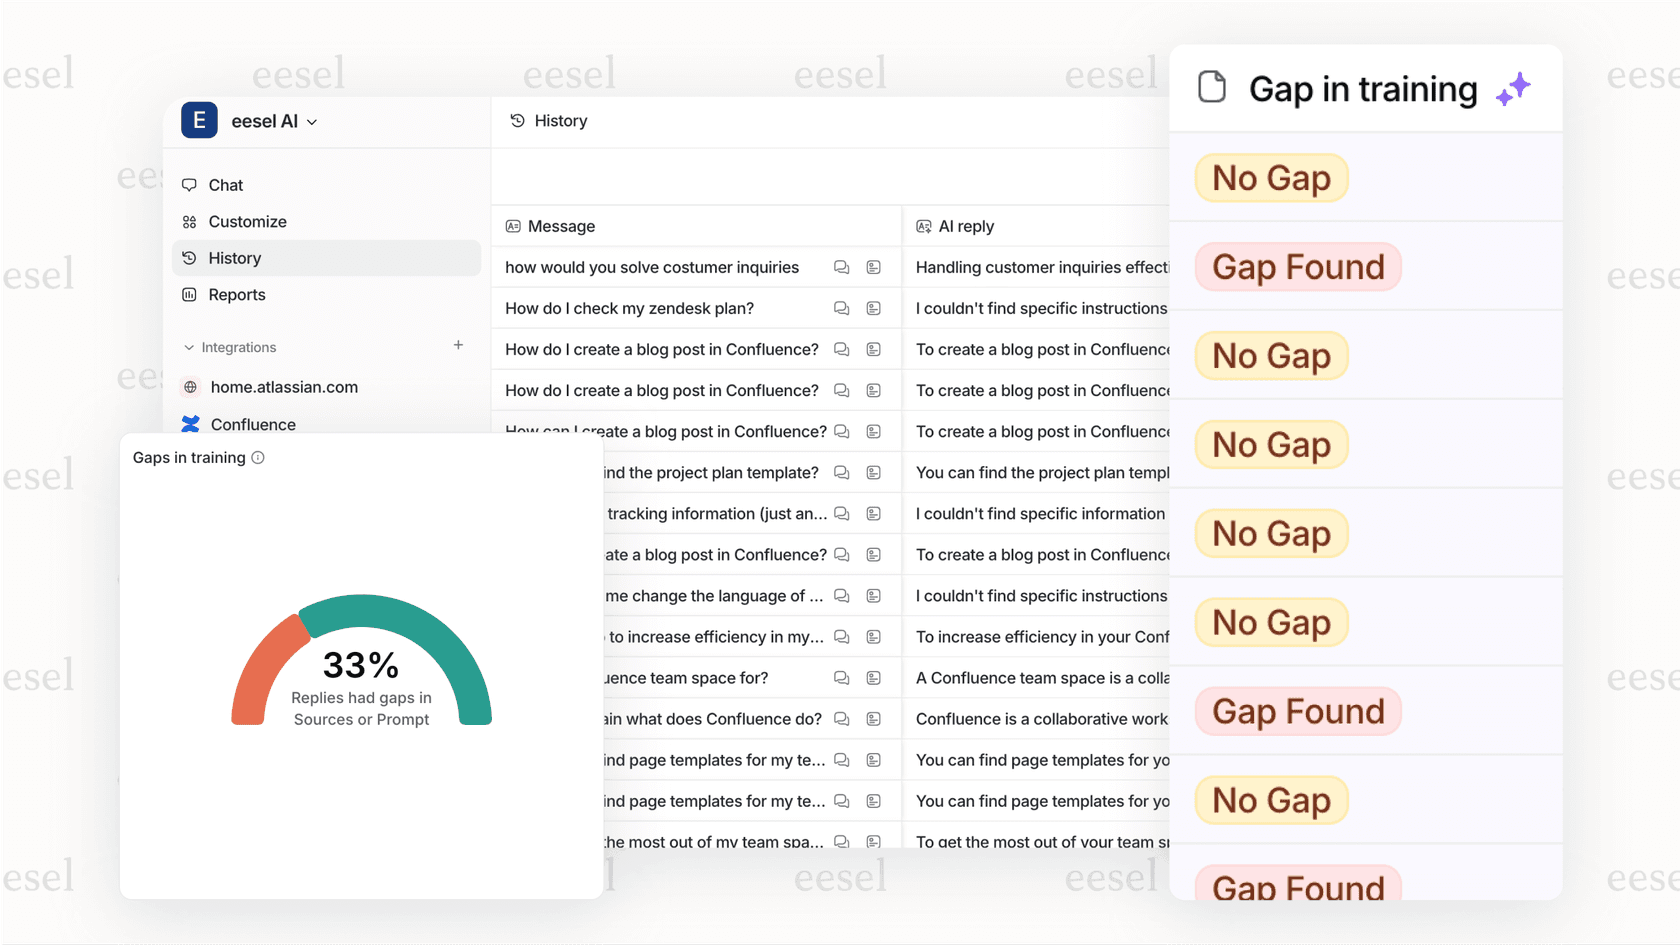
If you find yourself spending more time building reports than analyzing them, there's a simpler approach. We built eesel AI for Zendesk to make support analytics easier. Instead of navigating complex filter panels and writing formulas, you connect eesel AI to your Zendesk account and ask questions in plain English.
Want to know which group handled the most tickets for Brand A last month? Just ask. Need to compare resolution times across brands? Ask that too. You don't need to know which dataset to use or which attributes to filter by.
Here's how we handle multi-brand and multi-group reporting differently:
- No complex filter configuration - Ask questions naturally instead of building calculated attributes
- Automatic insights - We surface trends across your brands and groups automatically
- Faster setup - Connect in minutes instead of spending hours configuring reports
- Natural language queries - "Show me ticket volume by group for Brand A" instead of clicking through filter panels
If you're spending more time building reports than acting on insights, try eesel AI for a simpler way to analyze your Zendesk data.
