How to filter by date range in Zendesk Explore: A complete guide
Stevia Putri
Last edited February 26, 2026
If you're managing customer support, you've probably stared at a report showing ticket data from all time and wondered how to focus on just last month. Or maybe you need to compare Q3 performance to Q4, but your dashboard is showing everything since you started using Zendesk.
This is where date filtering in Zendesk Explore becomes essential. Whether you're tracking ticket trends, measuring agent performance, or analyzing seasonal patterns, the ability to filter by date range turns overwhelming data into actionable insights.
In this guide, you'll learn exactly how to filter by date range in Zendesk Explore using both report-level and dashboard-level methods. We'll cover the step-by-step process, common pitfalls, and best practices to make your reporting more effective.
While Explore gives you the raw data, turning those insights into action takes time. Many support teams complement their Explore reporting with AI-powered analytics that automatically surface patterns and recommendations.
Understanding date filtering in Zendesk Explore
There are two main approaches to date filtering in Explore, and choosing the right one depends on your use case.
Report-level filtering is best when you're building a specific analysis for yourself or a small team. You add date filters directly to the report, and those filters stay with the report wherever it appears. This works well for standardized reports that always need the same date range.
Dashboard-level filtering is better for shared dashboards where different viewers need different date ranges. A dashboard time filter lets anyone viewing the dashboard adjust the date range without editing the underlying reports. This is ideal for executive dashboards or team performance boards.
The key date attributes you will work with include:
- Ticket created - Date When tickets were originally submitted
- Ticket solved - Date When tickets were marked as resolved
- Ticket updated - Date When tickets were last modified
One detail that often trips people up: the date format shown in Explore depends on your user profile language setting. If your profile is set to English (United States), dates display as MM/DD/YYYY. Other language settings use different formats, so keep this in mind when collaborating with international teams. For more details, see Zendesk's documentation on date formats.
Method 1: Adding date filters to reports
The most straightforward way to filter by date range is adding filters directly to your reports. You can do this in two ways depending on whether you want the date to appear in your visualization.
Using the Filters panel
Adding a date attribute to the Filters panel lets you narrow results without cluttering your report with a date column. This is useful when you want to filter by date but don't need to see the actual dates in your output.
To add a date filter using the Filters panel:
- In Explore, create a new report or open an existing one
- Add at least one metric to your report
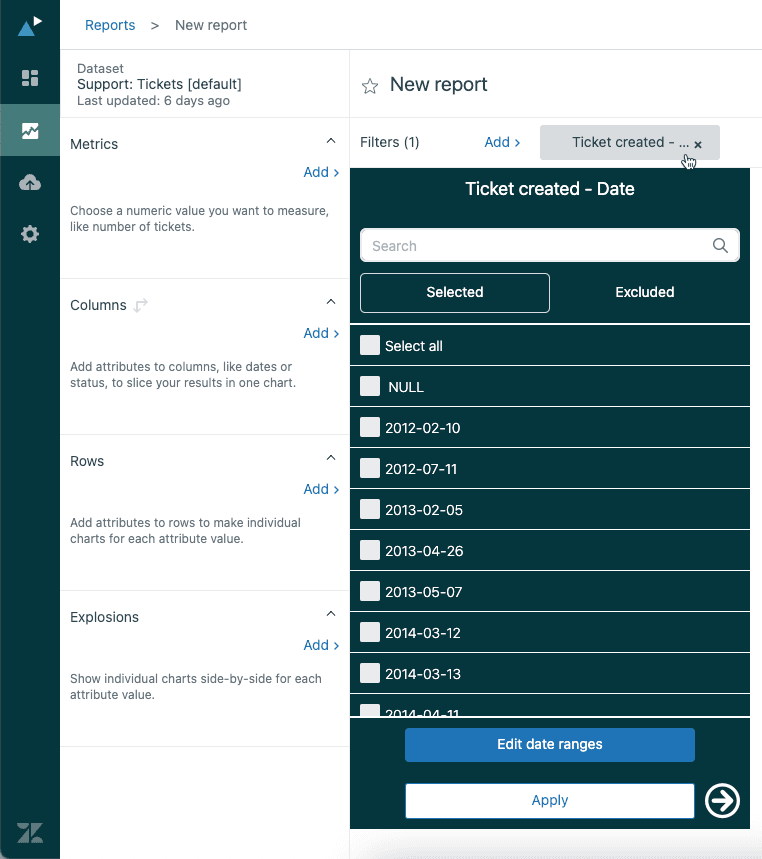
- In the Filters panel, click Add
- From the list of attributes, select a date attribute like Time - Ticket created then Ticket created - Date
- Click Apply
- Click the date attribute you just added to open the filter panel
- Click Edit date ranges to configure your date range
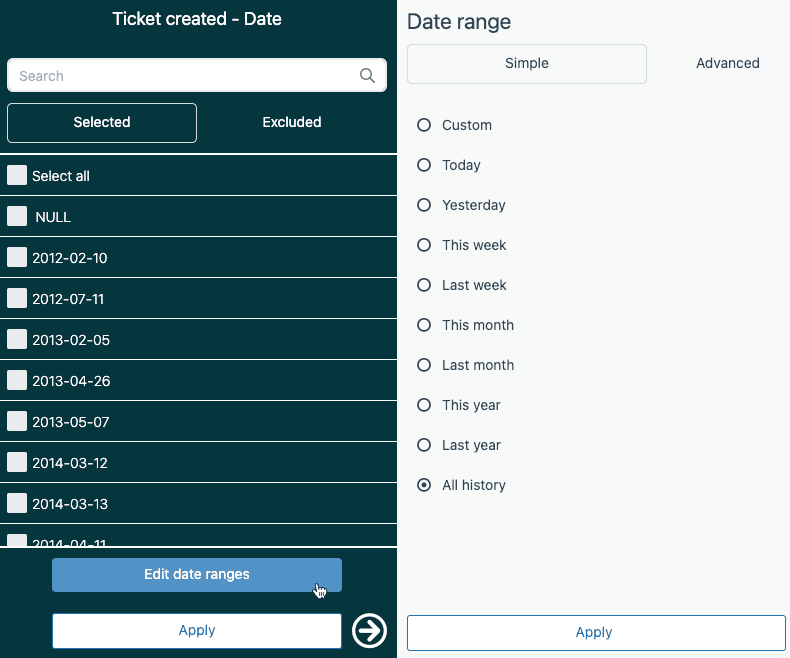
The Edit date ranges option gives you two modes:
Simple ranges include presets like Today, Yesterday, Last 7 days, Last 30 days, Last week, and Last month. These update automatically as time passes.
Advanced ranges let you specify exact day counts like "20 days in the past" or set up repeating patterns for business reporting needs. This is helpful for fiscal calendars or non-standard reporting periods.
Using the Columns or Rows panel
When you want the date to appear in your report while also filtering it, add the date attribute to the Columns or Rows panel instead.
To filter by date in the Columns or Rows panel:
- Add your date attribute to either the Columns or Rows panel
- Click the attribute to open the filter panel
- Select specific date values you want to include, or click Edit date ranges for range-based filtering
- Click Apply
The filter panel shows the first 100 values by default. If you need more, click the arrow next to the Apply button or use the search field to find specific dates. When filtering by date attributes in Columns or Rows, the attribute itself appears in your report visualization alongside your filtered results. Learn more about filtering Explore reports in the official documentation.
Method 2: Adding time filters to dashboards
Dashboard-level time filters give viewers control over date ranges without letting them edit the underlying reports. This is perfect for sharing interactive dashboards with managers or executives.
The new dashboard experience
Zendesk has introduced a new dashboard experience with improved filtering capabilities. To use dashboard time filters effectively, you'll first need to remove any existing time filters from your individual reports.
To set up dashboard-level date filtering:
- Open your dashboard and click Edit
- For each report on the dashboard, click the report name then Edit in report builder
- Remove any time or date filters by selecting Select all values and clicking Apply
- Save each report back to the dashboard
- In the dashboard edit view, click the + icon in the top right
- Select Time filter
- Choose the date attribute you want to filter by, such as Ticket updated
- Click the time filter you added, then under Link filters, add the corresponding date types for your reports
For complete instructions, see Zendesk's guide on dashboard filtering.
For example, if you have a report showing "Tickets: Solved tickets," link the filter to Ticket solved. If you have "Tickets: Created tickets," link it to Ticket created.
You can also exclude filters from reports where they don't apply. From the dashboard edit page, click each report and select filters to exclude under Exclude from filters. This prevents dashboard filters from affecting reports where they're not relevant. For more details on dashboard filters, check out Zendesk's dashboard filters guide.
Interactive dashboard filtering
Once configured, dashboard viewers can change date ranges directly on the dashboard without editing anything. They simply click the time filter and select their desired range.
You can combine time filters with data filters for even more flexibility. For example, add a data filter for Assignee name so viewers can see performance for specific agents during specific time periods.
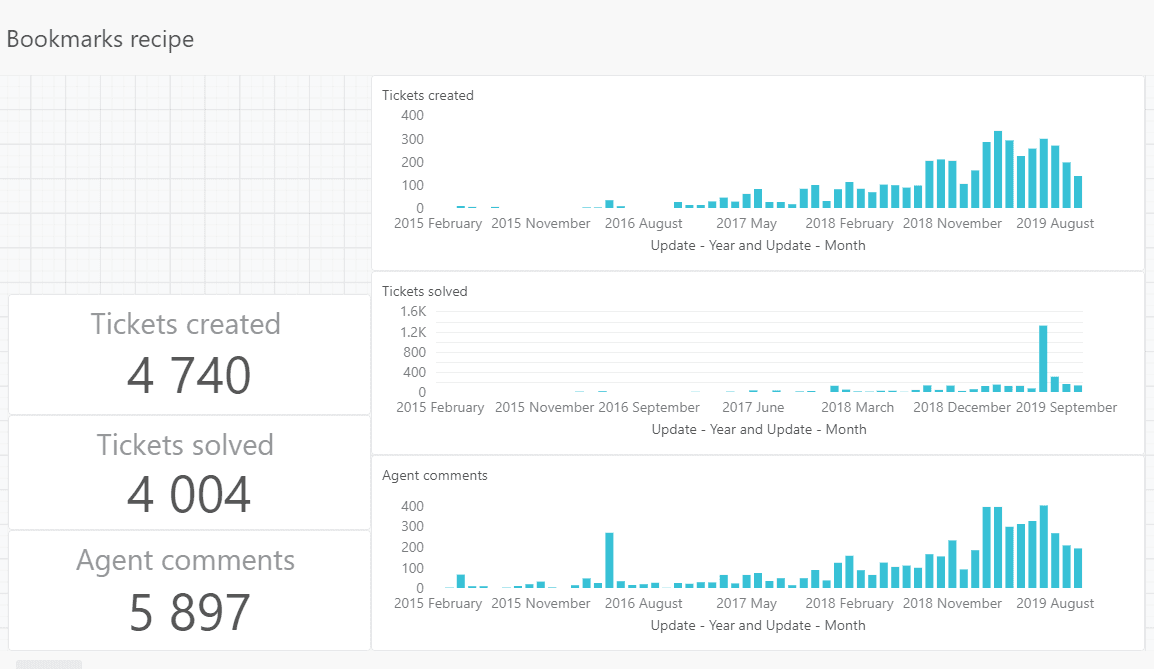
For frequently used date range combinations, create bookmarks. Bookmarks save specific filter configurations that viewers can switch between with a single click. This is useful for standard views like "This Week," "Last Month," or "Q4 2025." Learn more about dashboard bookmarks and advanced filtering.
Common issues and how to fix them
Even experienced Explore users run into issues with date filtering. Here are the most common problems and their solutions.
Discrepancies between Support views and Explore queries
One of the most frustrating issues is when the same date filter produces different results in Zendesk Support views versus Explore queries.
The problem comes down to how each system calculates date ranges. In Support views, "In the past 7 days" counts from the current timestamp backward exactly 168 hours. In Explore, "7 days in the past" uses full calendar days from 00:00 on the first day to 23:59 on the last day.
This means a ticket created 6 days and 12 hours ago might show in an Explore "7 days" filter but not in a Support view "7 days" filter.
Solution: If you need to compare Support views and Explore queries directly, use "hours in the past" in Explore instead of "days in the past." This aligns the calculation methods and produces matching results. For more troubleshooting help, see Zendesk's article on query discrepancies.
Custom date attributes limitations
If you create custom calculated date attributes (for example, to start your week on Friday instead of Monday), you lose access to the convenient date range picker UI. Built-in date attributes show the "Edit date ranges" option, but custom date attributes often only allow selecting individual values.
Workaround: For custom fiscal calendars or non-standard week starts, consider creating multiple versions of your reports with hardcoded date ranges, or use dashboard filters with the standard date attributes while handling the custom logic in your calculated fields.
Filter conflicts
Dashboard filters override report-level filters. If you set a "Last 30 days" filter on a report, then add that report to a dashboard with a "Last 7 days" time filter, the dashboard filter wins. This can confuse viewers who expect to see the report's original date range.
Solution: Remove time filters from reports before adding them to dashboards with time filters. Use the dashboard filter as the single source of truth for date ranges on shared dashboards.
Best practices for date filtering
Following these practices will save you headaches and make your reports more useful.
Use dashboard filters for shared reports, report filters for personal analysis. If multiple people view a dashboard, give them control with dashboard filters. If you're building a report just for yourself, report-level filters are simpler.
Set meaningful defaults. Instead of showing "All time" data, set your default date range to something relevant like "Last 30 days" or "This month." This makes dashboards load faster and show more relevant information immediately.
Document your date logic. When you create calculated date attributes or custom ranges, add notes explaining what they represent. This helps other team members understand your reports and prevents confusion when someone needs to modify them later.
Test filters against known data points. Before sharing a report, verify your date filters are working correctly by checking a few specific tickets. Make sure tickets you know were created on certain dates appear (or don't appear) as expected.
Taking your analytics further with eesel AI
Zendesk Explore excels at historical reporting, but it requires manual setup for each report and doesn't automatically surface insights or predict trends. Every new question requires building a new report, and finding patterns across large datasets takes significant time.
This is where AI-powered analytics complements Explore. While Explore tells you what happened, tools like eesel AI help you understand what to do about it.
Here's how we extend what you get from Explore:
-
Automatic topic detection. Instead of manually categorizing tickets by date ranges, our AI identifies what customers are actually asking about across all time periods.
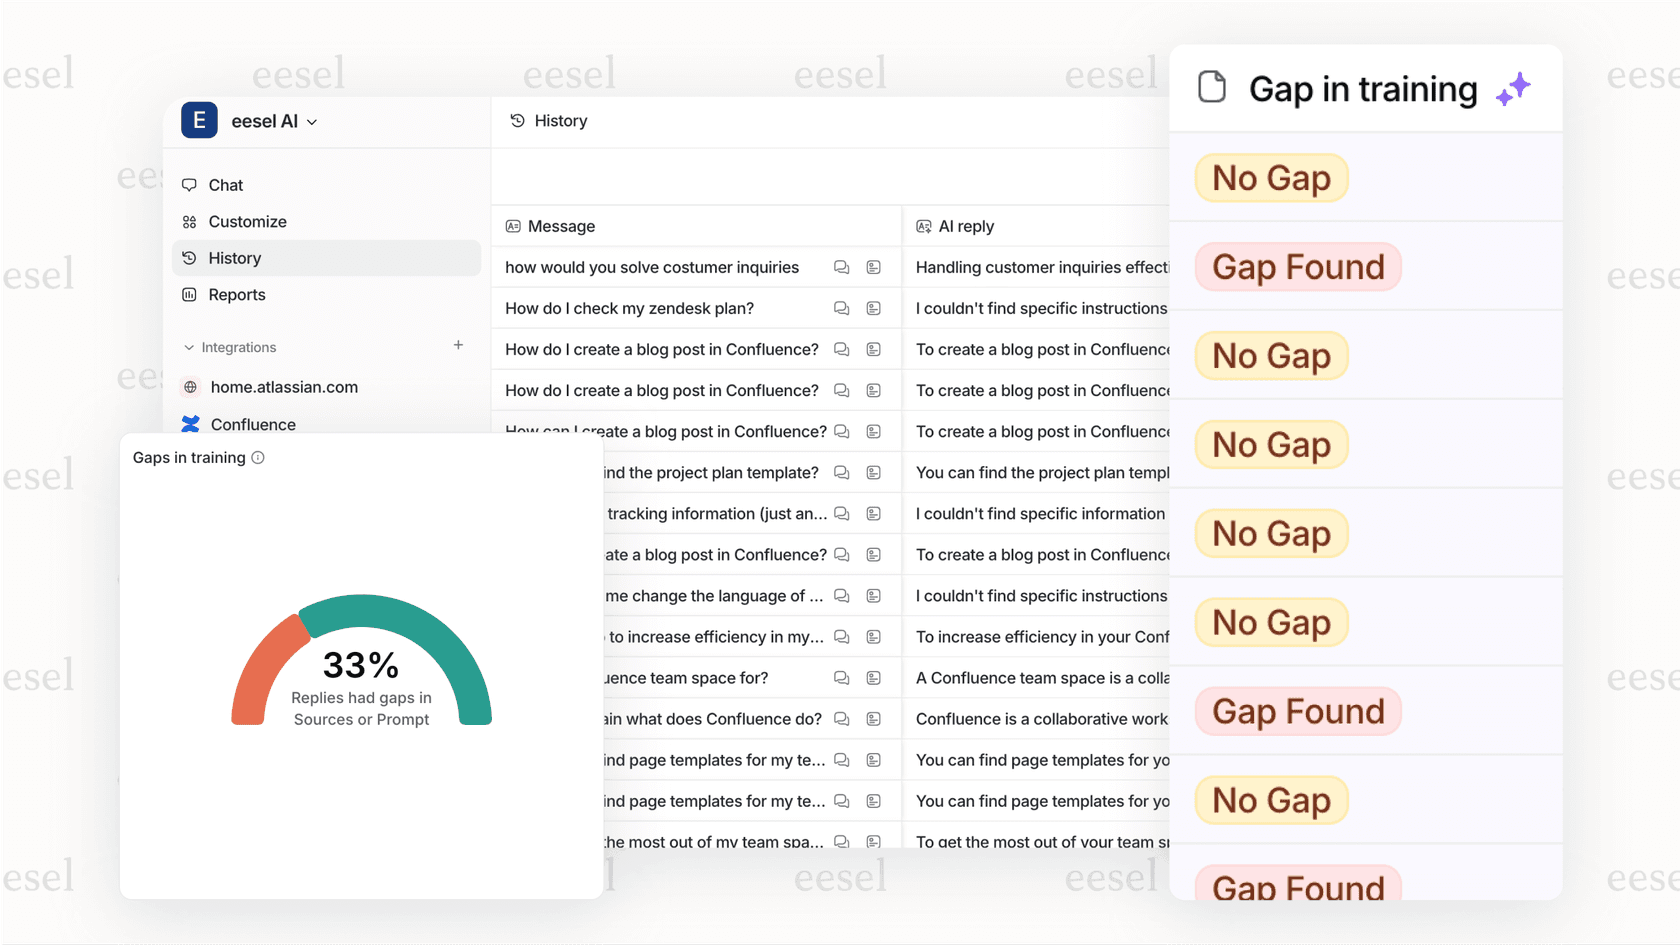
-
Knowledge gap analysis. We spot patterns in tickets that suggest missing help center articles or unclear documentation, helping you reduce ticket volume at the source rather than just reporting on it.
-
Simulation mode. Test how an AI agent would handle tickets before deploying it. See automation potential without risking customer experience.
-
Cross-platform insights. Connect your Zendesk data with knowledge from Confluence, Slack, and other tools for a complete view of your support operations.
The combination works well: Explore for structured historical reporting, AI analytics for pattern recognition and forward-looking insights. If you're looking to automate more of your support workflow, consider exploring eesel AI's AI Agent for autonomous ticket resolution.
Start filtering your Zendesk Explore reports by date range today
You now have everything you need to filter reports by date range in Zendesk Explore. Whether you choose report-level filters for specific analyses or dashboard filters for interactive team views, the key is matching the approach to your use case.
Start with a simple report. Add a date filter for "Last 30 days" and see how it changes your perspective on the data. Experiment with dashboard filters to give your team more flexibility. And when you run into discrepancies between Support views and Explore queries, remember to check whether you're using days or hours.
If you're ready to go beyond manual reporting and get AI-powered insights from your Zendesk data, explore what eesel AI can do for Zendesk for your support team.
