Understanding Zendesk Explore data delay and freshness
Stevia Putri
Last edited February 26, 2026
You open Zendesk Explore to check yesterday's ticket volume, click the "Yesterday" filter, and see... nothing. Empty. Or maybe you're trying to track SLA performance in real time, but the numbers feel off. If you've experienced this, you're not alone. Data delays in Zendesk Explore are a common source of confusion for support teams.
The gap between when something happens in your support queue and when it appears in Explore can range from minutes to days, depending on your plan and configuration. This guide breaks down exactly how Explore's data refresh works, why delays happen, and what you can do about them. We'll also look at how tools like eesel AI approach support analytics differently for teams that need immediate insights.

How Zendesk Explore data refresh actually works
Here's how it works. Explore pulls data from your Zendesk products in two different ways: historical reporting and live reporting. Understanding the difference is key to managing your expectations.
Historical reporting covers the bulk of what most teams use: ticket metrics, agent performance, SLA compliance, and trend analysis. This data syncs on a schedule that depends on your Zendesk plan.
Live reporting is only available on Enterprise plans and covers a limited set of real-time metrics like current queue status and active agent activity. This updates every 5-10 seconds.
Here's where it gets tricky. For hourly refresh plans, the sync doesn't happen "every hour on the hour." Instead, each new sync starts one hour after the most recent sync ends. The start time is randomized within that hour window. If your previous sync took a while (some take 2+ hours depending on data volume), you could be looking at up to 4 hours before fresh data appears.
Think of it like a bus that runs hourly, but the schedule shifts based on when the previous bus finished its route. Sometimes you wait 45 minutes. Sometimes you wait 75. The "hourly" label doesn't tell the whole story.

Data refresh intervals by plan
Your refresh schedule depends on which Zendesk plan you're on. Here's the breakdown:
Daily refresh plans
If you're on Suite Team, Suite Growth, or using Explore Lite with any Support plan, your data syncs once every 24 hours. The sync happens at midnight in your account's timezone, though the exact timing is randomized within the first hour after midnight.
The limitation here is clear: you can't customize when this sync happens. If your team operates in a different timezone than your account setting, or if you need data fresh for a morning standup, you're working with yesterday's numbers.
Hourly refresh plans
Suite Professional, Suite Enterprise, Suite Enterprise Plus, Explore Professional, and Explore Enterprise plans get hourly refreshes. But remember the mechanics we covered: "hourly" means "starts one hour after the last sync finished," with randomization built in.
In practice, this means your data is typically 1-3 hours behind real time. During high-volume periods or if Zendesk is experiencing load issues, that can stretch to 4 hours.
Live data (Enterprise only)
Enterprise plans have access to live dashboards and live data widgets. These update every 5-10 seconds and cover metrics like:
- Current queue size
- Active agents
- Tickets being worked right now
The catch? Live data only covers a small subset of metrics. You can't get historical SLA analysis or trend data in real time. It's built for operational monitoring, not deep reporting.
The 30-day inactivity rule
Here's a gotcha that catches many teams off guard. If no one accesses your Explore reports or dashboards for more than 30 days, Zendesk automatically downgrades your refresh interval to weekly. This is a cost-saving measure on their end.
When someone does access a report (or a scheduled dashboard email goes out), the frequency returns to normal. But if you're wondering why your data suddenly seems ancient, check when your team last actively used Explore.
Common data delay issues and user experiences
The official documentation tells you refresh intervals. The Zendesk community tells you what actually happens. Here's what users report:
The "yesterday's data is empty" problem
This comes up repeatedly in community posts. Users set a filter for "yesterday" and get blank results, even though tickets were definitely created yesterday.
According to the tooltip, data is refreshed every hour. However what I'm seeing is that it's refreshing at the end of the day, with a day's delay. This behaviour also means that the default filtered view for 'Yesterday' is blank for me.
I absolutely get the data only being refreshed daily and I think that's fine but it's effectively 2 days behind and you can never get a view of yesterdays data alone with a detailed breakdown.
Data appearing 2+ days behind
Even on hourly plans, users report seeing data that's effectively two days old. If your last sync was at 11 PM two days ago and it's now 9 AM, you're missing almost two full days of activity.
Even if it's refreshed daily, why is it always a day behind? Yesterday's data always shows empty. For example, right now in our account time it's 9:24 on 5 April, but the last refresh is 00:59 on 3 April. So I can't see anything that's happened in the last 2 days.
Zendesk's response to these complaints has been consistent: they're aware of the limitations and working on improvements, but for now, the API data refreshes daily at best.

Workarounds and solutions for data freshness
You can't make Zendesk sync faster, but you can work smarter within the constraints. Here are practical approaches:
Creating a last refresh timestamp
The most helpful workaround is adding a visible "last refresh" indicator to your dashboards. This at least tells viewers exactly how stale the data is, so they can factor that into their decisions.
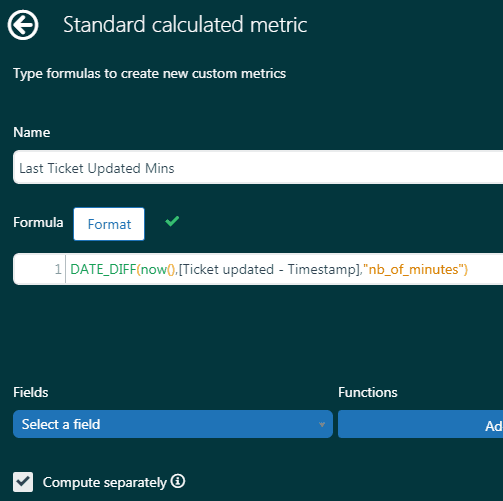
Zendesk provides a recipe for this. You'll create:
- A standard calculated metric using:
DATE_DIFF(now(),[Ticket updated - Timestamp],"nb_of_minutes") - A standard calculated attribute using:
DATE_LAST([Ticket updated - Timestamp])
Display these on your dashboard and viewers will see something like "Last updated: 127 minutes ago" or "Last sync: March 15, 11:47 PM." It's not fresh data, but it's transparency about data age.
Using live dashboards (Enterprise)
If you've got an Enterprise plan, the Live Data dashboard is your friend for operational monitoring. It won't give you historical analysis, but it'll show you what's happening right now: current queue size, agents online, tickets in progress.
Access it by going to Dashboards in Explore and selecting "Live data" from the list. The metrics here update every 5-10 seconds, making them useful for real-time decision-making.
Scheduled dashboard deliveries
One way to work around the delay is to time your dashboard deliveries strategically. If you know your data typically refreshes by 8 AM, schedule your morning snapshot emails for 8:30 AM. That way, your team gets the freshest possible data without having to check Explore manually and guess whether the sync has run yet.
You can schedule both email and Slack deliveries. The benefit of Slack snapshots is that they spark discussion: team members can comment on the data, ask questions, and flag issues right where they're already communicating.
When to consider alternatives
Sometimes workarounds aren't enough. If your team needs genuinely current data for operational decisions, you have a few options. According to Zendesk's own documentation, even hourly refresh plans can experience delays of up to 4 hours during high-volume periods.
Third-party dashboard tools like Geckoboard and Bold BI connect to Zendesk's API and refresh more frequently. Geckoboard claims 10-minute updates, which they position as "6x quicker than Zendesk Explore." These tools are worth evaluating if your primary need is visualization and team visibility rather than deep analysis.
Direct API access lets you build custom reporting that pulls current ticket data on demand. This requires development resources but gives you complete control over refresh timing.
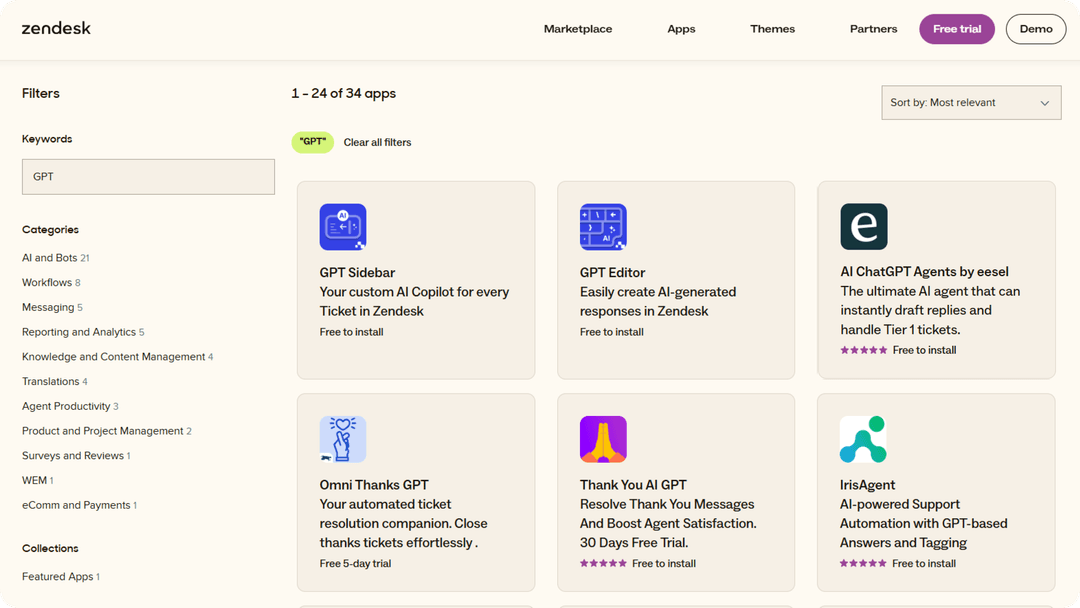
Alternative AI platforms take a different approach entirely. Instead of syncing data on a schedule, they connect directly to your help desk and work with tickets as they arrive. This is where eesel AI fits in.
Getting real-time insights with eesel AI
If you're tired of waiting for data to sync, there's a different approach. eesel AI connects directly to your Zendesk instance and works with your tickets in real time. No hourly syncs. No wondering if "yesterday's data" actually includes yesterday.

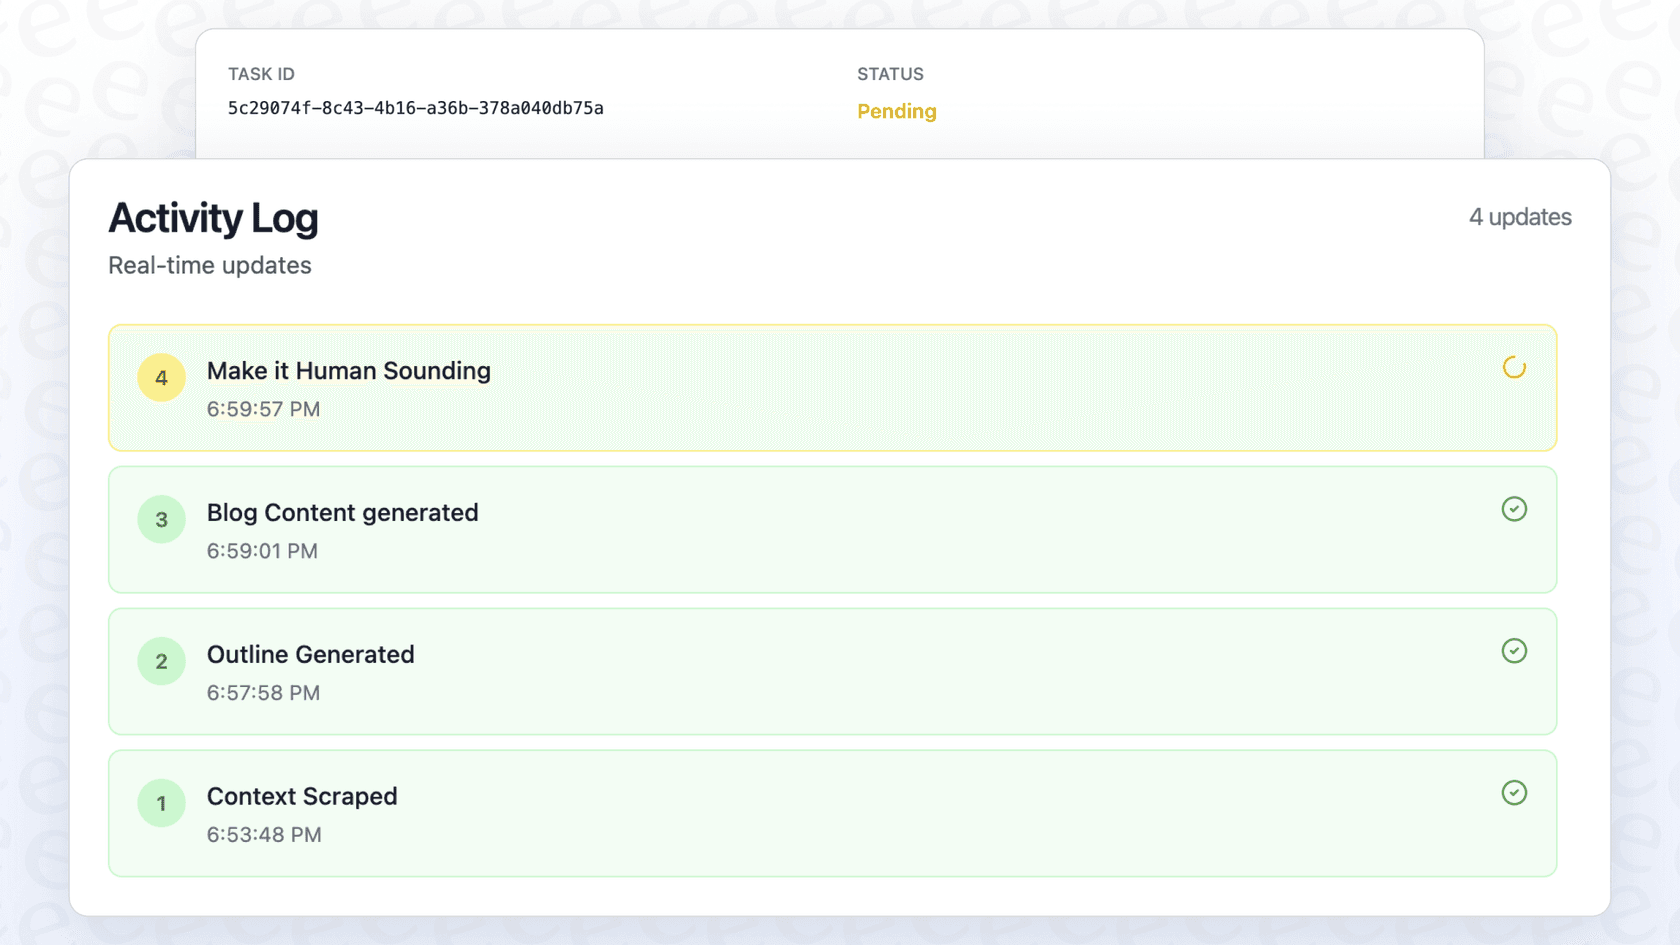
When you connect eesel AI to Zendesk, it reads your tickets, help center articles, and macros directly. This means:
- Immediate visibility: See current ticket volume, trending issues, and team performance without waiting for a sync cycle
- AI-powered analysis: Beyond standard metrics, eesel AI identifies patterns, suggests responses, and flags escalation risks as tickets arrive
- No data delays: Because eesel works directly with your Zendesk data, there's no refresh interval creating gaps in your reporting
You can start with eesel AI's Copilot features to draft responses and get immediate insights, then level up to full AI Agent capabilities for autonomous ticket handling. For teams where data freshness directly impacts customer experience, this real-time approach can be a meaningful operational advantage.
Check eesel AI's pricing to see how it compares to upgrading your Zendesk plan for better reporting, or try it free to experience real-time support analytics firsthand.
Frequently Asked Questions
Share this article

Article by
Stevia Putri
Stevia Putri is a marketing generalist at eesel AI, where she helps turn powerful AI tools into stories that resonate. She’s driven by curiosity, clarity, and the human side of technology.