Every support team tracks tickets solved, first reply time, and customer satisfaction. But what happens when you need to measure something Zendesk doesn't track out of the box? Maybe you want to count only calls abandoned after a 10-second threshold, or categorize tickets by response speed. Zendesk Explore custom metric calculation gives you that flexibility.
Custom metrics let you define exactly what counts toward your KPIs. Instead of working around rigid default reports, you can build metrics that reflect how your business actually operates. This guide walks you through creating custom metrics in Explore, from understanding the two different metric types to writing your first formula.
While Explore handles historical reporting beautifully, some teams find they need more than rule-based metrics to understand their support data. We'll touch on how AI analytics can complement your Explore setup at the end.
What you'll need
Before diving in, make sure you've got:
- Zendesk Suite: Professional, Enterprise, or Enterprise Plus plan
- Explore: Professional or Enterprise (custom metrics aren't available on Lite)
- Basic familiarity with the Explore report builder
- Understanding of your data structure: Know which datasets contain the metrics you want to work with (Support: Tickets, Talk: Calls, etc.)
If you're unsure about your plan level, check with your Zendesk admin. Custom metrics require specific plan tiers.
Understanding custom metric types
Explore offers two ways to create custom calculations. Getting this distinction right'll save you headaches later.
Standard calculated metrics
Standard calculated metrics filter and transform raw data before aggregation happens. Think of them as creating a new column in your dataset that gets calculated for every single row.
Use these when you want to:
- Count only tickets meeting specific conditions
- Create conditional logic based on ticket attributes
- Filter data at the row level before summarizing
For example, counting only inbound calls abandoned after 10 seconds requires a standard calculated metric. You're filtering which individual call records to include before counting them up.
Result metric calculations
Result metric calculations work after data has already been aggregated. They take the summarized results from your report and perform additional math on them.
Use these when you want to:
- Calculate percentages from existing metrics
- Add margins or markups to cost calculations
- Compare aggregated values against each other
For instance, calculating what percentage of your total tickets are currently on-hold requires a result metric calculation. You need the total count first, then you calculate the percentage.
When to use each type
Here's a simple framework: If your calculation depends on individual ticket attributes (channel, status, wait time), use a standard calculated metric. If your calculation works with already-summarized numbers (totals, averages, counts), use a result metric calculation.
Getting this wrong leads to confusing results. A percentage calculation built as a standard calculated metric will calculate percentages at the row level and produce nonsense when aggregated.
Step 1: Access the formula editor
Let's create your first custom metric. If you're new to Explore, you might want to check out Zendesk's hands-on tutorial for creating standard calculated metrics alongside this guide.
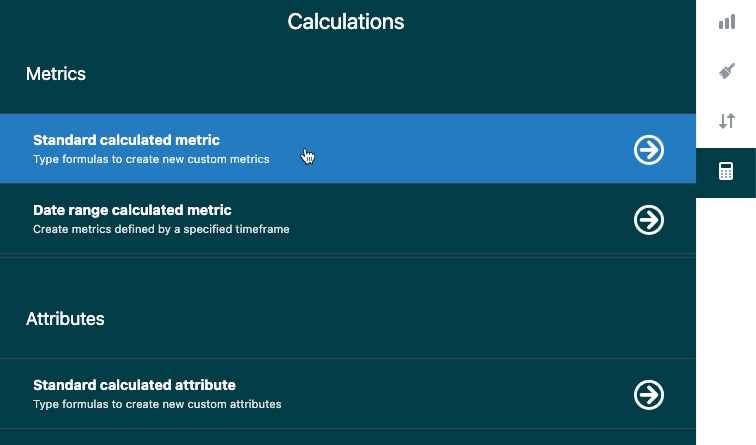
Open Zendesk Explore and either create a new report or open an existing one. In the report builder, look for the Calculations menu in the right sidebar. It has a calculator icon.
Click it, then select Standard calculated metric (or Standard calculated attribute if you're creating a grouping field rather than a number to count).
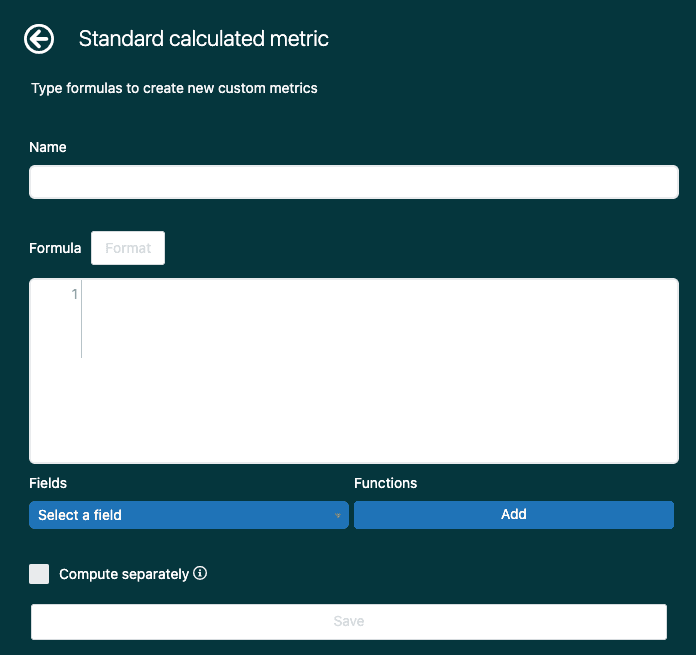
The formula editor panel opens on the right side of your screen. This is where you'll build your custom logic.
Step 2: Build your formula
Now for the actual work. The formula editor has three main areas: the name field at the top, the formula field in the middle, and the field/function selectors at the bottom.
Name your metric
Start with a clear, descriptive name. Something like "Long abandoned calls" or "Email tickets - Premium users." Avoid special characters: no quotation marks, parentheses, or square brackets in the name. These will cause errors if you reference this metric in other calculations later.
Understanding the formula structure
Most custom metrics use the IF/THEN/ENDIF structure. It works like this:
IF (condition) THEN [what to return] ENDIF
For multiple conditions, add AND or OR:
IF (condition1) AND (condition2) THEN [output] ENDIF
The formula editor provides autocomplete suggestions as you type. Pay attention to the green checkmark or red X at the bottom of the formula field. Green means your syntax is valid. Red means something's wrong.
Using the Fields selector
Instead of typing field names manually (and risking typos), use the Select a field button. It shows all available metrics and attributes for your current dataset. Click one to insert it into your formula at the cursor position.
Field references in formulas look like this: [Ticket channel] or [Call ID]. The square brackets are added automatically when you use the selector.
Using the Functions menu
The Add button under Functions shows available operators: IF, THEN, ELSE, AND, OR, and more. You can also type these directly if you prefer.
The VALUE() function
When comparing numeric metrics (like wait times or reply times), wrap them in VALUE(). This tells Explore to extract the actual number for comparison:
VALUE(First reply time (min)) >= 10
Without VALUE(), you're comparing the metric object itself rather than its numeric value.
Once your formula validates (green checkmark), click Save. Your metric is now available in the current dataset.
Step 3: Add the metric to your report
With your metric saved, it's time to use it.
In the Metrics panel on the left, click Add. Navigate to Calculated metrics and find your new metric by name. Click it, then select an aggregator.
Here's where many people get confused. Your formula returns individual values (like Call IDs or Ticket IDs). The aggregator tells Explore how to summarize those values.
- COUNT: Counts all values, including duplicates
- D_COUNT: Counts distinct values only (recommended for IDs)
- SUM: Adds numeric values together
- AVG: Calculates the average
For most use cases involving ticket or call counts, use D_COUNT to avoid double-counting.
Click Apply and your metric appears in the report. If you see zeros or unexpected results, check your formula logic and aggregator choice.
Common formula patterns and examples
Let's look at practical formulas you can adapt for your own reports. For more examples, Salto has an excellent guide on how to create custom metrics in Zendesk Explore with real-world use cases.
Pattern 1: Conditional counting with IF/THEN/ENDIF
Count tickets from a specific channel:
IF ([Ticket channel]="Email") THEN [Ticket ID] ENDIF
This returns the Ticket ID for every email ticket, and nothing for other channels. When you apply D_COUNT, you'll get the total number of email tickets.
Pattern 2: Multiple conditions with AND
Count long-abandoned calls (inbound calls abandoned in queue after waiting 10+ seconds):
IF
([Call direction]="Inbound")
AND
([Call completion status]="Abandoned in queue")
AND
(VALUE(Call wait time (sec)) >= 10)
THEN [Call ID]
ENDIF
Each condition goes in parentheses. AND requires all conditions to be true. Use OR if any single condition should trigger inclusion.
Pattern 3: Date-based calculations
Count tickets solved within 20 minutes:
IF
VALUE(First resolution time (min)) < 20
THEN [Ticket ID]
ENDIF
Time-based metrics work the same way as other numeric comparisons. Just remember VALUE() for the comparison.
Pattern 4: Percentage calculations
For percentages, use a result metric calculation instead. With your report open, click the result manipulation menu (not the Calculations menu), then select Result metric calculation.
Calculate percentage of on-hold tickets:
COUNT(On-hold tickets) / COUNT(Tickets)
After adding this calculation, change the display format to percentage in the chart configuration panel.
Troubleshooting common issues
Even experienced admins hit snags with custom metrics. Here's how to fix the most common problems.
Red error messages in the formula editor
Syntax errors: Missing ENDIF is the most common culprit. Every IF must have a matching ENDIF. Mismatched parentheses also cause errors. Count your opening and closing parentheses to make sure they've balanced.
Field name typos: If you type field names manually, double-check spelling. The autocomplete suggestions help you avoid this.
Using calculated metrics in calculated attributes: This isn't supported. Standard calculated attributes can only reference default metrics, not other calculated metrics. If you need this logic, you'll need to restructure your approach.
Unexpected results
Null values: Tickets with no value for a metric (like unresolved tickets having no resolution time) can behave unexpectedly. Add NULL checks:
IF VALUE(First reply time (min)) != NULL AND VALUE(First reply time (min)) < 10
Aggregator mismatches: Using SUM on IDs doesn't make sense. Using COUNT when you need D_COUNT gives inflated numbers. Check that your aggregator matches what your formula returns.
Filter conflicts: Dashboard filters can interact unexpectedly with hard-coded filters in your metric. If results seem off, test your metric in a report with no other filters applied.
Performance issues
Complex formulas with multiple nested conditions can slow down report loading, especially on large datasets. If reports are timing out:
- Simplify your formula where possible
- Split complex logic into multiple metrics
- Consider whether a result metric calculation would work instead
- Add report filters to reduce the dataset size before the metric calculates
Best practices for custom metrics
A little organization goes a long way when you're managing dozens of custom metrics.
Naming conventions: Use consistent prefixes to group related metrics. "Abandoned - Long" and "Abandoned - Short" sort together. "2024 - Email tickets" includes the year for metrics that might need updating later.
Document your formulas: Keep a spreadsheet or document listing each custom metric, its purpose, and its formula. When someone asks "how is this calculated?" six months later, you'll have the answer. Geckoboard's library of Zendesk Explore custom metrics is a great reference for common formulas.
Test against known data: Before rolling out a new metric to your team, verify it returns expected results. Pick a few tickets you know meet the criteria and confirm they're counted correctly.
Use D_COUNT for distinct counts: When counting IDs (tickets, calls, users), D_COUNT prevents duplicates from inflating your numbers. It's almost always what you want.
Avoid dependencies: Don't build calculated metrics that reference other calculated metrics. If the underlying metric changes or breaks, your dependent metric'll break too. Keep each metric self-contained.
Going beyond Explore with AI analytics
Custom metrics in Explore are powerful for tracking defined KPIs, but they have limitations. You're working with historical data, and you need to know exactly what you're looking for before you build the metric.
What about insights you didn't think to track? Patterns in customer language that predict escalations? Correlations between ticket types and resolution outcomes? These require a different approach.
This is where AI teammates like eesel AI complement Explore's capabilities. While Explore answers "how many tickets met these criteria," AI analytics can surface "what patterns exist in tickets I haven't analyzed yet."

For example, eesel AI reads your tickets as they arrive, identifies sentiment trends, and flags potential issues before they escalate. It doesn't replace your carefully crafted Explore reports. It adds a layer of real-time insight that rule-based metrics can't provide.
If you're finding that custom metrics give you the numbers but you're still missing the broader picture, explore how AI analytics work alongside your existing reporting.
Start building better reports today
You now have everything you need to create custom metrics in Zendesk Explore. The key concepts to remember:
- Standard calculated metrics filter raw data before aggregation
- Result metric calculations work on already-summarized results
- IF/THEN/ENDIF is your bread and butter for conditional logic
- VALUE() extracts numbers for numeric comparisons
- D_COUNT is your friend for counting distinct IDs
Start simple. Build a basic conditional metric, verify it works, then add complexity. The formula editor validates as you go, so you get immediate feedback on syntax errors.
Once you're comfortable with custom metrics, you might find yourself wanting insights that go beyond what rules-based reporting can offer. That's when it's worth exploring how AI-powered analytics can complement your Explore setup.
Ready to see what AI can add to your support analytics? Check out eesel AI's approach to support intelligence.
