How to use the Zendesk Explore Talk dataset: A complete guide
Stevia Putri
Last edited February 26, 2026
If you're running a call center with Zendesk Talk, you have a goldmine of data sitting in your account. Every call, hold, transfer, and wrap-up is being tracked. The problem? Most teams barely scratch the surface of what's possible with this data.
The Zendesk Explore Talk dataset gives you access to detailed call analytics, but getting started can feel overwhelming. Between call legs, metrics, attributes, and datasets, it's easy to get lost in the terminology.
This guide walks you through everything you need to know to start analyzing your Talk data effectively. We'll cover the key concepts, walk through building your first report, and show you how to avoid common mistakes that trip up new users.
What is the Zendesk Explore Talk dataset?
The Talk dataset is a collection of metrics and attributes that let you analyze your Zendesk Talk call data. Think of it as a specialized database containing every detail about your calls: who called, how long they waited, which agent handled it, and what happened during the conversation.
To access the Talk dataset, you'll need:
- A Zendesk Suite plan (Team, Growth, Professional, Enterprise, or Enterprise Plus)
- Explore Light, Professional, or Enterprise
- Talk Professional or Enterprise for full reporting capabilities
The dataset captures data across the entire call journey: IVR interactions, queue time, agent talk time, hold time, consultations, transfers, and wrap-up activities. This gives you a complete picture of both customer experience and agent performance.
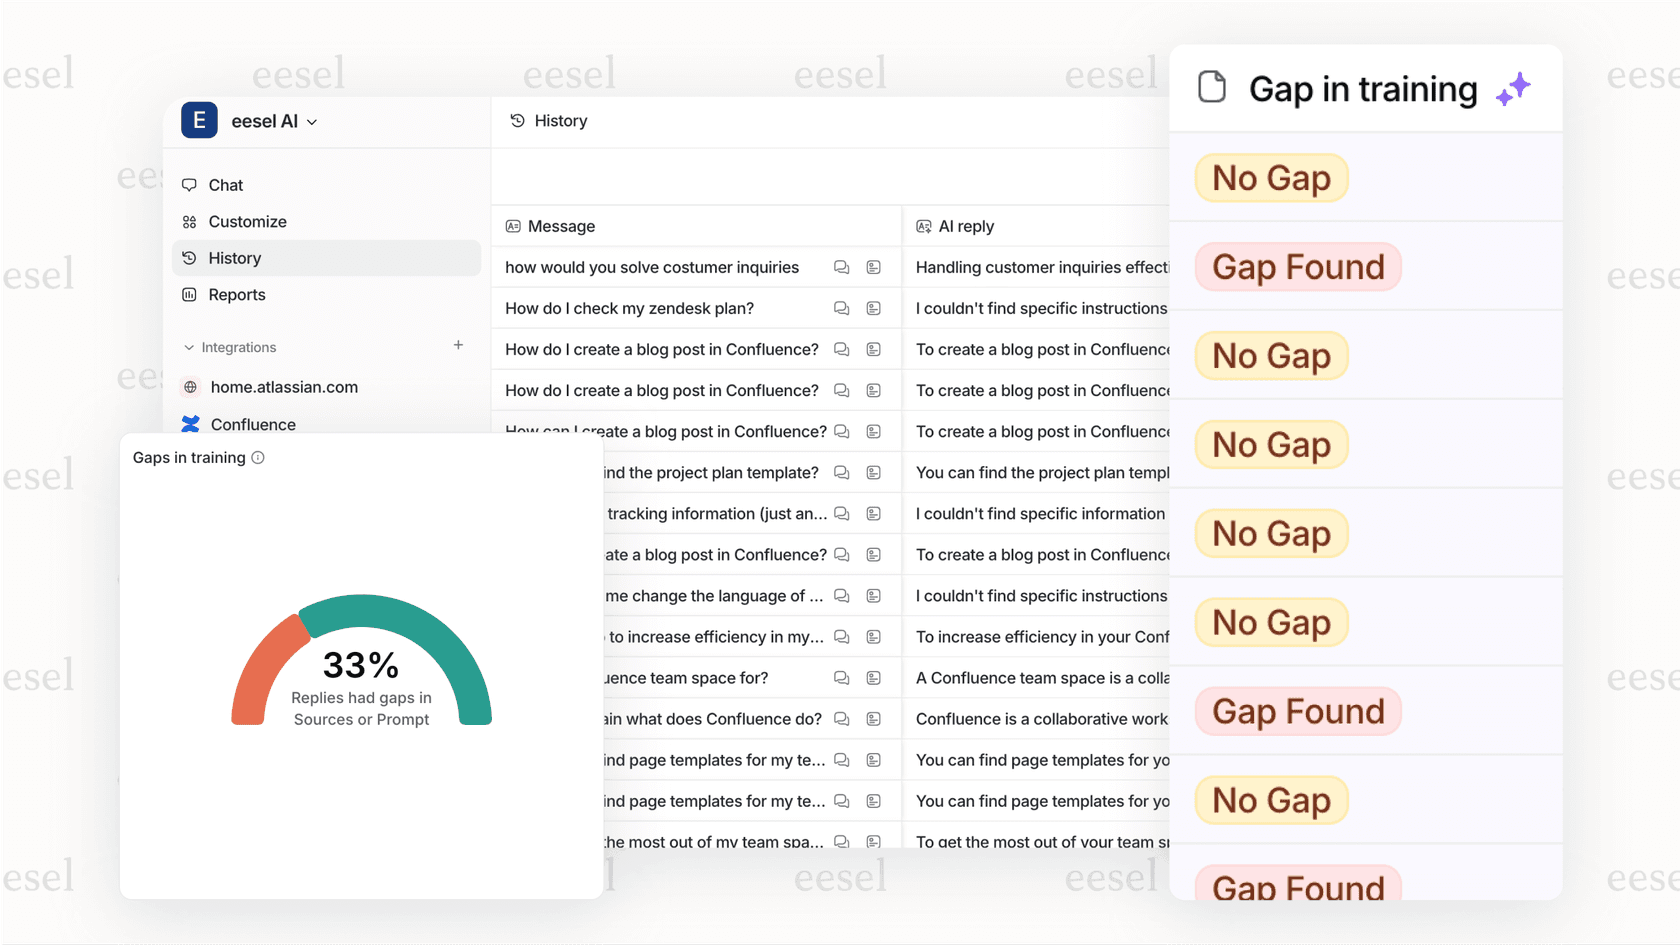
If you're finding the setup and configuration more complex than expected, tools like eesel AI offer an alternative approach. Instead of building reports manually, you can get automated insights from your call data without the learning curve.
Understanding call structure in the Talk dataset
Before you start building reports, you need to understand how calls are structured in the dataset. This is where many teams get tripped up.
Call legs explained
A "call leg" is an interaction between a person and the call. There are two types:
- Agent legs: Begin when an available agent is found and their phone or browser starts ringing. The leg ends when the agent completes the call (including any wrap-up time).
- End-user legs: Begin after the call is answered and the customer hears the welcome message. The leg ends when the call disconnects.
Here's why this matters: if a call gets transferred from Agent A to Agent B, that's two agent legs. If a customer requests a callback, that's two end-user legs. Mixing call-level metrics with leg-level metrics in the same report will multiply your numbers incorrectly.
The call flow
A typical inbound call flows through these stages:
- Customer connects to your system
- IVR (if configured): customer hears welcome message and makes selections
- Queue: customer waits for an available agent
- Agent connection: agent leg begins
- Call handling: talk time, hold time, consultations
- Wrap-up: agent completes after-call work
- Call ends
Understanding this flow helps you interpret your metrics correctly. For example, "call wait time" measures queue time after IVR, while "call answer time" includes everything from initial connection to first agent contact.
Key metrics and attributes in the Talk dataset
The Talk dataset contains dozens of metrics and attributes. Here are the ones you'll use most often:
Call-level metrics
| Metric | What it measures |
|---|---|
| Call wait time | Time customer waited in queue after IVR |
| Call answer time | Time from connection to first agent contact |
| Call IVR time | Time spent navigating IVR menu |
| Call consultation time | Total time agents spent consulting each other |
| Call on-hold time | Time customer was on hold |
| Call talk time | Total conversation time |
| IVR transitions | Number of IVR menu steps taken |
| Call billed time | Time billed for the call |
Call leg metrics
| Metric | What it measures |
|---|---|
| Agent talk time | Time agent spent talking |
| Agent wrap-up time | Time agent spent on after-call work |
| End-user wait time | Time customer spent waiting |
Key attributes
Attributes let you slice your data in different ways:
- Call direction: Inbound vs. outbound
- Call outcome: Completed, abandoned, voicemail, missed
- Agent name/ID: Which agent handled the call
- Phone number: Caller ID information
- Time attributes: Date, hour, day of week for trend analysis
The key thing to remember: metrics are quantitative (numbers you can count or sum), while attributes are qualitative (categories you can group by). You use metrics to measure performance and attributes to understand patterns.
Building your first Talk report
Let's walk through creating a simple report that shows daily call volume by agent. This is a foundational report most call centers need.
Step 1: Access Explore and select the Talk dataset
Navigate to Explore from your Zendesk admin panel. Click "New report" and you'll see a list of available datasets. Select "Talk - Calls" from the Voice section.

The dataset panel appears on the right showing which metrics are available. If you don't see Talk - Calls, verify your plan includes Talk Professional or Enterprise.
Step 2: Add your metrics
Click "Add" under the Metrics section. You'll see a list of all available metrics for the Talk dataset. For our daily volume report, select "Calls" (this counts the number of calls).
Notice the aggregation type shown next to each metric:
- COUNT: Counts all occurrences
- D_COUNT: Counts distinct occurrences (each call counted once)
- SUM: Adds up values
- AVG: Calculates average
For call counts, D_COUNT is usually what you want. It ensures each call is counted once, even if it has multiple legs.
Step 3: Add columns and rows
Now let's break down the data. Under Columns, add "Date (Ticket created)" to see calls by day. Under Rows, add "Agent name" to see which agent handled each call.
Your report now shows a matrix: dates across the top, agents down the side, and call counts in the cells. This answers the question: "How many calls did each agent handle each day?"
Step 4: Apply filters
Let's focus on inbound calls only. Click "Add" under Filters and select "Call direction." Set it to "Inbound" to exclude outbound calls from your report.
You can also add a date range filter. Click the calendar icon and select "Last 30 days" to keep the report current and manageable.
Step 5: Visualize your data
The default table view works for detailed analysis, but you might want a chart for presentations. Click the chart icon and select "Bar chart" to see call volumes visually.
Format your numbers for readability. Large numbers like 12584 are harder to read than 12,584. Click the gear icon next to your metric to adjust number formatting.
Finally, click "Save" and give your report a name like "Daily Inbound Calls by Agent." You can now add this to a dashboard or schedule it for email delivery.
Common Talk reports for call centers
Once you understand the basics, you can build more targeted reports. Here are four reports every call center should have:
Daily call volume
- Metric: Count of calls
- Column: Date
- Use case: Staffing planning and identifying peak periods
This report shows trends over time. Are Mondays your busiest day? Do calls spike after product launches? Use this data to schedule agents appropriately.
Agent performance
- Metrics: Call talk time, Call answer time
- Column: Agent name
- Use case: Performance reviews and coaching opportunities
Compare agents to identify training needs. An agent with unusually high talk times might need help with efficiency. An agent with low answer times might be rushing through calls.
Abandonment rate
- Metrics: Abandoned calls, Total calls
- Custom metric: % abandoned (Abandoned calls / Total calls)
- Use case: Queue optimization
High abandonment rates usually indicate long wait times. If you're seeing rates above 5-10%, consider adding more agents during peak periods or improving your IVR to better route calls.
Average handle time
- Metric: Call talk time + Call wrap-up time
- Column: Agent or date
- Use case: Efficiency tracking and capacity planning
Handle time affects how many calls an agent can take in a day. Track this over time to spot trends and set realistic targets.
Advanced: Custom metrics for Talk
Sometimes the built-in metrics don't give you exactly what you need. That's where custom metrics come in.
Custom metrics let you combine existing metrics, apply formulas, and create calculations specific to your business. Here are three useful ones for Talk:
One-touch resolution rate: Shows what percentage of Talk tickets were resolved without follow-up. Formula: Tickets solved in one touch / Total Talk tickets.
SLA compliance percentage: Tracks what percentage of calls were answered within your SLA target. Formula: Calls answered within SLA / Total calls with SLA applied.
Calls per agent per hour: Measures agent productivity. Formula: Total calls / (Total agent hours worked).
Building custom metrics requires understanding Zendesk's formula syntax. If you want pre-built formulas, the Geckoboard Zendesk custom metrics library has ready-to-use examples for common scenarios.
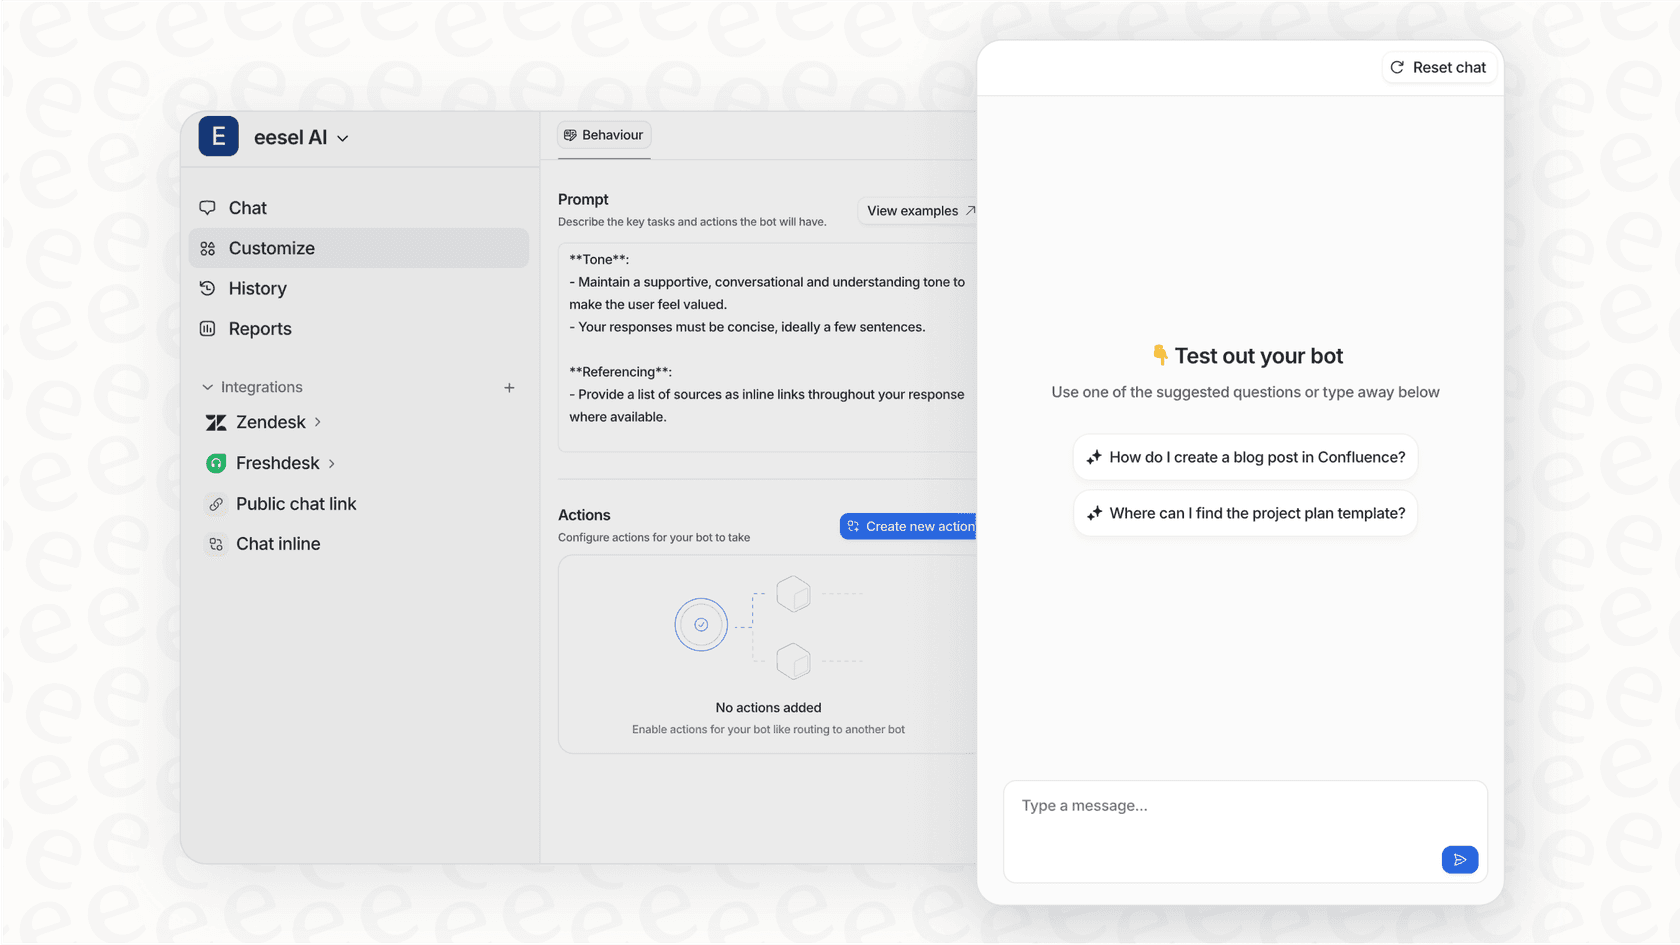
Alternatively, if building custom metrics feels like more work than it's worth, consider that we designed eesel AI to automatically surface these kinds of insights without any formula writing. Our AI analyzes your call patterns and highlights trends that matter for your business.
Troubleshooting common issues
Even experienced users run into issues with Talk reporting. Here are the most common problems and how to fix them:
Numbers don't match expectations: Check whether you're mixing call-level and leg-level metrics. Remember, adding a leg-level attribute multiplies your call-level numbers by the number of legs.
Missing data: Verify your plan level. Some metrics require Talk Professional or Enterprise. Also check that Talk is properly configured and calls are actually being recorded.
Reports timing out: Your date range might be too large, or your report might be too complex. Try reducing the date range or simplifying filters. You can also break complex reports into smaller ones.
Can't find a metric: Make sure you're using the Talk - Calls dataset, not Support - Tickets or another dataset. Metrics are specific to each dataset.
Getting more from your Talk data
Once you've mastered the basics, there are several ways to get more value from your Talk data:
Integrate with Support data: Link Talk calls to Support tickets to see the full customer journey. Which calls result in tickets? What's the resolution time for call-generated tickets?
Set up automated delivery: Schedule your key reports to email stakeholders automatically. Daily reports to supervisors, weekly summaries to managers, monthly trends to executives.
Use insights for workforce management: Combine Talk data with workforce management tools to optimize scheduling. Match agent capacity to predicted call volume.
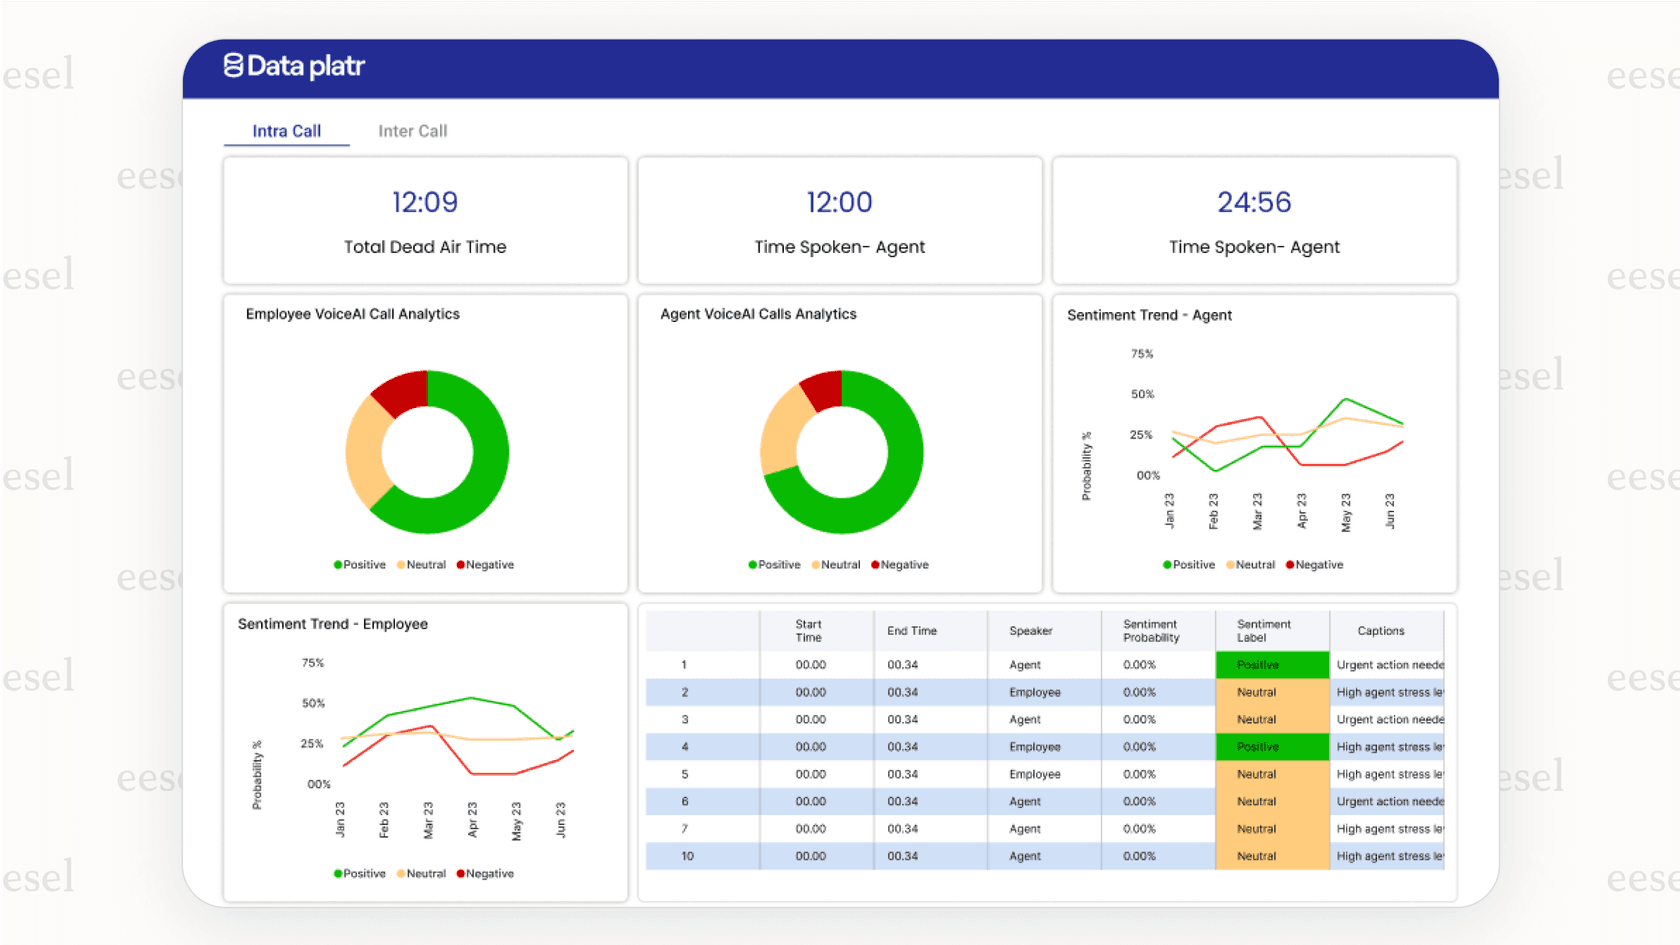
If you're spending more time building reports than acting on insights, it might be time to consider an alternative approach. At eesel AI, we help teams analyze call patterns and agent performance automatically. Instead of manually building reports, you get actionable insights delivered to you. Our AI identifies trends, highlights anomalies, and suggests improvements based on your actual call data.
Frequently Asked Questions
Share this article

Article by
Stevia Putri
Stevia Putri is a marketing generalist at eesel AI, where she helps turn powerful AI tools into stories that resonate. She’s driven by curiosity, clarity, and the human side of technology.