How to create a Zendesk Explore SLA compliance report
Stevia Putri
Last edited February 26, 2026
Service level agreements (SLAs) are the promises you make to your customers about response and resolution times. But making those promises is only half the battle. You need to track whether you're actually keeping them.
A Zendesk Explore SLA compliance report shows you exactly how your team is performing against your SLA targets, where you're excelling, and where tickets are slipping through the cracks. For support leaders, this data is essential for capacity planning, agent coaching, and executive reporting.
In this guide, I'll walk you through building a comprehensive SLA compliance report in Zendesk Explore. You'll learn how to select the right dataset, add the metrics that matter, and create a dashboard your team will actually use. I'll also cover how eesel AI can complement Explore with predictive insights and automated monitoring.
What you'll need
Before you start building your report, make sure you have the following:
- A Zendesk Suite plan: Professional, Enterprise, or Enterprise Plus
- Zendesk Explore access: Professional or Enterprise tier (Team plans have limited reporting capabilities)
- Editor or Admin permissions: Required to create and modify reports
- SLA policies configured: You need active SLA policies in Zendesk Support for meaningful data
- Historical ticket data: At least a few weeks of tickets with SLA targets applied
If you're on a Team plan, you can view prebuilt dashboards but cannot create custom reports. You'll need to upgrade to Professional or Enterprise to follow this guide. For more details on Zendesk's plan options, see the official Zendesk pricing page.
Step 1: Choose the right dataset
Every report in Zendesk Explore starts with selecting a dataset. This determines what data you can access and what questions you can answer. For SLA compliance reporting, you need the Support: SLAs dataset, not the standard Tickets dataset.
Here's why this matters. The Tickets dataset contains general ticket information like status, priority, and assignee. But SLA-specific metrics, breach data, and achievement percentages live in the SLAs dataset. If you try to build SLA reports from the Tickets dataset, you'll find yourself missing key metrics or calculating things manually. Learn more about the differences in Zendesk's dataset documentation.
To get started:
- Navigate to Zendesk Explore from your main dashboard
- Click New report from the Reports library
- On the "Select a Dataset" page, choose Support from the left menu
- Select Support: SLAs (not Support: Tickets)
- Click Start report to open the report builder
The SLAs dataset contains one row per SLA target instance. This is important. If a ticket has multiple SLA targets (First Reply Time, Next Reply Time, Resolution Time), each one appears as a separate row. This gives you granular visibility into exactly which targets are being met or missed. For a deeper understanding of SLA reporting concepts, check out Zendesk's SLA performance guide.
Step 2: Add core SLA metrics
With your dataset selected, it's time to add the metrics that will form the foundation of your compliance report. In the Metrics panel on the left, click Add to see all available options.
Start with these essential metrics:
- % Achieved SLA targets: The percentage of targets that were met
- % Breached SLA targets: The percentage of targets that were missed
- Number of SLA targets achieved: Raw count of met targets
- Number of SLA targets breached: Raw count of missed targets
Here's something that trips up a lot of people. There's a difference between "SLA tickets" and "SLA targets." If a ticket has three SLA targets and breaches one of them, the ticket is marked as breached. But the instance-based metrics above show you exactly which targets were missed. This matters when you're trying to improve. A ticket that breaches First Reply Time needs different attention than one that breaches Resolution Time.
Achievement percentages are calculated per instance. If you have 100 SLA target instances and 85 were achieved, your % Achieved is 85%. This is more accurate than ticket-based percentages because it accounts for the fact that some tickets have multiple targets.
For time-based metrics like resolution time, Zendesk defaults to the MEDIAN aggregator. This is usually the right choice. One ticket that took 30 days to resolve won't skew your entire report the way it would with an average.
Step 3: Slice data with attributes
Raw numbers only tell part of the story. To make your report useful, you need to break down the data by dimensions that matter to your operation. Attributes let you slice and dice your metrics.
Add these attributes to your report:
SLA Metric: This breaks down your data by target type (First Reply Time, Next Reply Time, Resolution Time). You'll quickly see if your team is great at initial responses but struggling with follow-ups.
Priority: See compliance rates by ticket urgency. It's normal to have lower achievement on urgent tickets, but you want to know exactly how much lower.
Group or Assignee: For team-level insights. This helps identify which groups need support and which are performing well.
Ticket created - Date: Add this to the Columns panel and group by week or month. Trends over time reveal whether your improvements are working or if new issues are emerging.
Configure filters to focus on relevant data. Add a date range filter to exclude old tickets that might not reflect your current performance. You can also filter by specific groups or brands if you manage multiple support operations.
Step 4: Create custom calculated metrics
Standard metrics cover the basics, but most teams need custom calculations for advanced SLA reporting. Zendesk Explore lets you create standard calculated metrics using formulas.
Here are two common custom metrics that add significant value:
Tickets approaching SLA breach
This metric counts tickets that are within a certain percentage of their SLA target. It helps you catch problems before they become breaches.
Formula approach: Create a standard calculated metric that checks if remaining SLA time is less than a threshold (for example, 25% of target time remaining). This requires working with the SLA metric target time and completion time fields.
SLA achievement by business hours
Calendar hours can be misleading if your team only works business hours. A ticket created Friday evening and solved Monday morning shows 72 hours in calendar time, but only a few hours of actual work time.
Use the business hours variants of time metrics for more accurate SLA reporting. Make sure you've configured business hours in Admin Center under Objects and rules > Business rules > Business hours. See Zendesk's business hours documentation for detailed setup instructions.
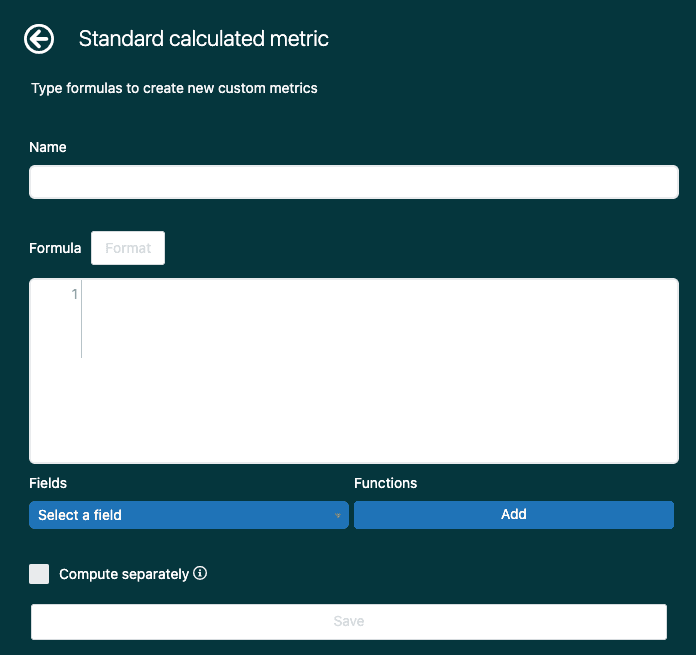
To create a custom metric:
- Open the Calculations menu in the report builder
- Click Standard calculated metric
- Name your metric clearly
- Enter your formula using existing metrics as building blocks
- Save and add it to your report
Once created, custom metrics can be reused across multiple reports. This saves time and ensures consistency in how you measure performance. Learn more about creating calculated metrics in Zendesk Explore.
Step 5: Build your SLA compliance dashboard
Individual reports are useful, but dashboards give you the big picture. A well-designed dashboard combines multiple reports into a single view that tells a complete story.
To build your dashboard:
- Save your SLA reports with clear, descriptive names
- Navigate to the Dashboard library and click New dashboard
- Add your saved reports as widgets
- Arrange widgets logically: put your most important metric (usually % Achieved) at the top
- Add global filters that apply to all widgets, like date ranges
A good SLA compliance dashboard typically includes:
- Overall achievement rate (the headline number)
- Breaches by priority (shows where the problems are)
- Trend over time (are we getting better or worse?)
- Achievement by group or assignee (for accountability)
Keep your layout clean. White space helps viewers focus. Group related metrics together and use consistent colors.
Once your dashboard is ready, share it with stakeholders. You can set permissions for each user: Admin (full control), Editor (can modify), or Viewer (can only view). On Professional and Enterprise plans, you can also set up scheduled email deliveries so stakeholders get updates automatically.

One important note: Zendesk is migrating to a new dashboard builder. Legacy dashboards become view-only on December 31, 2026. If you're building new dashboards now, use the new builder to avoid rework later.
Common issues and troubleshooting
Even with clear documentation, you'll likely run into a few issues. Here are the most common problems and how to fix them.
NULL values in resolution time metrics
This happens when tickets haven't been resolved yet. Only solved and closed tickets have resolution times. To exclude unresolved tickets, add a filter for Ticket status and select only "Solved" and "Closed."
Data doesn't match expectations
Explore data syncs on a schedule, not in real time. It can take 1-4 hours for recent ticket updates to appear. If you just solved a ticket and don't see it reflected, wait for the next sync cycle.
Extremely long resolution times skewing averages
One ticket that took 90 days will pull your average up significantly. Use the MEDIAN aggregator instead of AVG, or add a filter to exclude outliers above a certain threshold.
Tickets showing wrong SLA status after schedule changes
If you change business hours or schedules, tickets active before the change may show split data. Zendesk has a recipe for creating alternate SLA metrics that use durations instead of status for more accurate reporting in these edge cases.
Business hours vs. calendar hours confusion
Always verify which variant you're using. Calendar hours count nights and weekends. Business hours only count time within your configured schedule. For SLA compliance, business hours usually give you a more accurate picture of team performance.
Going beyond Explore: AI-powered SLA insights
Explore excels at showing you what happened. It tells you how many tickets breached SLAs, what your achievement rates were, and how performance has trended over time. But it doesn't tell you what will happen or what you should do about it.
This is where AI-powered tools can fill the gap. While Explore shows historical trends, AI analytics can predict ticket volume spikes before they happen, identify knowledge gaps that are driving repeat contacts, and surface automation opportunities you might have missed.

We built eesel AI to complement platforms like Zendesk with forward-looking insights. Our AI teammate analyzes your past tickets, help center articles, and macros to identify patterns Explore might miss. You can run simulations on historical data to see how changes would have performed, or get proactive alerts before SLA breaches occur.
The two approaches work best together. Use Explore for your regular reporting and operational dashboards. Use AI analytics when you need to understand why trends are happening or what to do about them. If you're looking to reduce SLA breaches without adding headcount, our AI agent can handle routine queries automatically, freeing your team to focus on complex issues that actually need human attention.
Start building your Zendesk Explore SLA compliance report today
You now have everything you need to build a comprehensive SLA compliance report in Zendesk Explore. Start with the SLAs dataset, add your core metrics, slice the data with meaningful attributes, and build a dashboard your team will actually use.
Don't try to build everything at once. Start with a basic report showing % Achieved SLA targets by week. Once that's working, add dimensions like priority and group. Then layer in custom metrics for more advanced analysis.
Remember that reports are only useful if you act on them. Set targets, review regularly, and use the insights to drive process improvements. If you're ready to go beyond historical reporting and get predictive insights that help prevent SLA breaches before they happen, explore how eesel AI can enhance your Zendesk reporting or see how eesel AI handles customer support automation.
