Blog
Tips, guides, and insights on AI teammates, smarter support, and building better teams.
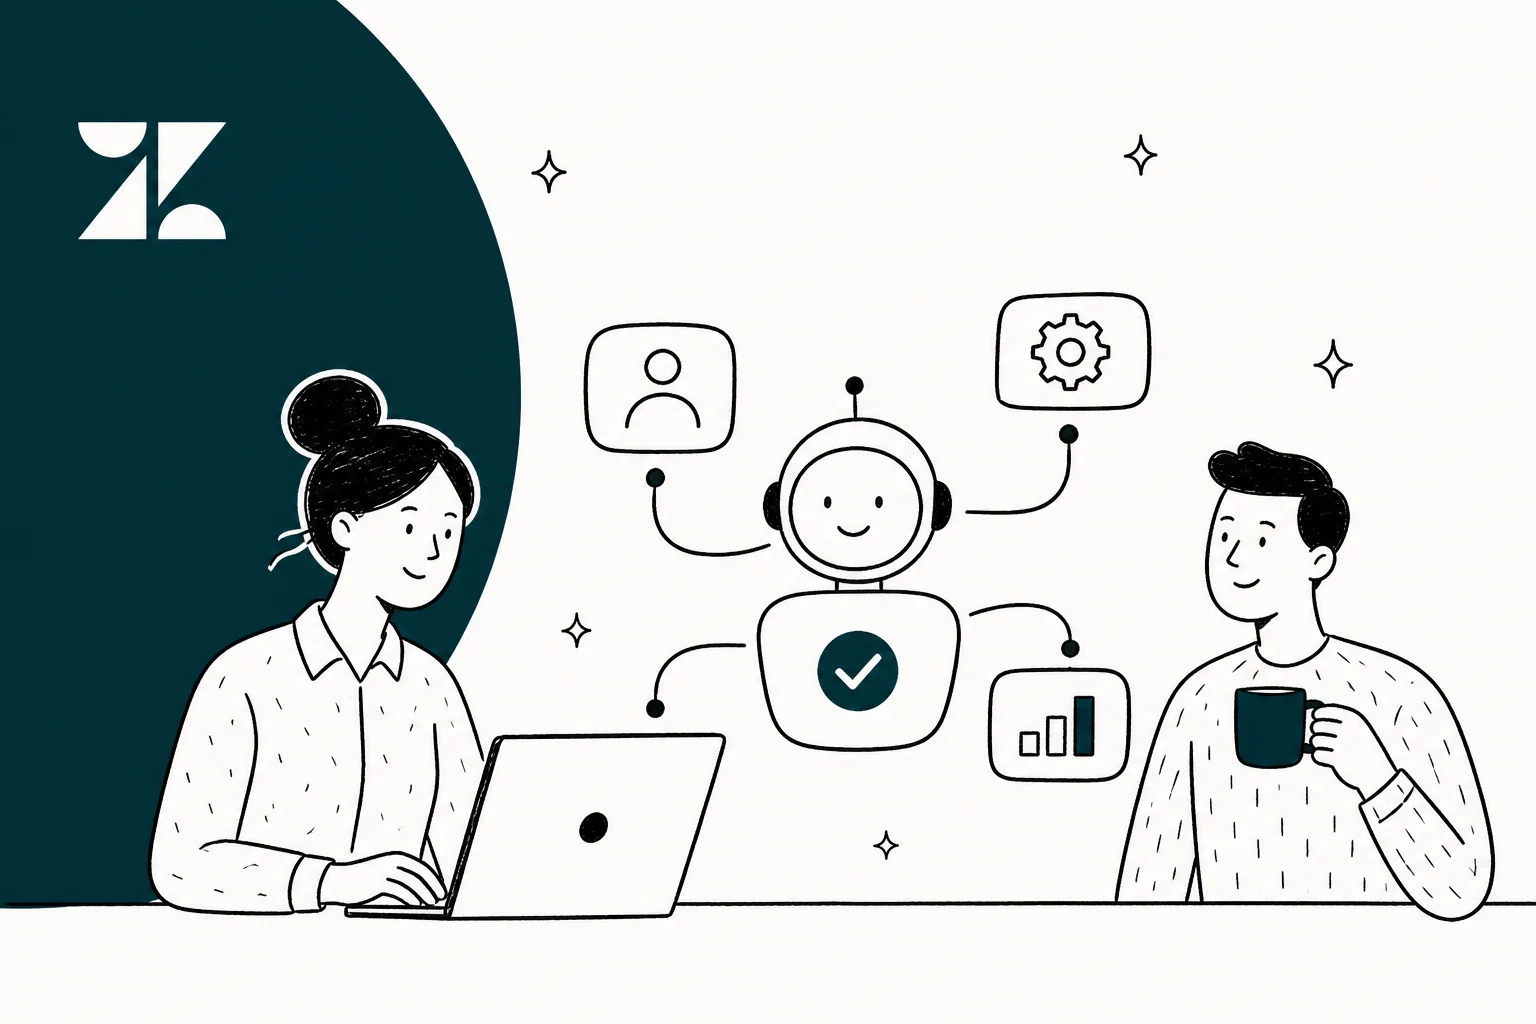

I tested 10+ AI personal assistants and ranked them (2026)
AI personal assistants in 2026 do far more than set reminders, they automate tasks, handle support, and keep your day on track. Here's my ranked list.

The 8 best AI tools for social media customer support in 2026
I tested the best AI for social media support across Instagram, Facebook, X, WhatsApp and TikTok DMs. Here's what actually resolves tickets versus what just suggests replies.

The best AI for subscription businesses in 2026
I tested 8 AI support tools against the tickets that actually flood a subscription business: failed payments, pause-and-cancel flows, and renewals. Here's what fits.

7 free AI chatbot tools worth trying in 2026
The best free AI chatbots for personal use in 2026 — what each one actually does well, and the exact point they hit a wall when you put them in front of customers.
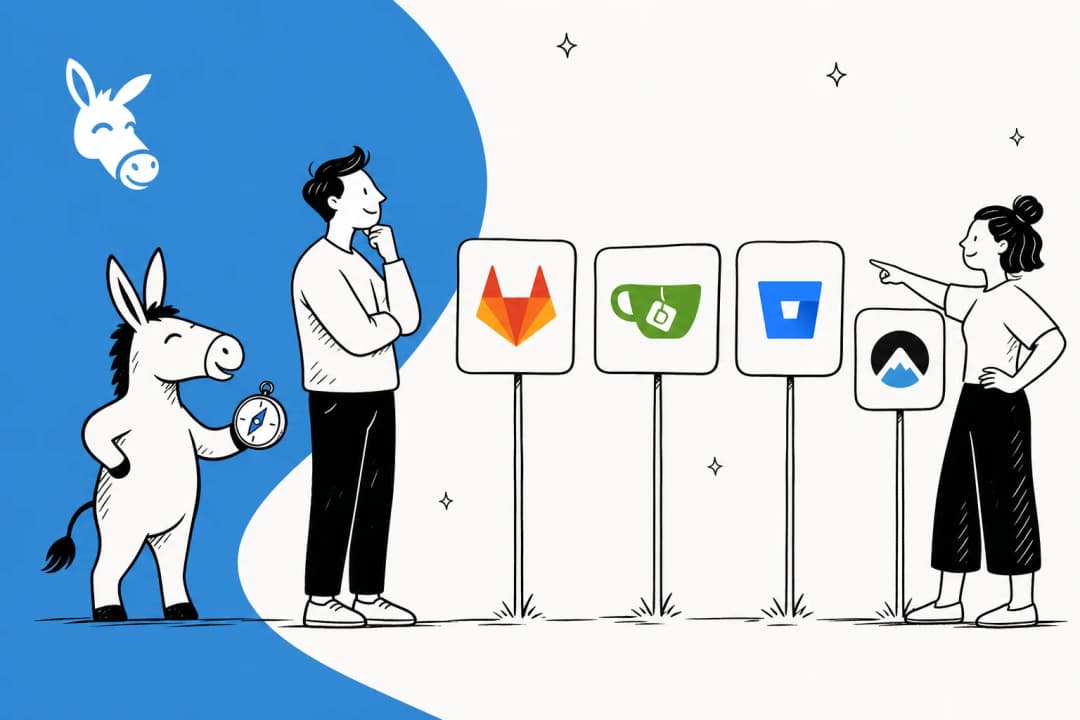
10 GitHub alternatives we actually tested and ranked (2026)
Tired of GitHub? Explore my detailed breakdown of the 7 best GitHub alternatives for 2026. I compare top contenders like GitLab, Gitea, and Codeberg to help you choose the right platform for your projects, whether you need self-hosting, open-source, or enterprise-grade features.

The 8 best AI tools for travel customer support in 2026
I compared the best AI for travel support across airlines, hotels, OTAs and tour operators, with real pricing, voice support and a who-it-fits breakdown.

The best AI for SMS support in 2026
I compared the best AI for SMS support in 2026 across 8 tools, with real pricing, the hidden carrier-fee cost, and who each one is actually for.

A deep dive Wispr Flow review: Is it safe to use in 2026?
Is Wispr Flow the productivity game-changer it claims to be, or are the privacy risks too high? This hands-on review breaks down its features, the new 2026 pricing, and the user-reported issues you need to know before installing.

The 7 best Replika AI alternatives in 2026 (for personal & business use)
Unhappy with Replika? Explore our curated list of the best Replika AI alternatives in 2026. Find the perfect AI companion or a powerful business chatbot.
Ready to hire your AI teammate?
Set up in minutes. No credit card required.