How to track agent replies in Zendesk Explore: A complete guide
Stevia Putri
Last edited February 26, 2026
Tracking how many times your agents respond to tickets is useful for quality assurance, escalation workflows, and understanding ticket complexity. But Zendesk's terminology can be confusing. Agent replies, agent comments, and ticket touches sound similar but measure different things.
This guide walks you through exactly how to track agent replies in Zendesk Explore. We'll clarify what each metric means, show you how to build the reports you need, and explain when to use which dataset.
If you're looking for ways to automate actions based on reply counts, we also cover how eesel AI integrates with Zendesk to handle reply-based workflows.
What you'll need
Before you start building reports, make sure you have:
- Zendesk Explore Professional or Enterprise the reporting features aren't available on lower tiers
- Editor or Admin permissions in Zendesk Explore
- Ticket data in Zendesk Support you'll need existing tickets to analyze
- Familiarity with Zendesk datasets understanding the difference between Tickets and Updates history helps
Understanding agent reply metrics
Let's clear up the confusion around Zendesk's terminology. Three metrics sound similar but measure different things.
Agent replies vs agent comments vs ticket touches
| Metric | What it counts | Dataset | Best for |
|---|---|---|---|
| Agent replies | Public replies added by agents | Tickets | Measuring back-and-forth conversation volume |
| Agent comments | Public comments made by agents | Updates history | Tracking when replies occurred |
| Agent touches/updates | Any ticket update by an agent (comments, field changes, status changes) | Updates history | Measuring total agent activity |
Agent replies is the metric most support teams want. It counts only public replies to customer messages, not internal notes or the initial ticket creation. The formula is simple: (Agent replies).
Agent comments lives in the Updates history dataset and counts public comments. Use this when you need to filter by when the reply happened.
Agent touches is the broadest metric. It includes any operation an agent performs: adding comments, changing fields, updating status, reassigning tickets. This is useful for measuring overall agent workload but not for analyzing conversation patterns.
Source: Zendesk Help - Metrics and attributes for Zendesk Support
One-touch, two-touch, and multi-touch tickets
Zendesk Explore categorizes tickets by how many agent replies they required:
- One-touch tickets: Solved with only one agent reply
- Two-touch tickets: Solved with two agent replies
- Multi-touch tickets: Solved with more than two agent replies
These metrics matter because they indicate ticket complexity and agent efficiency. A high percentage of one-touch tickets usually means your self-service and agent training are working well. Lots of multi-touch tickets might signal complex issues, unclear documentation, or customers needing more hand-holding.
Note that if a ticket is reopened and an agent adds another comment, the touch count increases. A one-touch ticket becomes a two-touch ticket.
Source: Zendesk Help - Analyzing agent ticket touches with Explore
Step 1: Choose the right dataset
Zendesk Explore has multiple datasets, and choosing the wrong one is a common mistake. Here's how to decide:
Use the Tickets dataset when you want:
- Ticket-level metrics like total agent replies
- Reply brackets (one-touch, two-touch, multi-touch)
- Analysis by ticket status, priority, or assignee
Use the Updates history dataset when you want:
- To filter by when replies occurred
- Time-based analysis of agent activity
- To distinguish between public comments and internal notes
The Updates history dataset contains more granular data, which means reports can take longer to run. If you're analyzing thousands of tickets, add date filters to keep performance reasonable.

Step 2: Create a basic agent replies report
Let's build a simple report showing agent replies per ticket.
- In Zendesk Explore, click the Reports icon
- Click New report
- Select Support > Tickets dataset, then click Start report
- In the Metrics panel, click Add
- Choose Agent replies from the list, then click Apply
- In the Rows panel, click Add
- Add Ticket ID and Ticket subject to identify each ticket
- Add Assignee name to see who handled the ticket
- Click Add in the Filters panel
- Add Ticket status and exclude Closed tickets if you want to focus on active work
The report now shows each ticket with its agent reply count. You can sort by the Agent replies column to find tickets with the most back-and-forth.
Step 3: Build an average replies per ticket report
Now let's create a calculated metric to see average replies per agent per day. This helps you compare efficiency across your team.
- Create a new report using the Support > Updates history dataset
- Click Calculations > Standard calculated metric
- Name it "Average agent replies per ticket per day"
- Enter this formula:
D_COUNT(Agent comments)/D_COUNT(Tickets updated)
- Click Save
- In the Metrics panel, add your new calculated metric
- Set the aggregator to AVG
- In the Rows panel, add Updater name and Update - Date
- Add filters for Comment type = Public and Updater role = Admin, Agent
This report shows each agent's average replies per ticket, broken down by day. Use it to identify trends, spot training opportunities, and recognize your most efficient agents.
Source: Zendesk Help - Average replies per ticket for each agent per day

Step 4: Analyze reply brackets
Understanding reply distribution helps you identify process improvements. Let's build a report grouping tickets by reply count.
Using the Tickets dataset:
- Create a new report
- Add the One-touch tickets, Two-touch tickets, and Multi-touch tickets metrics
- Add Ticket solved - Month to the Rows panel to see trends over time
- Consider adding Ticket group or Assignee to compare across teams
Alternatively, using the Updates history dataset for more flexibility:
- Create calculated metrics for "Public Agent Replies" and "Tickets with Public Agent Replies"
- Create a calculated attribute called "Public Agent Reply Brackets"
- Use this formula:
IF (ATTRIBUTE_FIX(COUNT(Public Agent Replies), [Ticket ID])=1)
THEN "1 Agent Reply"
ELIF (ATTRIBUTE_FIX(COUNT(Public Agent Replies), [Ticket ID])=2)
THEN "2 Agent Replies"
ELIF (ATTRIBUTE_FIX(COUNT(Public Agent Replies), [Ticket ID])=3)
THEN "3 Agent Replies"
ELIF (ATTRIBUTE_FIX(COUNT(Public Agent Replies), [Ticket ID])>3)
THEN "4+ Agent Replies"
ELSE "0"
ENDIF
- Set Computed from to Ticket ID
- Add your calculated attribute to the Rows panel
- Add the "Tickets with Public Agent Replies" metric
This gives you a clear breakdown of how many tickets fall into each reply bracket.
Source: Zendesk Help - Reporting on agent reply brackets
Common use cases for agent reply tracking
Here are practical ways support teams use these metrics:
Quality assurance: Identify tickets with excessive back-and-forth. If a ticket has 5+ agent replies, it might indicate a complex issue, a confused customer, or an agent needing help. These tickets are good candidates for QA review.
Escalation workflows: Use reply counts to trigger automatic escalations. For example, you might want tickets with more than 3 agent replies to notify a senior agent or manager.
Agent performance: Compare average replies per ticket across your team. Lower isn't always better (some tickets need thorough explanations), but outliers on either end deserve attention.
Ticket complexity analysis: Track which types of issues require more interaction. If billing questions average 4+ replies while password resets average 1, you know where to focus your self-service improvements.
Tips and best practices
-
Add date filters early. The Updates history dataset can be massive. Filter by date before adding other attributes to keep reports responsive.
-
Consider ticket channel. Voice tickets (phone calls) work differently than email. A "one-touch" voice ticket might have zero agent replies because the call itself resolved the issue.
-
Account for ticket reopening. When a solved ticket reopens, reply counts continue accumulating. A ticket might show 5 total replies even though 3 happened before the first resolution.
-
Watch your one-touch rate. Industry benchmarks vary, but many support teams aim for 60-70% one-touch resolution. Lower rates aren't necessarily bad (complex products need more interaction), but track the trend over time.
-
Don't use reply counts alone. A ticket with one reply might be excellent (perfect answer) or terrible (rude brush-off). Combine quantitative metrics with qualitative QA.
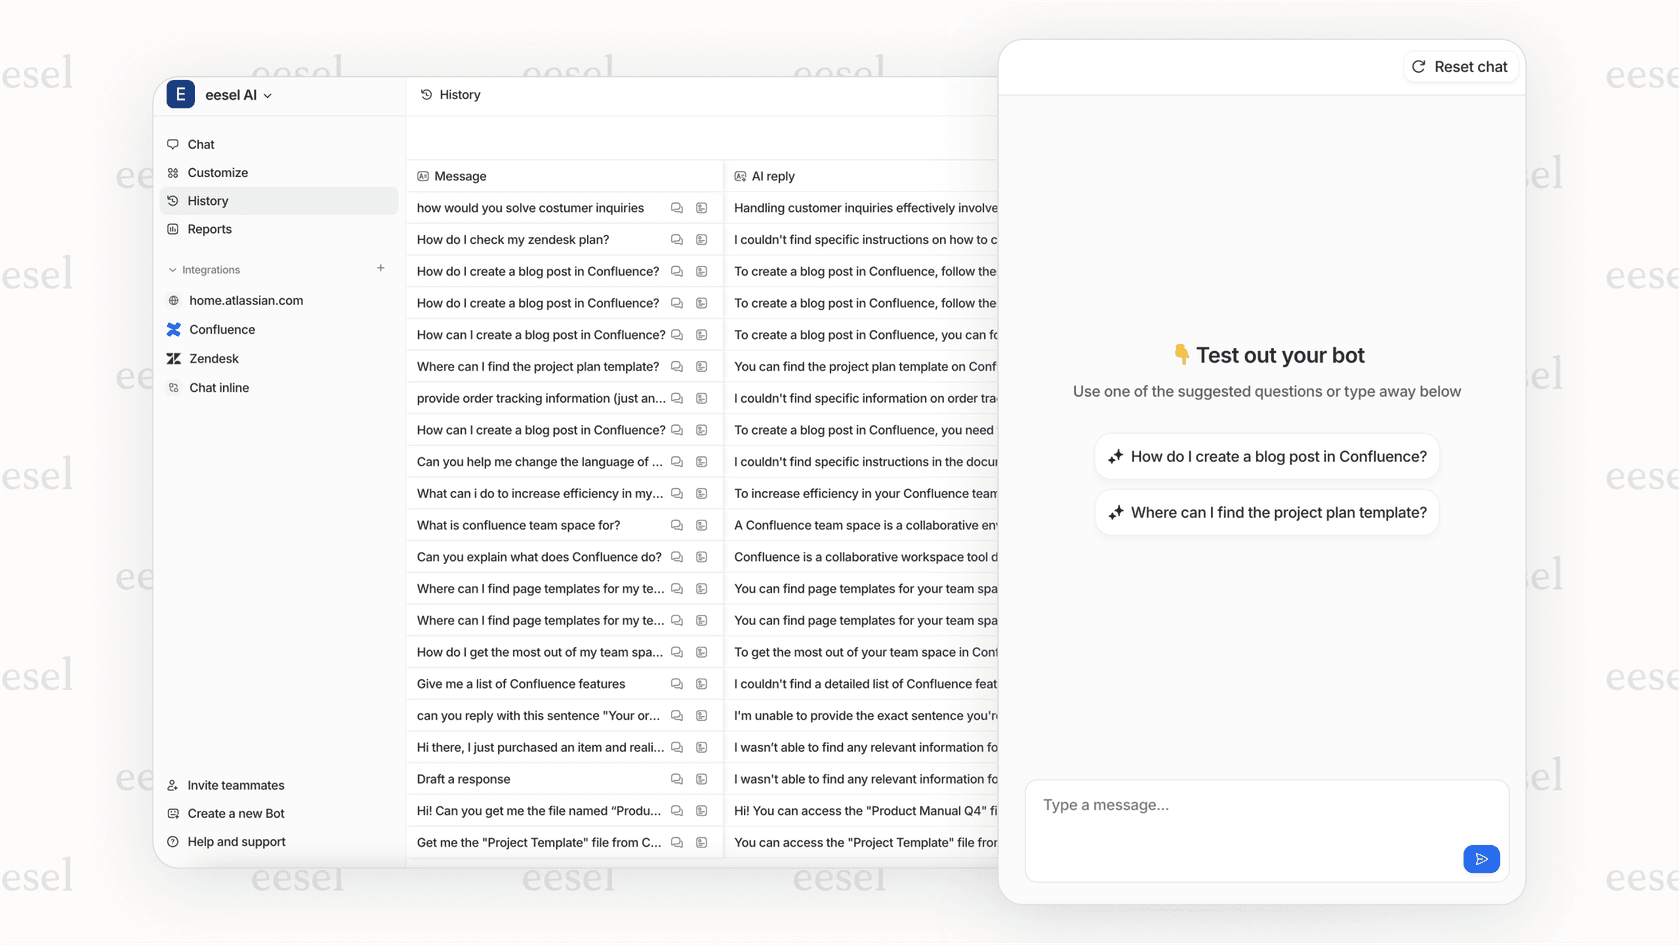
Taking agent analytics further with eesel AI
Zendesk Explore gives you the data, but acting on it often requires manual work. That's where AI teammates can help.
eesel AI integrates directly with Zendesk to automate reply-based workflows. If you want to see how an AI agent for Zendesk can act on the patterns Explore surfaces, eesel is worth a look. Instead of just reporting on reply counts, you can:
- Automatically escalate tickets after a certain number of replies
- Analyze conversation quality using AI to understand sentiment and resolution likelihood
- Categorize tickets based on conversation patterns without manual tagging
- Get proactive alerts when tickets are at risk of becoming high-touch
The difference is that Explore shows you what happened, while eesel AI helps you act on it automatically. You define the rules in plain English ("If a ticket has more than 3 agent replies and the customer sentiment is negative, escalate to a senior agent"), and eesel handles the rest.
If you're spending hours each week reviewing reports and manually escalating tickets, an AI teammate might be worth considering.