Time to resolution is one of the most important metrics in customer support. It tells you how long customers wait from the moment they reach out until their issue is fully solved. Get it right and you have a clear picture of team performance. Get it wrong and you might be making decisions based on incomplete data.
If you are using Zendesk, you have powerful tools for tracking resolution time built into Zendesk Explore. The challenge is knowing which metrics to use, how to configure them, and what the numbers actually mean for your business.
This guide walks you through everything you need to know about tracking time to resolution in Zendesk Explore. We will cover the different types of resolution metrics, how to build reports that give you actionable insights, and common pitfalls to avoid.
What is time to resolution in Zendesk?
Time to resolution measures the total duration from when a ticket is created until it is marked as solved. In Zendesk, this seems simple at first. A customer emails you on Monday morning, your team solves the ticket by Tuesday afternoon, and the resolution time is roughly 30 hours.
But here is where it gets complicated. Zendesk calculates resolution time in multiple ways depending on what you need to measure:
Calendar hours count every hour that passes, including nights and weekends. If a ticket is created Friday at 5 PM and solved Monday at 9 AM, that is 64 hours in calendar time.
Business hours only count the hours your team is actually working. Using the same example with a standard 9-to-5 business schedule, that Friday evening to Monday morning ticket might only be 8 hours of business time.
Which one should you use? Business hours give you a clearer picture of your team's actual performance because they measure the time agents are actively working. Calendar hours matter more for customer experience because customers experience the full wait regardless of whether your team is online.
Most support teams track both. Business hours for internal performance reviews and calendar hours for SLA commitments to customers.
First resolution time vs full resolution time: What's the difference?
Here is where a lot of teams get tripped up. Zendesk offers two different resolution time metrics, and they tell very different stories.
First resolution time measures how long it takes from ticket creation to the first time the ticket is marked solved. This sounds like what you want, but it has a major blind spot: reopened tickets.
When a ticket is solved and then reopened because the customer replies saying the issue is not actually fixed, first resolution time stops counting. It only cares about that initial solve. A ticket could be reopened three times over two weeks, but first resolution time only sees the initial 4-hour solve.
Full resolution time (sometimes called latest resolution time) measures from ticket creation to the final resolution. It accounts for reopened tickets and gives you the true duration the customer spent waiting for a complete fix.
Which one should you use for SLA reporting? Full resolution time is almost always the better choice. Your customers do not care that you technically solved their ticket once before it broke again. They care about how long it took to get a permanent solution.
First resolution time still has value. It helps you identify tickets that are being prematurely closed or agents who might be rushing through tickets without fully resolving issues. A large gap between first and full resolution time is a red flag worth investigating.
How to create a full resolution time report in Zendesk Explore
Building a resolution time report in Zendesk Explore takes about five minutes once you know the steps. Here is how to do it.
What you will need
Before you start, make sure you have:
- Zendesk Explore Professional or Enterprise (custom reports are not available on lower tiers)
- Editor or Admin permissions in Explore
- At least some ticket data in your Zendesk account (the report needs something to analyze)
Step 1: Create a new report
Open Zendesk Explore and click the reports icon. Click New report to start building from scratch.
On the Select a Dataset page, choose Support then Support - Tickets. This dataset contains all your ticket information including creation times, solve times, and resolution metrics. Click Start report to open the report builder.

Step 2: Add the full resolution time metric
In the Metrics panel on the left, click Add. This opens the list of available metrics you can report on.
Navigate to Duration between events - Calendar hours (hrs) and select Full resolution time (hrs). If you want business hours instead, look for the same metric under Duration between events - Business hours (hrs).
Click Apply and Explore will calculate the median full resolution time across all your tickets. By default, Explore uses median rather than average because median is less affected by outliers. One ticket that took 30 days to resolve will not skew your entire report.

Step 3: Add attributes to slice the data
A single number for all tickets is not very useful. You need to break it down to see where problems might be hiding.
Click Add in the Columns or Rows panel and select Ticket created - Date to see resolution times by day, week, or month. This helps you spot trends over time.
Other useful attributes to add:
- Assignee name to see which agents have longer resolution times
- Ticket priority to check if urgent tickets are actually being resolved faster
- Ticket group to compare performance across teams
- Ticket type to see if problems take longer than questions
Each attribute you add gives you another angle to analyze your data.
Step 4: Customize with filters and visualization
Raw numbers can be overwhelming. Let us make this report more digestible.
To add a date filter, click Add in the Filters panel and select Ticket created - Date. This lets you focus on specific time periods like last month or the current quarter.
To change the visualization, click the visualization type menu (the chart icon) and select Line. Line charts are great for showing trends over time. If you are comparing categories like agents or groups, a bar chart usually works better.
Save your report by clicking the save icon and giving it a descriptive name like "Full Resolution Time by Month" so you can easily find it later.
Understanding SLA metrics categories in Zendesk
Resolution time does not exist in isolation. Zendesk organizes SLA metrics into three categories, and understanding how they work together helps you build a complete picture of your support performance.
Reply metrics measure how quickly customers hear back from you. First reply time tracks the wait from ticket creation to your first response. Next reply time measures the gap between customer replies and your follow-up responses.
These matter because they directly impact customer satisfaction. A ticket that takes three days to resolve feels very different if the customer got updates every few hours versus complete silence until the final solution.
Update metrics keep tickets moving forward during longer investigations. Periodic updates require agents to add comments at set intervals so customers know work is happening. Pausable updates stop counting when a ticket is in pending status, recognizing that you are waiting for the customer, not the other way around.
These are especially useful for complex technical issues that take days or weeks to resolve. They prevent tickets from going silent and customers from feeling forgotten.
Resolution metrics measure the total lifecycle of a ticket. Total resolution time is the full duration from creation to solve. Requester wait time subtracts time spent in pending status to show only the time customers were actively waiting. Agent work time focuses only on time in new and open status, excluding time waiting for third parties or customer responses.

The best SLA policies usually include at least one metric from each category. Reply metrics for responsiveness, update metrics for communication during long tickets, and resolution metrics for overall efficiency.
Creating custom SLA metrics for advanced reporting
Sometimes the built-in metrics are not enough. Maybe you need to track what percentage of tickets are resolved within 4 hours, or how many tickets breached your SLA target.
This is where custom calculated metrics come in. They let you combine existing metrics and attributes to answer specific questions about your operation.
A common example is creating a metric for tickets solved within your SLA target. You would build a standard calculated metric that counts tickets where full resolution time is less than your target threshold.
Another useful metric is SLA breach percentage. This divides the number of breached tickets by total tickets to give you a clear percentage of how often you are missing targets.
Custom metrics are powerful, but they come with a learning curve. You need to understand Zendesk's formula syntax and how different metrics interact. If you find yourself struggling, Geckoboard maintains a library of pre-built custom metrics for common use cases.
Here is the thing about custom metrics: they add complexity. Every custom formula is another piece of logic that can break or produce unexpected results when Zendesk updates its platform. Before building a custom metric, ask whether the insight you need is worth the ongoing maintenance.
Sometimes the better approach is simplifying your process rather than building increasingly complex reporting to track it.
Common challenges and how to solve them
Even with the right metrics configured, you will run into edge cases and data quality issues. Here are the most common problems and how to handle them.
Tickets saved in the wrong SLA status happens when schedule changes or edge cases cause Zendesk to record inaccurate SLA data. The ticket might show as breached when it actually met the target, or vice versa. Zendesk's documentation includes a recipe for creating alternate SLA metrics that calculate achievement based on duration rather than stored status. These can give you more accurate reporting when the native metrics are unreliable.
Group SLAs for internal handoffs solve a specific problem. When tickets move between teams, like from support to engineering or from finance to billing, standard SLAs stop making sense. The second group should not be penalized for time the ticket spent waiting in the first group. Group SLAs measure ownership time per specific group, starting when the ticket is assigned to them and stopping when it leaves. This lets you set internal SLAs between teams without unfairly attributing delays.
AI agent replies and SLA impact is an increasingly common question. If you are using AI tools to handle initial responses, how do they affect your metrics? According to Zendesk documentation, AI agent replies for messaging do not count as agent replies for first reply time metrics. However, AI agents for email do count. This creates confusing situations where your FRT looks better than it actually is because AI responses are masking the true wait time for human help.
If you are using AI tools alongside Zendesk, you might want to track next reply time in addition to first reply time. This measures the time between customer messages and subsequent agent responses, giving you a clearer picture of human performance.
Simplifying resolution time tracking with eesel AI
Building custom reports in Zendesk Explore works well enough if you have the time and expertise to maintain them. Most support teams have more pressing priorities than becoming Zendesk reporting experts.
This is where we can help. At eesel AI, we have built an AI teammate that plugs directly into Zendesk and handles much of this complexity automatically.

Instead of manually configuring reports, our AI learns from your past tickets, help center, and macros to understand what good resolution looks like for your specific business. It tracks resolution metrics in real time without requiring you to build custom dashboards.
Here is what makes this approach different. Traditional reporting shows you what happened after the fact. Our AI agent works in the moment to actually improve your resolution times. It can handle frontline support tickets autonomously, draft replies for agents to review, and route complex issues to the right team immediately.
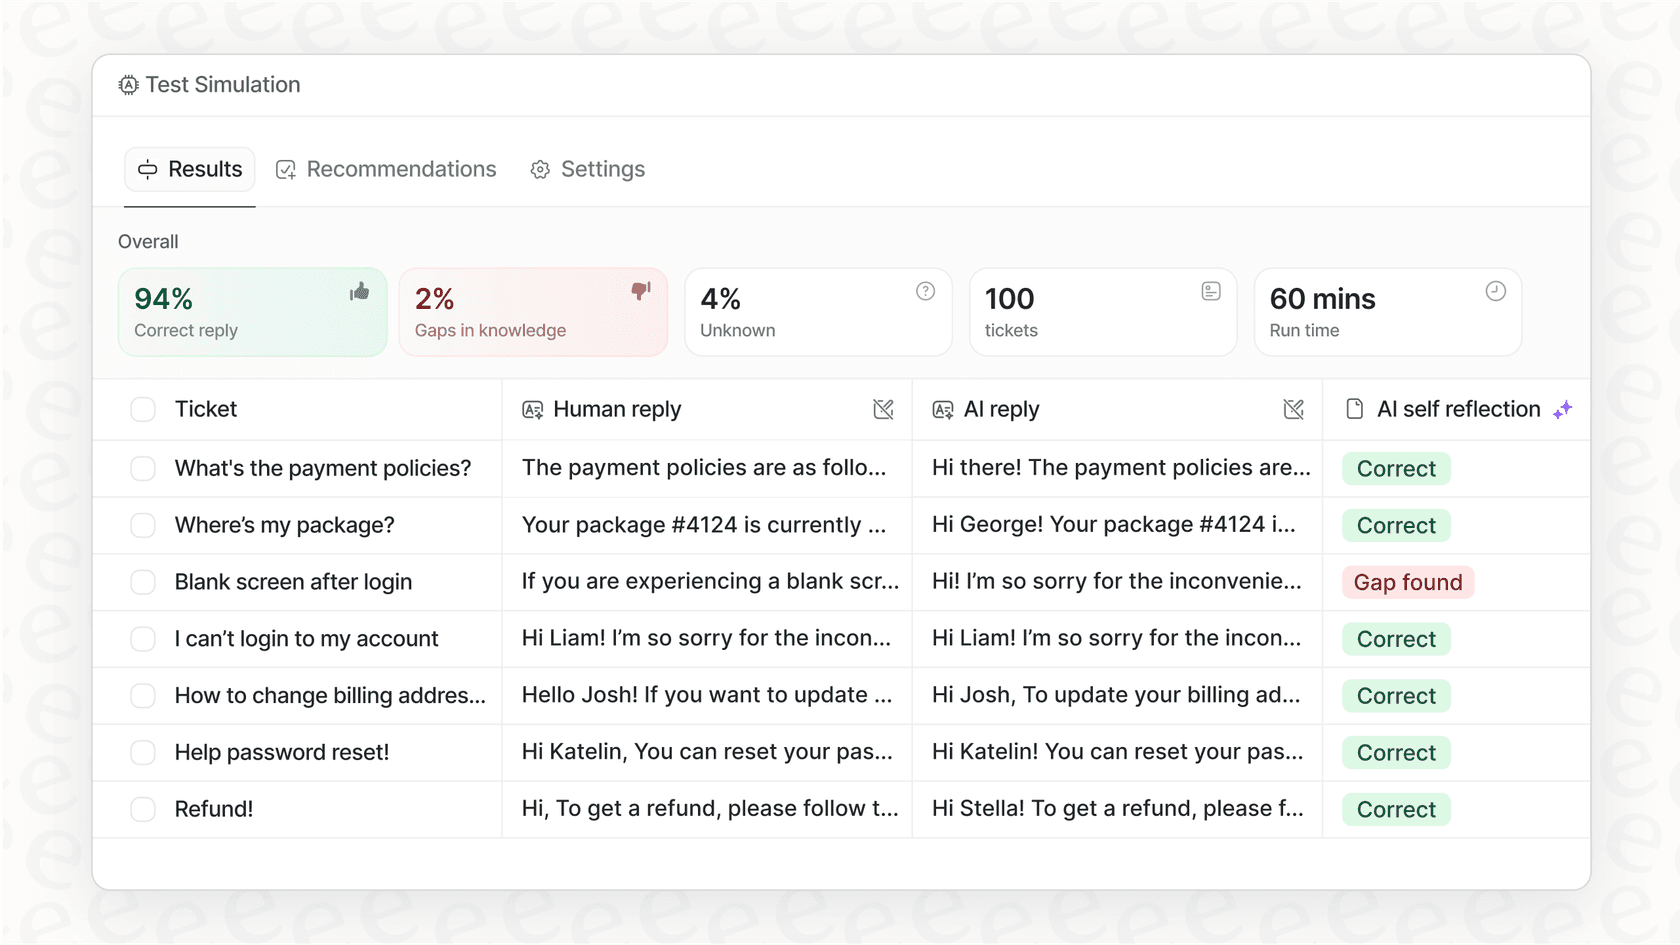
The setup takes minutes, not hours. You connect eesel AI to your Zendesk account, and it automatically learns your tone, processes, and common issues. Before going live, you can run simulations on past tickets to see exactly how it would perform. No guesswork. No hoping your configuration is correct.
Our customers typically see up to 81% of conversations resolved autonomously, with the AI paying for itself in under two months. That is not just tracking resolution time. That is actually improving it.
| Feature | Zendesk Explore Native | With eesel AI Integration |
|---|---|---|
| Setup time | Hours of configuration | Minutes to connect |
| Report building | Manual metric selection | Automatic tracking |
| Resolution improvement | Reports only | Active automation |
| AI assistance | Available as add-on | Included natively |
| Testing | Limited preview | Full simulation on past tickets |
If you are spending more time building reports than acting on them, it might be worth exploring an alternative approach.
Start improving your resolution time tracking today
You now have everything you need to build effective resolution time reports in Zendesk Explore. You understand the difference between first and full resolution time, know how to create custom reports, and can spot common pitfalls before they affect your data quality.
The key takeaways are simple. Use full resolution time for SLA reporting, not first resolution time. Add attributes to break down your data and find hidden problems. Test your reports against historical data to make sure they are accurate.
But tracking resolution time is only the first step. The real goal is improving it. Whether that means building better reports, training your team more effectively, or introducing AI assistance to handle routine tickets faster.
If you are curious about how AI could help your team resolve tickets faster, we would love to show you what eesel AI can do. You can try it free for 7 days or book a demo to see it in action with your actual Zendesk data.
