So, you've launched a support AI. That’s a big step. But now you're probably wondering what it's really doing. When a customer gets a slow or just plain wrong answer, figuring out why can feel like searching for a needle in a haystack. Is it the language model having an off day, a sluggish API call, or a blind spot in your knowledge base? Without a way to see inside, your support AI is just a black box.
This is where observability comes in handy. Using an open-source standard called OpenTelemetry, you can follow every move your AI makes, from the moment it picks up a ticket to when it sends out a response. This guide will walk you through the manual process of setting up logging and tracing for support AI with OpenTelemetry. We’ll cover the main ideas and the practical steps to get you started.
I'll be honest, this process takes some technical elbow grease, but it's a must-do for building an AI you can rely on. Of course, if you'd rather skip the manual labor, platforms like eesel AI handle all of this complexity for you, so you can focus on your customer experience instead of your telemetry pipelines.
What you'll need for a manual setup
Before we jump into the how-to, let's talk about what a manual setup actually involves. This route gives you total control, but it does require some dedicated resources.
Here’s a quick rundown of what you’ll need:
-
A development environment: You’ll likely be working in Python, since it’s a popular choice for AI apps.
-
OpenTelemetry SDKs and libraries: You'll need to install these packages to get your code to start recording what it's doing.
-
An observability backend: This is a tool where you send all your data to be visualized and analyzed. Think of tools like Jaeger (which is open-source) or Datadog.
-
Developer time: This isn’t a one-and-done task. It takes real engineering effort to implement, maintain, and actually make sense of the data you’re collecting.
That technical overhead is a big reason why many teams just opt for a managed platform. A tool like eesel AI hooks directly into your helpdesk, whether it's Zendesk or Freshdesk, in a matter of minutes. It gives you rich, support-focused insights without you having to write a single line of code.
A step-by-step guide
Alright, let's get into the nitty-gritty of instrumenting your support AI. The main goal here is to create a detailed record, called a "trace," that follows a single customer request from the very beginning to the very end.
Step 1: Set up the environment
First things first, you need to configure the basic OpenTelemetry framework inside your application. This means setting up three main components:
-
A Tracer Provider: This is essentially the factory that creates "tracers" in your app. Think of it as the main engine that powers all your data collection.
-
An Exporter: This part is responsible for sending your data to your observability backend. It’s the pipeline that moves information from your app to a place where you can actually look at it.
-
A Span Processor: This component manages the lifecycle of your "spans" (which are the individual steps in a trace) and hands them off to the exporter. It ensures every piece of data is handled correctly.
Basically, your code will initialize these components so that your application is always ready to capture and send out telemetry data. You can also set up an OpenTelemetry Collector, a separate service that gathers, processes, and exports data. This can make your application code a bit cleaner by taking some of the data-processing work off its plate.
Step 2: Instrument the workflow
With your environment ready, it’s time to start adding tracing to your AI's logic. A trace represents the entire journey of one support ticket, and a span represents a single step within that journey. Picture it as a timeline with specific, labeled events.
For example, let's follow a classic support request: "What's the status of my order?"
Your AI might go through a few steps to answer this:
-
Receive and understand the incoming ticket.
-
Figure out the user's intent is "order status inquiry."
-
Call an internal API to fetch the order details.
-
Use a Large Language Model (LLM) to write a friendly, human-sounding response.
-
Update the ticket with the answer and close it.
Each of these actions should be wrapped in its own span. This creates a clear, parent-child structure that lets you visualize the entire workflow and see exactly how long each step took. By breaking the process down like this, you can immediately spot where things are slowing down or breaking.
Step 3: Capture attributes and metrics
Just tracing the workflow is a good start, but it isn't enough. To get real value, you need to add context to your spans with data known as attributes. Luckily, there are some emerging semantic conventions for GenAI from OpenTelemetry that give you a standard way to name these things. For a support AI, you want to track both technical details and info that's relevant to the business.
Here are a few key attributes you should be capturing:
-
Model parameters: "llm.model.name", "llm.temperature"
-
Token usage: "llm.usage.prompt_tokens", "llm.usage.completion_tokens" (this one is huge for keeping an eye on costs)
-
Tool calls: "tool.name", "tool.input", "tool.output"
-
Business context: "customer.id", "ticket.id", "ticket.tags"
When you capture this kind of data, you can go from simply monitoring performance to answering important business questions. Instead of just knowing if a response was slow, you can understand why it was slow and what that means for your customers.
| Technical Attribute | Business Question it Answers |
|---|---|
| "llm.usage.total_tokens" | How much are we spending on average to resolve a ticket? |
| "tool.call.duration" | Are our own internal APIs the reason support responses are slow? |
| "response.success" (custom) | How often is the AI actually solving issues versus just escalating them? |
| "knowledge.source.used" (custom) | Which of our help articles are genuinely useful, and which aren't? |
Step 4: Use tracing data to improve your AI
Once your data is flowing into your observability tool, you can start digging in to diagnose problems and find ways to get better. This is where the setup really pays off.
-
Debugging Slow Responses: A long trace makes it obvious which span is the bottleneck. If the "tool.call:lookup_order" span is taking five seconds, you know the problem isn't the LLM, it's your internal order system. Now you know exactly where to focus your efforts.
-
Investigating Incorrect Answers: By looking at the "llm.prompt" and "llm.completion" attributes, you can see the exact information the AI was given and what it came up with. You might find out that the context it pulled from your knowledge base was outdated, causing it to "hallucinate." This lets you fix the root cause instead of just patching the symptoms.
-
Finding Knowledge Gaps: If you log every time the AI can't find an answer, you can spot trends pretty quickly. A bunch of logs related to "how to get a refund" is a clear signal that you need to write or improve your documentation on that topic. Your support AI becomes a tool that proactively helps you improve your self-service resources.
Pro tips and common mistakes to avoid
Setting up logging and tracing for support AI with OpenTelemetry can be a little tricky. Here are a couple of tips to help you out and some common pitfalls to watch for.
-
Common Mistake #1: Only Tracking Latency. It’s easy to get hyper-focused on speed, but accuracy and effectiveness are what really matter. Create custom attributes to track things like resolution success, escalation rates, and even customer satisfaction scores tied to AI interactions. The goal is better support, not just faster answers.
-
Common Mistake #2: Underestimating the Complexity. A manual OpenTelemetry setup isn't something you can just set up and walk away from. It needs regular maintenance as your AI application grows and changes. The real work isn't just collecting the data; it's building the dashboards and alerts that turn that data into something you can actually act on.
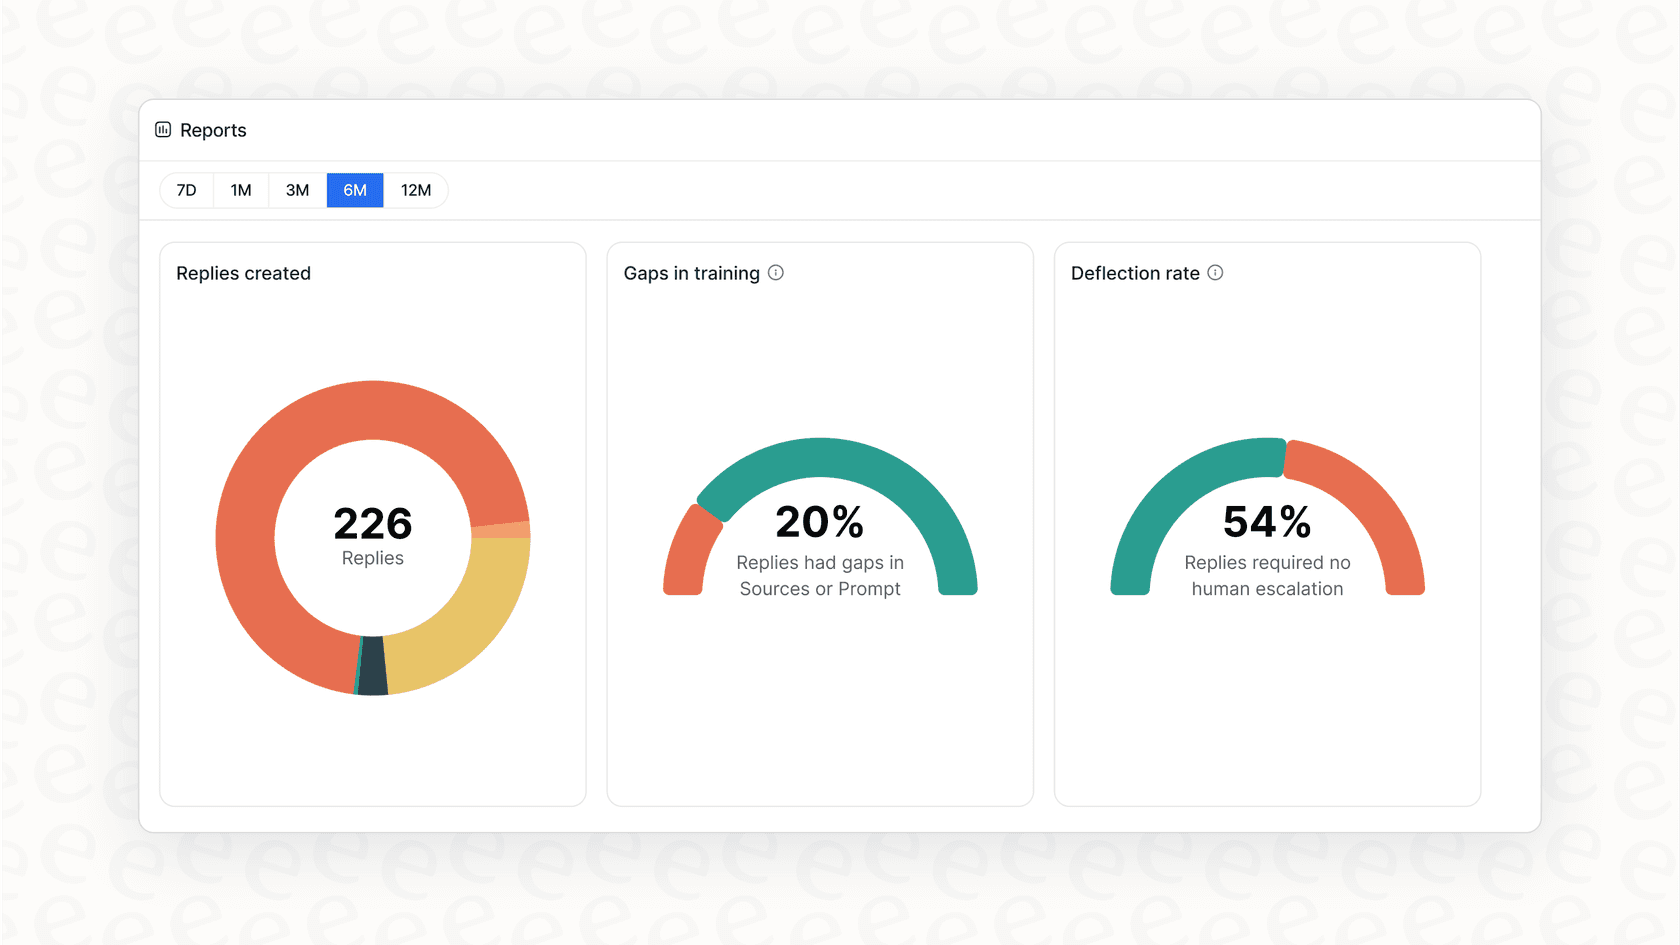
This is where a managed platform offers a ton of value. Solutions like eesel AI are already set up to capture the most important support-specific data. Instead of building dashboards from scratch, you get reports that automatically point out knowledge gaps and show you the best opportunities for automation.
From complex data to clear insights
Putting OpenTelemetry in place is a great way to open up the black box of your support AI. It lets you trace every request, measure performance, keep costs in check, and ultimately build a system that's more reliable and effective. But, as we've covered, doing it all yourself is a serious investment in engineering time and ongoing upkeep.
Get AI observability out of the box with eesel AI
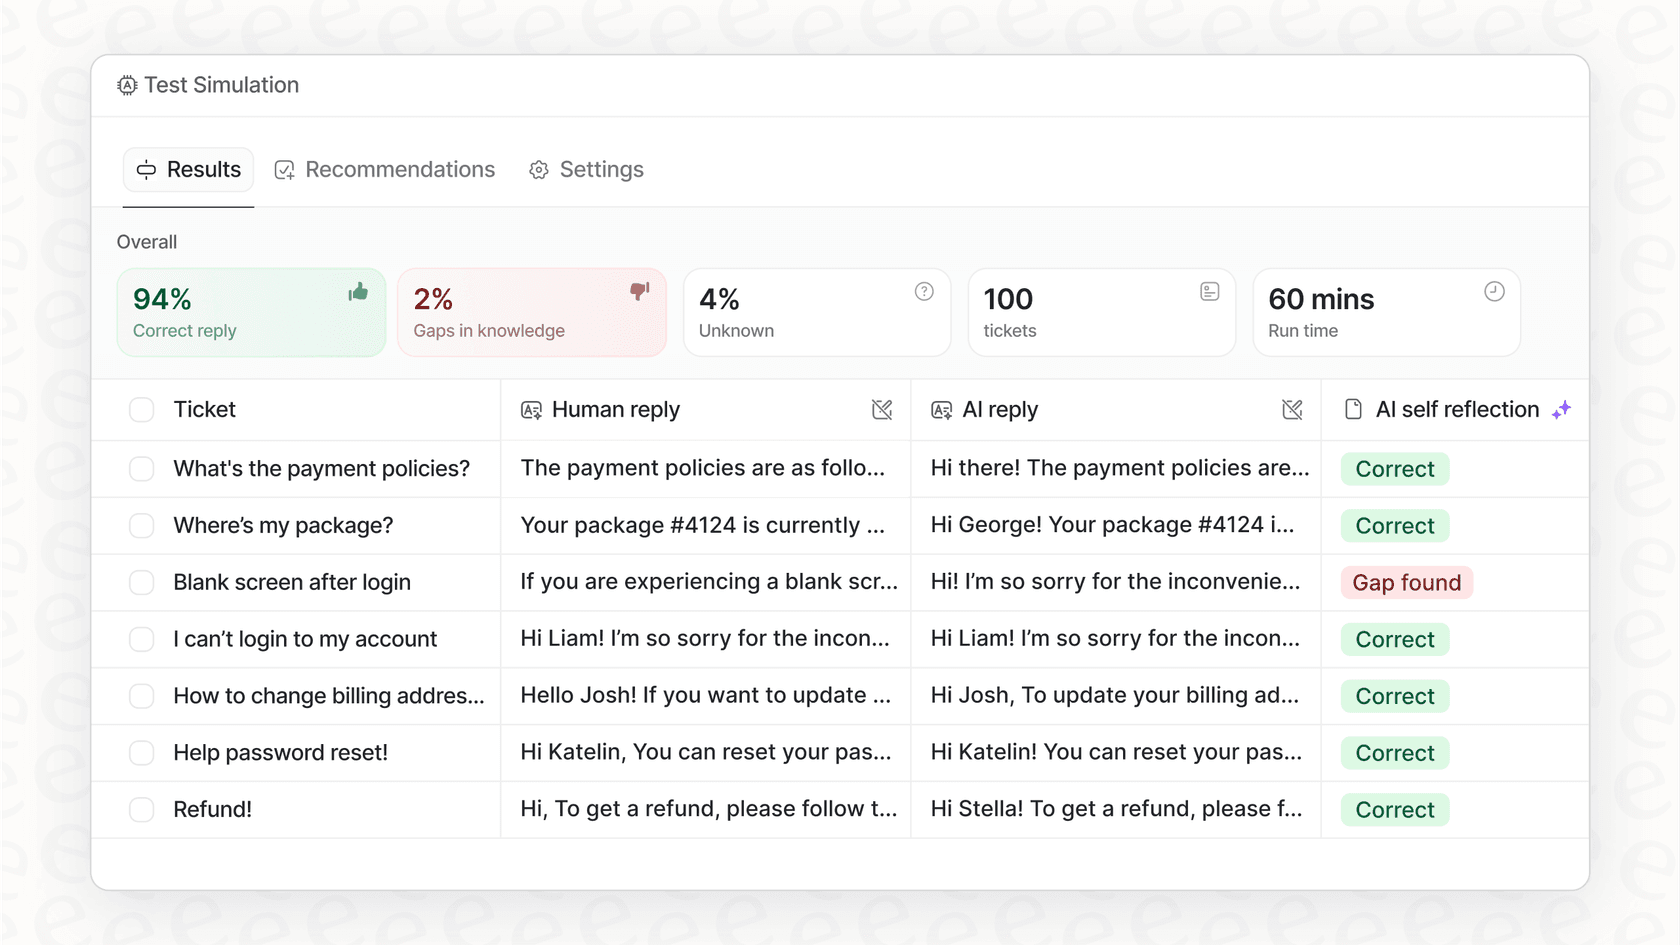
If you want all the benefits of deep AI observability without the headache, eesel AI was built for you. Our platform comes with comprehensive logging and tracing built right in, specifically designed for customer support teams. You can simulate performance on historical tickets to see your potential ROI, get actionable reports on knowledge gaps, and go live in minutes, not months.
Ready to see what your support AI is really capable of? Start your free trial today.
Frequently asked questions
It [transforms your support AI from a black box](https://devops.com/next-generation-observability-combining-opentelemetry-and-ai-for-proactive-incident-management/) into a transparent system, allowing you to understand its actions. This visibility is crucial for debugging issues, identifying bottlenecks, and ensuring reliable performance and cost efficiency.
You'll primarily need a Tracer Provider to create tracers, an Exporter to send data to your observability backend, and a Span Processor to manage span lifecycles. An optional OpenTelemetry Collector can also streamline data processing.
Beyond basic workflow traces, capture attributes like LLM model parameters, token usage, tool calls, and business context (e.g., customer ID, ticket tags). These provide crucial context for deeper analysis and understanding.
It enables you to [debug slow responses by identifying bottlenecks](https://learn.microsoft.com/en-us/azure/ai-foundry/how-to/develop/trace-agents-sdk), investigate incorrect answers by reviewing prompts and completions, and spot knowledge gaps by tracking unsuccessful AI interactions. This data allows for targeted, data-driven improvements.
A manual setup requires significant developer time for initial implementation, ongoing maintenance, and building custom dashboards for analysis. It gives you full control but demands a dedicated and sustained engineering effort.
Yes, managed platforms like eesel AI offer built-in observability specifically designed for support AI. They handle the underlying complexity, providing out-of-the-box insights and reports without requiring manual setup or custom code.
Share this article

Article by
Kenneth Pangan
Writer and marketer for over ten years, Kenneth Pangan splits his time between history, politics, and art with plenty of interruptions from his dogs demanding attention.