Chatbot analytics guide: how to track and improve chatbot performance
Quinela Wensky
Katelin Teen
Last edited May 15, 2026
Most teams launch a chatbot, watch the ticket volume dip, and call it a win. A few months later, customer complaints start creeping back up. The chatbot hasn't gotten worse exactly, but it hasn't gotten better either. Nobody knows why, because nobody has been measuring anything beyond whether the chatbot is "on."
That's the failure mode chatbot analytics is designed to prevent. When you're tracking the right metrics, a fallback spike two weeks before your CSAT drops gives you enough time to fix the knowledge gap before customers notice. Without it, you're discovering problems only after they've compounded.
eesel AI, which handles over 1 million tasks for 2,000+ teams, surfaces these analytics automatically through its Skills system, so support teams don't have to build a measurement framework from scratch. For everyone else, this guide covers what to track, what the numbers should look like, and how to close the loop between data and improvement.
Why tracking chatbot analytics matters
Only 44% of companies actually use message analytics to monitor their chatbot's effectiveness (Tidio, 2026). The rest either assume things are working or discover problems through customer complaints, which is a costly way to find out.
The arithmetic is straightforward. Bot-handled conversations typically cost $0.10-$0.50 each; human agent conversations run $6-$12 (IBM, via Netguru). At 10,000 conversations per month, that gap is worth over $57,000 in monthly savings - but only if the chatbot is actually performing well. If it isn't, you're paying for both the bot and the agents cleaning up after it.
Gartner predicts conversational AI will reduce contact center labor costs by $80 billion by 2026, but that only materializes for teams actively optimizing their deployments. Analytics is what separates optimization from hope.
Three dimensions of chatbot performance
Before getting into specific metrics, it helps to understand how they group together. OMQ organizes all chatbot KPIs into three categories: efficiency, quality, and business impact. In practice, the working version looks like this:
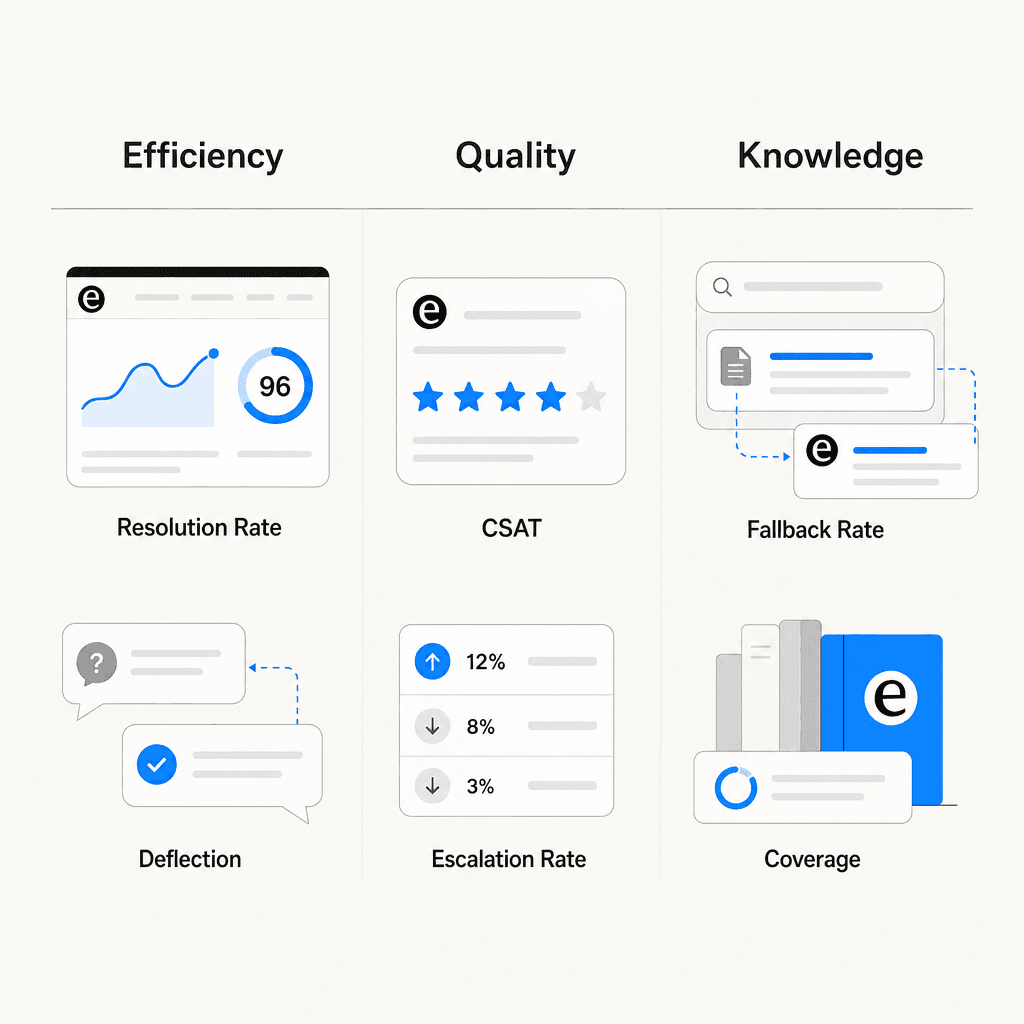
- Efficiency metrics measure what the chatbot handles and how fast: resolution rate, containment rate, ticket deflection rate, response time.
- Quality metrics measure whether what it handles is actually good: CSAT, escalation rate, sentiment, negative response rate.
- Knowledge metrics measure the health of what the chatbot knows: fallback rate, intent coverage, KB gap rate.
All three categories have to be healthy for the deployment to be working. A chatbot can look excellent on efficiency (high containment, fast responses) while quietly failing on knowledge (high fallback rate, growing gaps) and quality (CSAT eroding). Teams that watch only one category miss the others. See eesel's overview of AI customer service metrics for a deeper look at how these categories interact.
The 8 key chatbot metrics to track
Here are the metrics that show up in every serious chatbot analytics framework, with benchmarks from the Comm100 2026 AI Live Chat Benchmark Report (220M+ interactions), OMQ's chatbot KPI benchmarks, and Netguru's chatbot KPI analysis.
Resolution rate (first contact resolution)
What it is: The percentage of queries resolved at first contact, without the customer needing to return or escalate.
Formula: (Queries resolved at first contact / Total queries) × 100
Benchmark: OMQ puts strong FCR at 75-90% for AI systems, with 65% as a floor. The Comm100 2026 report found AI chatbots fully resolve 44.8% of conversations on average across all industries, with non-profits at 97.7%, manufacturing at 78.4%, and banking at 75.2%.
What to watch for: If resolution rate is well below containment rate, the chatbot is closing conversations without actually solving problems. Netguru audited a 200-person SaaS company with a 61% containment rate and a 38% FCR. The bot was ending sessions before confirming resolution.
CSAT
What it is: Direct satisfaction feedback from users after a chatbot interaction, collected via post-conversation surveys (typically a 1-5 scale or thumbs up/down).
Formula: (Positive ratings / Total ratings) × 100
Benchmark: OMQ benchmarks chatbot CSAT above 80%, with below 60% as a clear warning. Netguru references Salesforce's State of Service data putting human agent CSAT at 85-90%; chatbot CSAT typically runs 10-15 points lower. A gap wider than 15 points usually means the escalation routing logic is broken, not the chatbot response quality.
How to segment: Break CSAT down by topic area. The chatbot may score 85% on standard shipping questions and 55% on billing disputes. OMQ recommends granular segmentation so you can fix targeted issues rather than tuning the whole system for a problem that lives in one intent cluster.
Containment rate and ticket deflection rate
These two metrics get conflated, but they measure different things. Netguru explicitly separates them: containment is an operational metric (did a human get involved?), while deflection is a cost metric (did a ticket enter the queue?). Both are necessary. Read eesel's guide to measuring AI containment rate and escalation quality for the full breakdown.
Containment rate benchmark: Gartner data places healthy containment at 70-85% for transactional use cases (account lookups, order status, password resets); 50-65% for conversational support. Below 60% signals intent coverage gaps.
Ticket deflection rate benchmark: OMQ benchmarks ticket deflection above 50%, with leading deployments reaching 50-80%. Every deflected ticket saves 5-15 minutes of agent time. See eesel's AI support ticket deflection guide for how to calculate the ROI.
Escalation rate
What it is: How often the chatbot transfers conversations to a human agent. The inverse of containment rate.
Benchmark: OMQ targets below 25%. Netguru puts 15-30% as healthy, with above 40% or a rising month-over-month trend as a warning. Higher rates are acceptable for medical or legal use cases where human involvement is appropriate.
What to watch for: Escalation rate by reason matters as much as the rate itself. Netguru explains that if 60% of escalations come from low-confidence intent matches, the fix is model retraining. If users escalate despite accurate intents, there's likely a conversation design problem. The two require different interventions.
Fallback rate (knowledge gap rate)
What it is: The percentage of conversations where the chatbot couldn't understand or answer and fell back to a generic response. A direct measure of knowledge base completeness and NLP model quality.
Formula: (Fallback responses / Total conversations) × 100
Benchmark: OMQ benchmarks fallback rate below 10%, with below 5% as excellent and above 20% indicating significant gaps. When intent recognition accuracy drops below 80%, fallback rate spikes (Netguru, citing Gartner).
Quick fix: Export fallback logs weekly and identify the top 10 unhandled topics. Adding those to the knowledge base typically reduces fallback rate by 30-50% per cycle (OMQ). This is the single highest-leverage improvement action available.
Sentiment analysis
What it is: NLP-based scoring of conversation transcripts to detect whether users feel positive, neutral, or negative during interactions.
Netguru recommends tracking NPS segmented by resolution path: bot-only versus bot-then-agent. If escalated sessions produce dramatically lower sentiment scores, the handoff itself is the problem. Sentiment is a leading indicator for CSAT, surfacing deterioration weeks before it appears in survey data. Freshworks lists sentiment analysis as a core feature of any complete chatbot analytics dashboard.
Conversation volume and trends
Volume alone doesn't tell you much; volume as a trend does. OMQ notes that declining conversation volume often signals entry-point visibility problems, not chatbot quality issues. Tidio recommends using hourly volume data to schedule human agents during peak periods, reducing escalation load when complex queries tend to cluster.
Response time and average handle time
Chatbots should respond in under 2 seconds - that part is mostly solved. The gap that matters is what happens to handle time after escalation. Context-rich escalations, where the chatbot passes full conversation history to the receiving agent, cut average handle time by roughly 20% compared to cold transfers (Zendesk CX Trends data, via Netguru).
For the full conversation, OMQ benchmarks average handling time at 2-5 minutes for standard customer service queries. A very short AHT is not automatically good - it may indicate abandoned conversations rather than fast resolutions.
Benchmark summary table
| Metric | Good range | Warning sign |
|---|---|---|
| Resolution rate (FCR) | 65-90% | Below 40% |
| CSAT | Above 80% | Below 60%, or 15+ pts below human agent |
| Containment rate | 70-85% (transactional) | Below 50% |
| Ticket deflection rate | Above 50% | Below 30% |
| Escalation rate | 15-30% | Above 40% or rising MoM |
| Fallback rate | Below 10% | Above 20% |
| Intent recognition accuracy | Above 85% | Below 80% |
| Average handling time | 2-5 min | Very short (may indicate drop-off) |
| Engagement rate | 35-40% | Below 20% |
Sources: OMQ, Netguru, Tidio, Comm100
How to read chatbot metrics correctly
The most common mistake in chatbot analytics is optimizing a single metric in isolation. A chatbot with 80% containment and 35% FCR is containing frustration, not solving problems. A chatbot with short average handle time and low resolution rate is ending conversations early.
Netguru draws a useful distinction between leading and lagging indicators:
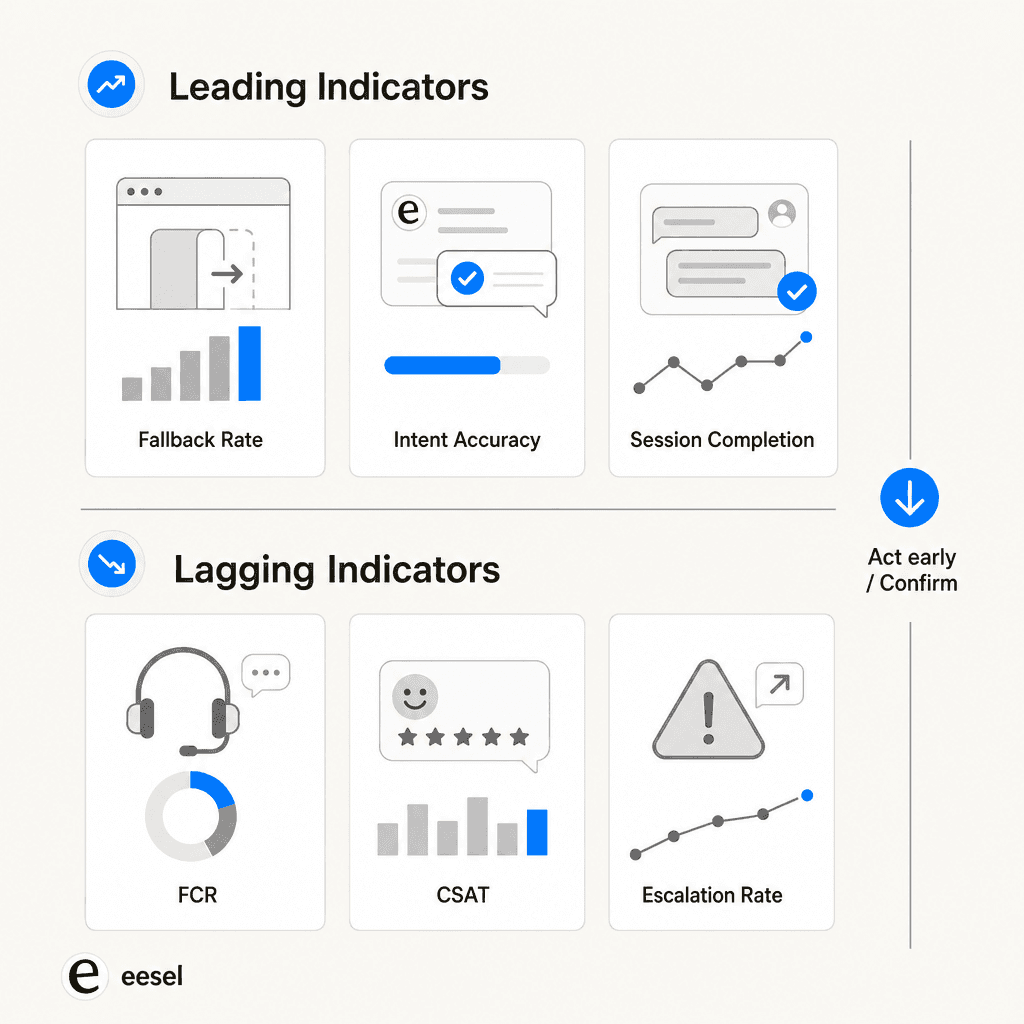
Leading indicators (act on these early):
- Intent recognition accuracy: When this drops below 85%, it propagates through all downstream metrics within 2-3 weeks.
- Fallback rate: A spike here predicts containment problems before they surface.
- Session completion rate: Below 70% predicts CSAT scores under 75% almost without exception (Netguru).
Lagging indicators (confirm outcomes, but slowly):
- FCR and CSAT: Meaningful but slow. By the time CSAT drops, the underlying problem is already weeks old.
- Escalation rate: Confirms what leading metrics already showed.
Teams watching fallback rate and intent accuracy weekly catch containment problems 2-3 product sprints earlier than teams watching CSAT alone. The eesel AI chatbot metrics guide for ecommerce has a useful breakdown of which metrics to prioritize depending on your deployment type.
The metric pairs that must be read together:
- Containment rate + FCR: a wide gap means volume is being handled but problems aren't being solved
- Escalation rate + escalation reason: tells you whether the fix is retraining or UX redesign
- CSAT + ticket deflection: both need to be high - deflection at the expense of service quality isn't a win, per OMQ's warning on this
The analytics feedback loop
Data without action is just cost. The feedback loop that actually improves chatbot performance runs four steps:
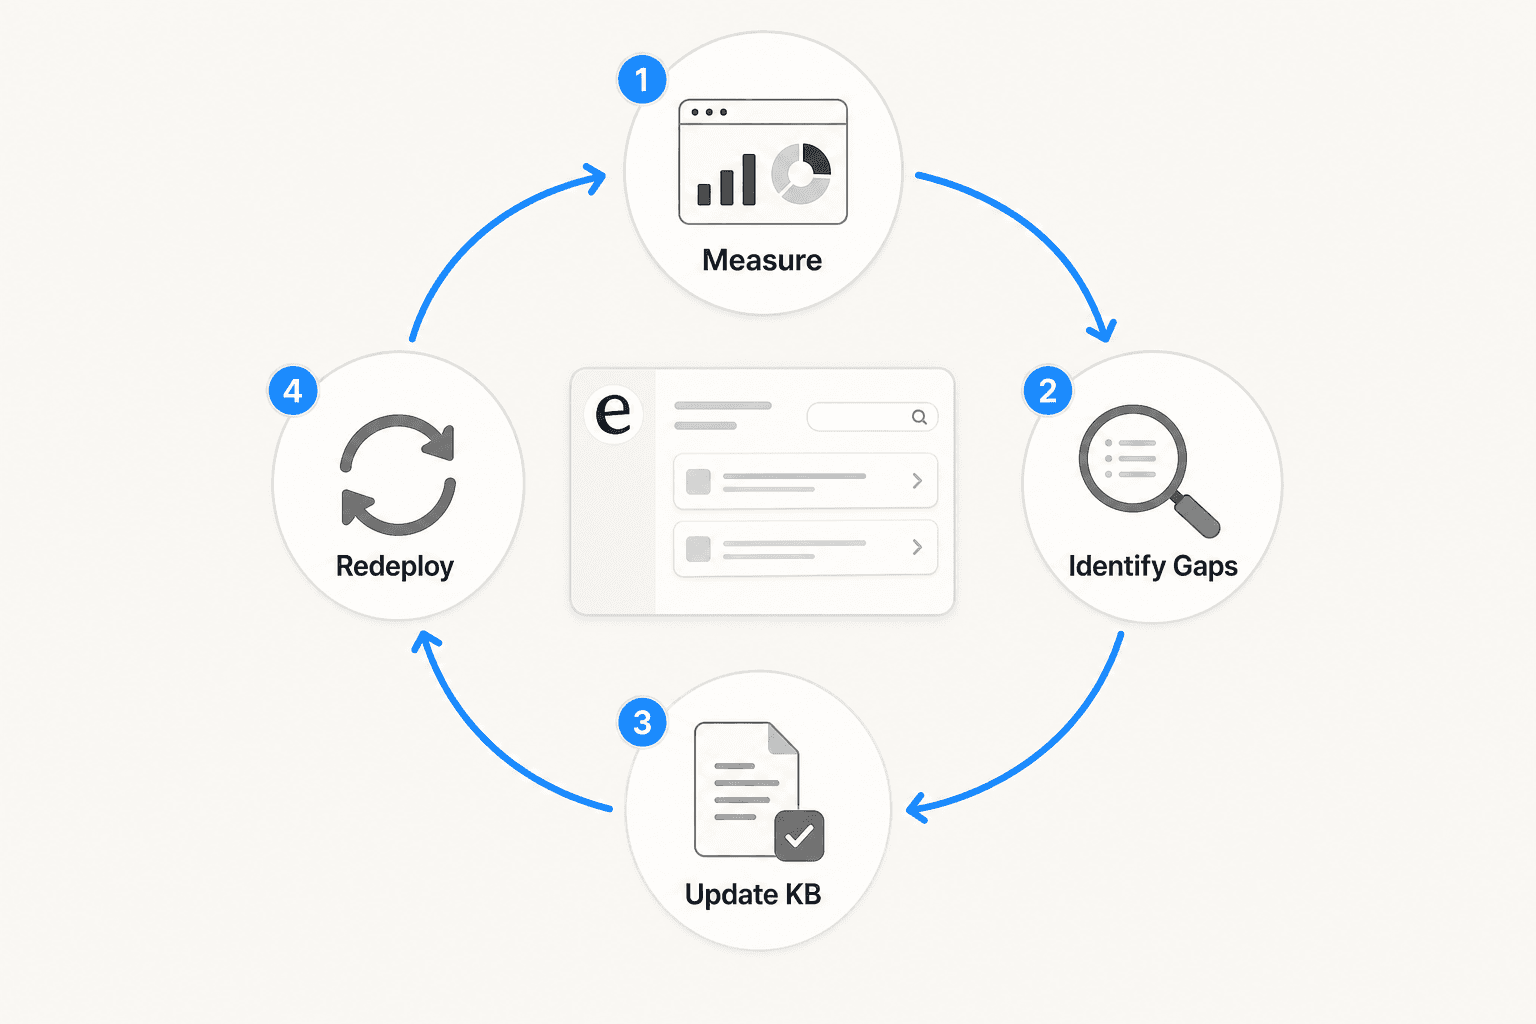
- Measure - pull fallback rate, escalation triggers, intent accuracy, FCR, and CSAT weekly
- Identify gaps - export fallback logs, cluster escalation reasons, find drop-off points in conversation flow
- Update KB - add the top 10 unhandled topics; refine training for high-fallback intents; fix broken conversation paths
- Redeploy and re-measure - close the loop; OMQ notes that targeting just the top 10 fallback topics reduces fallback rate by 30-50% per cycle
At a weekly cadence, most teams see meaningful improvement within a month. The key is making the loop systematic rather than manual. A support team handling 1,000 tickets per day can't export fallback logs by hand every week without someone whose job that is.
Zoho SalesIQ's flow reports let teams see metrics at the individual conversation node level, identifying exactly where users abandon and why. Once the drop-off point is found, the cause is usually either missing KB content or a broken conversation path. Freshworks identifies platform integration as the other key enabler: when business data stays siloed in the CRM and the chatbot can't access it, escalation rates stay artificially high regardless of how good the NLP is.
What eesel AI's analytics dashboard shows
eesel AI builds the analytics feedback loop into its Skills system, which layers on top of the core helpdesk agent. Rather than a static reporting dashboard, skills are analytical workflows that run on historical conversations and produce structured outputs.
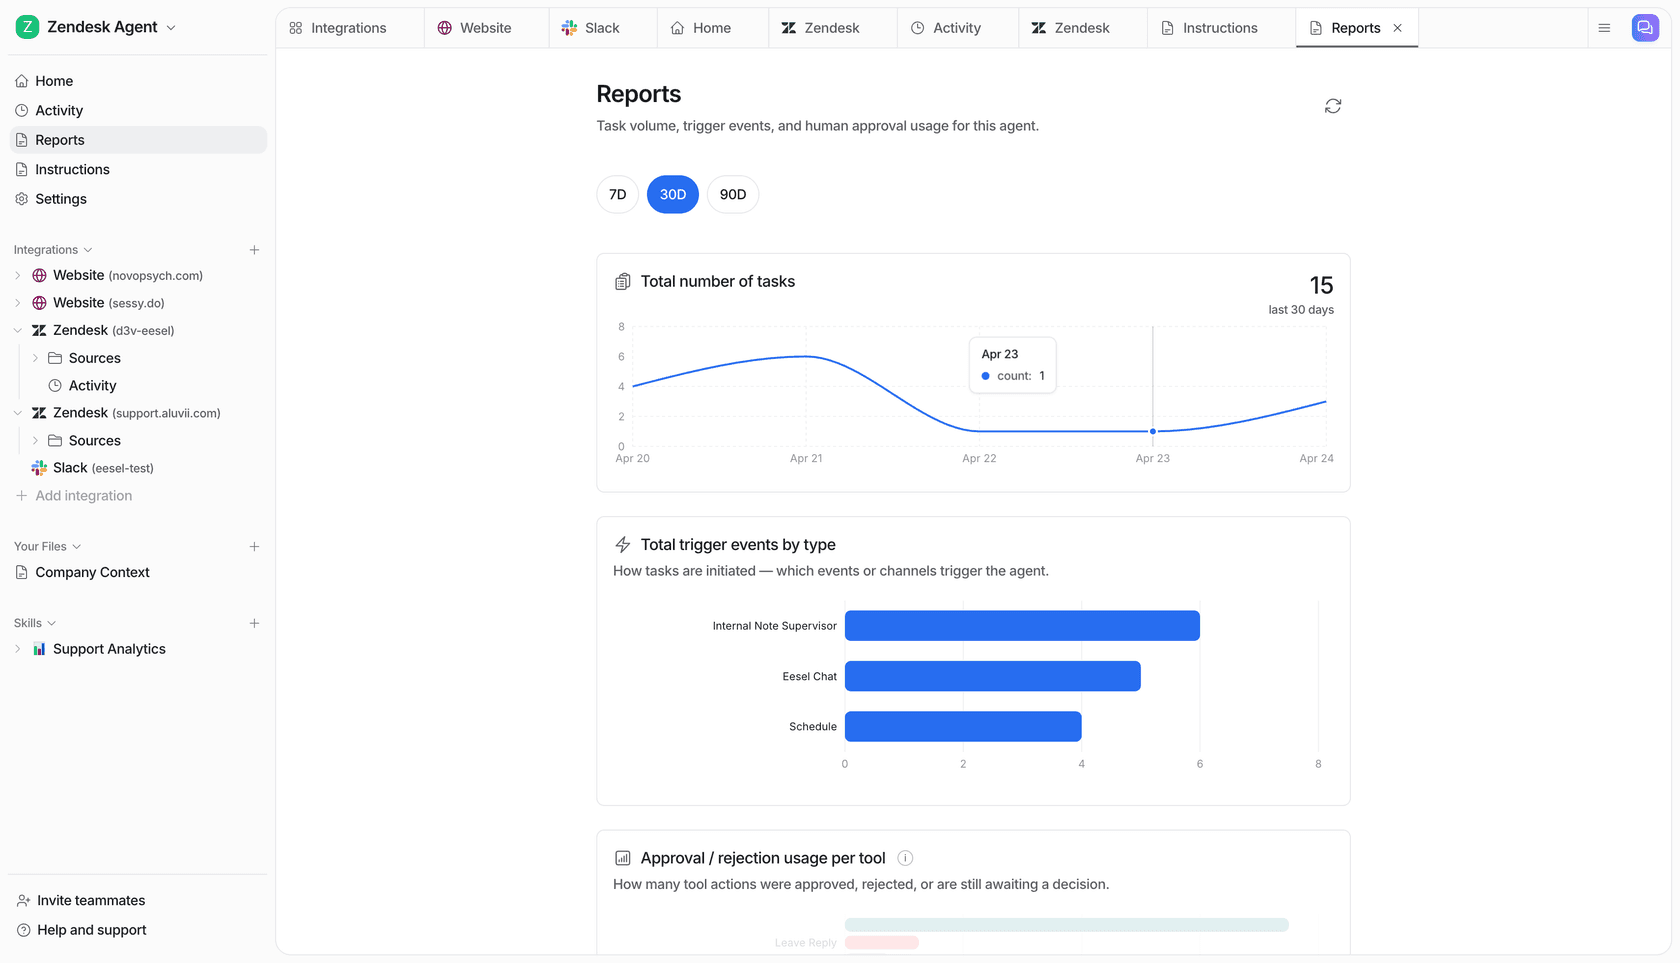
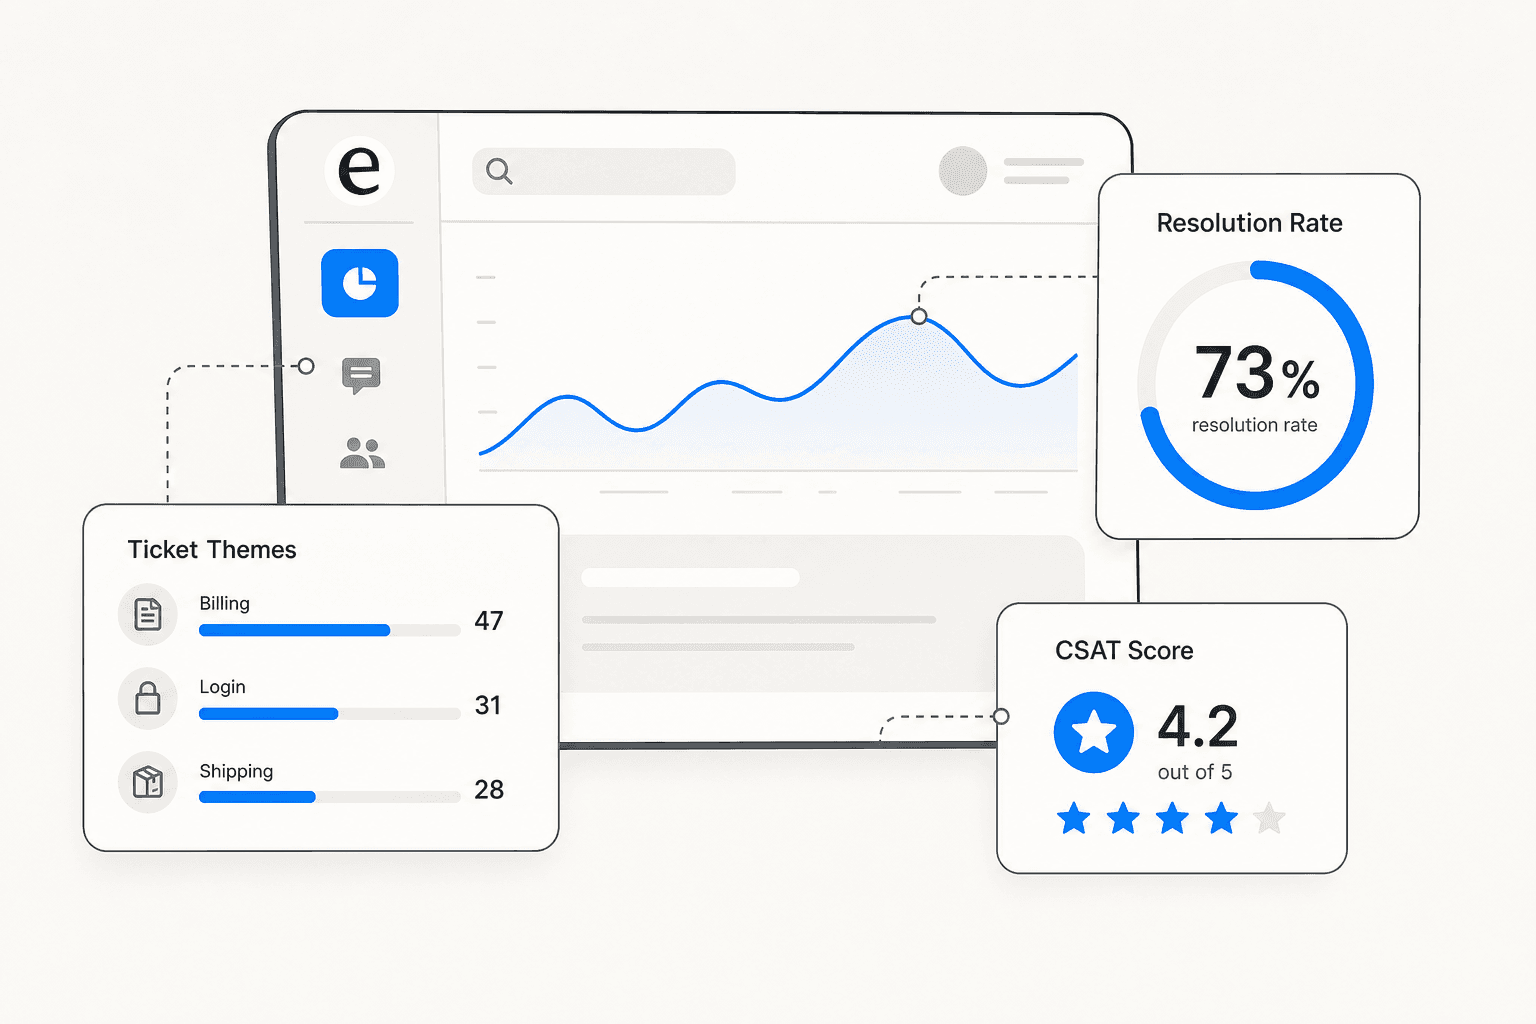
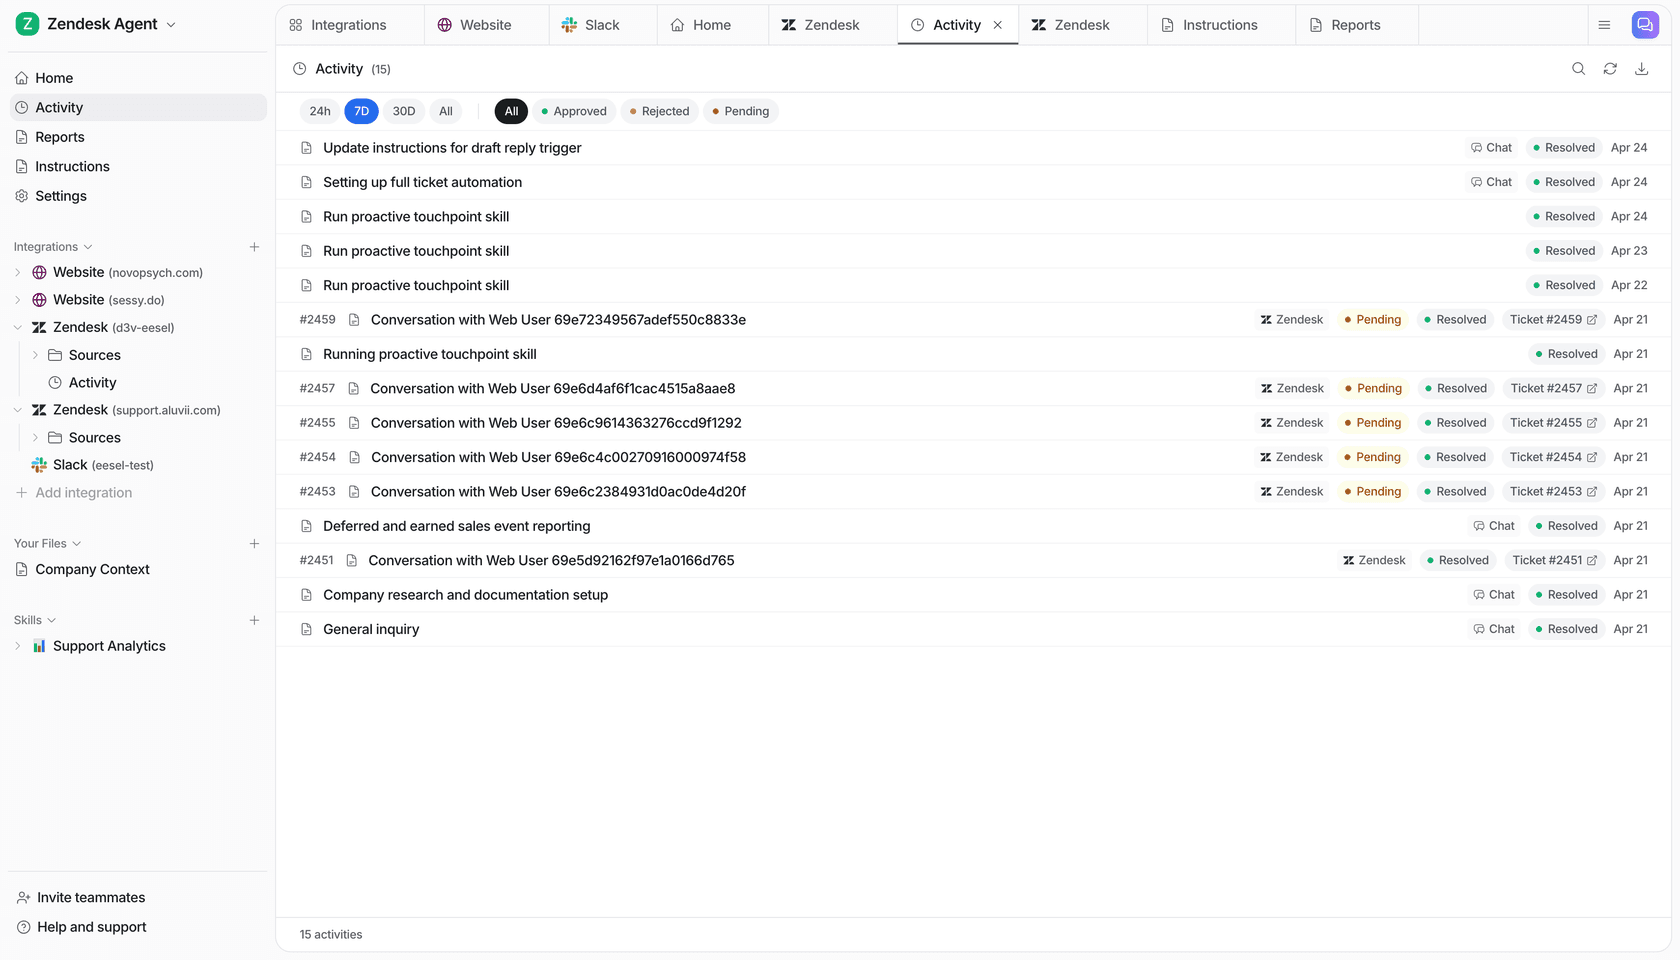
The live ticket tracking dashboard records every ticket the agent touches: topic, resolution status (awaiting approval, in progress, resolved by agent, escalated to human), confidence level (low/medium/high), CSAT score on a 1-5 scale, and a direct link to the source ticket. That's the base layer.
On top of that, skills run deeper analyses on-demand or on a schedule.
Support Analytics / Theme Analysis analyzes conversations across channels for recurring topics, volume trends, and resolution rates. The output is a ranked list of ticket themes by volume. A typical output looks like: "151 tickets analyzed across 6 themes: Billing Issues 47, Login Problems 31, Shipping Delays 28, Feature Requests 19, Account Access 14, Refund Policy 12." This skill identifies which topics are growing week-over-week, so teams can prioritize KB updates before a trending issue starts degrading CSAT.
Triage Review audits how the agent has been routing tickets over a review period. It specifically looks at re-opens, escalations, and misroutes, then surfaces suggested adjustments to improve triage accuracy.
Sentiment Review detects sentiment trend shifts across conversations. Rather than simple positive/negative scoring, it flags specific deterioration: "negative sentiment up 30% on billing tickets." This is the kind of leading indicator that lets teams catch a product issue before it shows up in CSAT scores.
KB Auto-Updater connects analytics directly to content operations. It identifies knowledge gaps from conversation patterns, then drafts new KB articles from resolved conversations. The gap between "what customers ask about" and "what the KB covers" becomes a directly actionable content list rather than a vague to-do.
Skills run on-demand or on a schedule. Setting "run Support Analytics every Monday at 9am and email me a summary" takes two clicks in Settings > Schedules. The full list of available skills is in eesel's skills documentation.
Before you go live: Simulation
One capability that stands apart from typical analytics dashboards is the Simulation skill, which runs analytics before any live customer sees the agent.
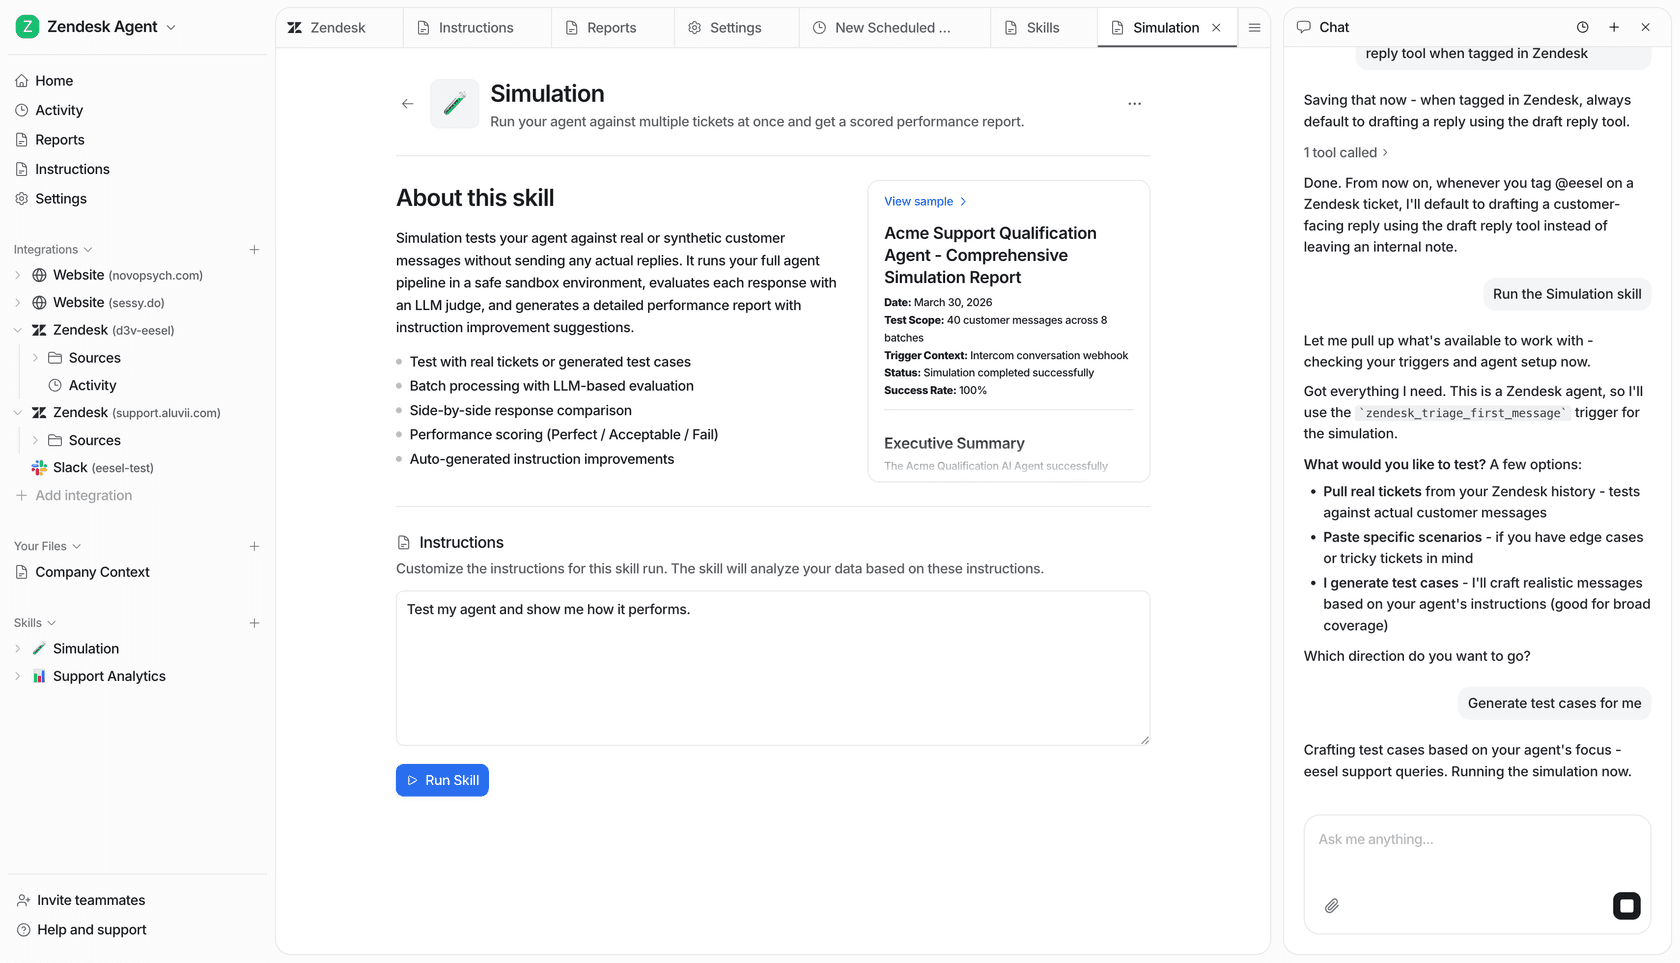
Point the agent at historical ticket data and it generates a detailed performance forecast: predicted automated resolution rate, potential cost savings, a full list of topics the agent can handle, and specific knowledge gaps broken down by topic. You can see that billing coverage is 0% before adding billing docs, and 91% after. That's the full feedback loop running before a single live customer is affected.
Gridwise saw 73% tier-1 resolution in their first month using eesel, which is consistent with teams that use simulation to close knowledge gaps before go-live rather than discovering them through customer experience. Zendesk AI usage analytics has a comparison of how pre-deployment simulation differs from typical Zendesk reporting for teams running AI on top of an existing helpdesk.
Try eesel AI
eesel AI gives support teams the analytics they need to actually improve chatbot performance over time, not just deploy and hope. The Support Analytics, Simulation, Sentiment Review, and Triage Review skills run the feedback loop automatically on any connected helpdesk. Simulation closes knowledge gaps before go-live. And the per-task pricing - $0.40 per regular ticket, no per-seat fees, no platform cost - means you're not paying for a separate reporting layer on top of what you're already running.
Start a free trial with $50 in credits to run simulation on your own ticket history and see the knowledge gap report before committing to anything.
Frequently Asked Questions
What is chatbot analytics?
What is a good resolution rate for a chatbot?
How often should I review my chatbot's analytics?
What is the difference between deflection rate and containment rate?
What should I do if my chatbot's fallback rate is too high?

Article by
Quinela Wensky
Quinela is a UI/UX designer at eesel AI with a background in Visual Communication Design from Institut Teknologi Bandung. She has over five years of graphic design and illustration experience and focuses on user-centered work across game design, accessibility, and interaction.