CSAT Calculator
Calculate your Customer Satisfaction Score (CSAT) instantly. Enter how many responses you got for each rating and see your score on the gauge.
Total responses: 0
The complete guide
What is a CSAT score? A plain-English guide for support teams
What is a CSAT score, how do you calculate it, what counts as good, and why the survey number you trust is missing most of your customers.
10 min read
What a CSAT score actually measures
CSAT stands for customer satisfaction score, and it answers one narrow question: how happy was this customer with this specific experience? Not your product overall, not whether they'd recommend you to a friend, just the interaction in front of them. A customer finishes a chat, closes a ticket, or hangs up a call, and you ask them some version of "how satisfied were you?" on a 1-to-5 (or sometimes 1-to-3 or 1-to-10) scale.
That narrowness is the point. Because CSAT is tied to a single moment, it's the metric that tells you whether your support is actually working day to day, which is why it anchors almost every customer service AI report. It's also why it's so easy to misread, as we'll get to.
The classic version is the post-ticket email survey: a customer's issue gets resolved, and a few minutes (or a few hours) later they get a one-question prompt. IBM's breakdown of CSAT is a good plain reference if you want the textbook definition, but the mechanics matter less than what you do with the result.
How to calculate a CSAT score
Here's the formula, and it really is the whole thing:
CSAT score (%) = (number of satisfied responses ÷ total responses) × 100
"Satisfied" almost always means the top responses on your scale. On a 1-to-5 smiley scale, that's the 4s and 5s. On a binary Good/Bad survey (which is what Zendesk's native CSAT uses), it's the "Good" votes. Count those, divide by everyone who answered, multiply by 100.
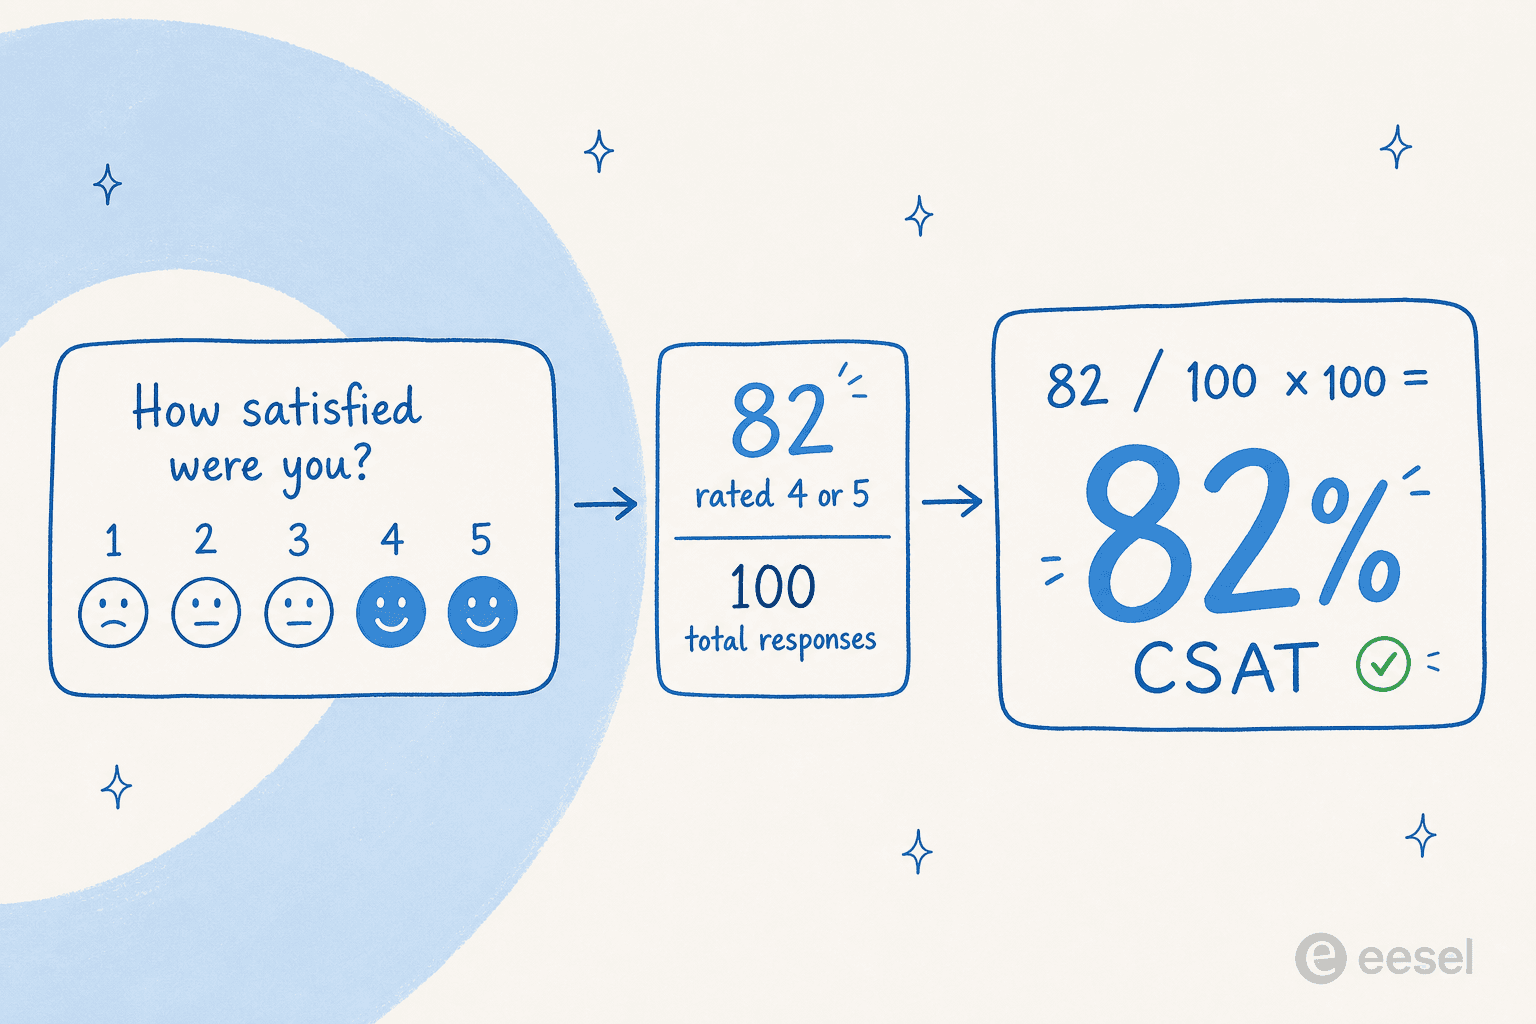
A worked example: say 100 customers answer your survey this week. 82 of them rated the experience a 4 or 5. Your CSAT score is (82 / 100) × 100 = 82%. Note what's not in that math: the people who didn't answer don't count at all. They're not a 0, they're just invisible. Hold that thought, because it's where most CSAT scores go wrong.
A couple of things worth getting right while you're setting this up:
- Timing beats wording. A survey fired the second a ticket resolves gets a far better response rate than one that lands in an inbox the next morning. Memory fades, and so does the willingness to click.
- Channel matters more than you'd think. Customers reached on their preferred channel rate satisfaction noticeably higher than ones forced onto a channel they didn't want. That's points you can win before changing a word of your support content.
What counts as a good CSAT score?
There's no universal "pass" line, but there are well-worn bands. Here's how to read your number:
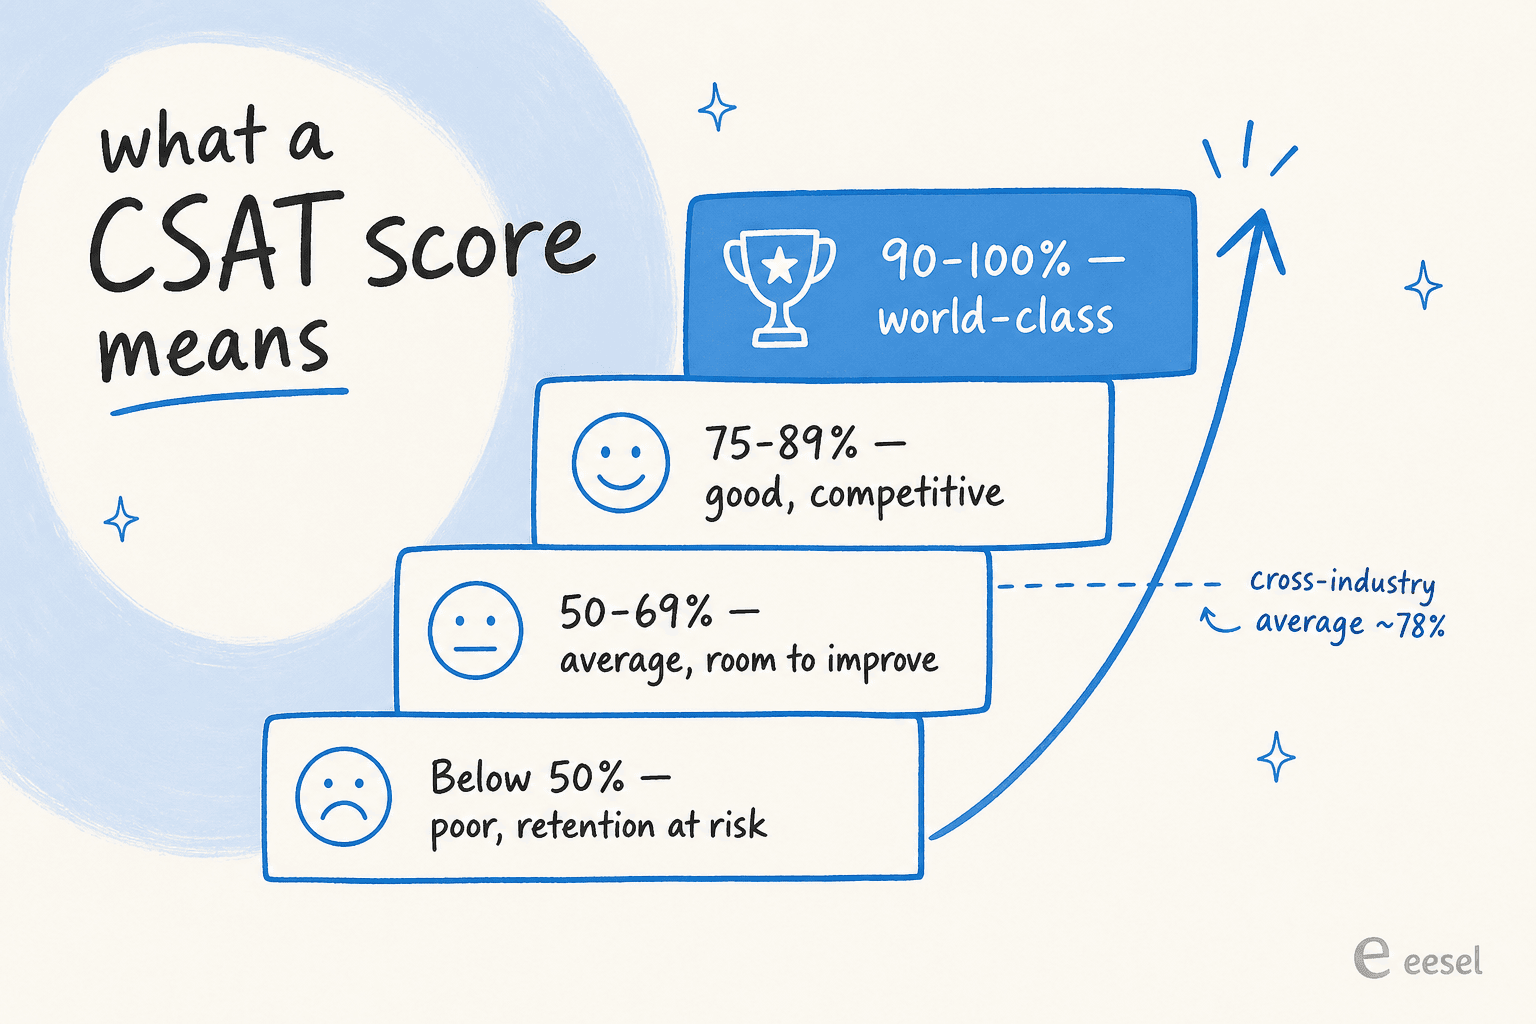
- 90-100%: Exceptional. World-class territory, hard to sustain.
- 75-89%: Good. Competitive in most sectors.
- 50-69%: Average. Real room to improve.
- Below 50%: Poor. Retention is at risk.
The catch is that "good" depends heavily on your industry. The American Customer Satisfaction Index puts the cross-industry average around 78%, but the spread underneath that is wide:
| Industry | Typical CSAT |
|---|---|
| Financial services | ~83% |
| Software / SaaS | ~80% |
| Retail | ~78% |
| Healthcare | ~75% |
| Airlines | ~72% |
| Utilities | ~68% |
| Telecom / cable | ~62% |
Channel pulls the number around too. Live chat and AI chatbots tend to land in the high 70s to mid 80s, phone around 76%, and email support drags the bottom at roughly 61%, mostly because of the wait. If your CSAT looks low, check your channel mix before you blame your team. (If email response time is your bottleneck, that's a first response time problem worth solving on its own.)
CSAT vs NPS vs CES: don't confuse them
CSAT gets lumped together with two other metrics, and teams burn a lot of energy debating which one to "use." The honest answer is they measure different things, so most mature teams track all three.
| Metric | The question it asks | What it tells you |
|---|---|---|
| CSAT | "How satisfied were you with this?" | Quality of a specific interaction |
| NPS | "How likely are you to recommend us?" | Loyalty to the brand overall |
| CES | "How much effort did that take?" | Friction in getting the job done |
CSAT is the most operational of the three. It moves with day-to-day support quality, it's the number teams reach for when they ask whether their support is working, and it correlates tightly with first contact resolution: every 1% improvement in resolving issues on the first try tends to buy you roughly 1% more CSAT. NPS and CES are slower, more strategic reads. None of them replaces the others.
The trap: your CSAT score is missing most of your customers
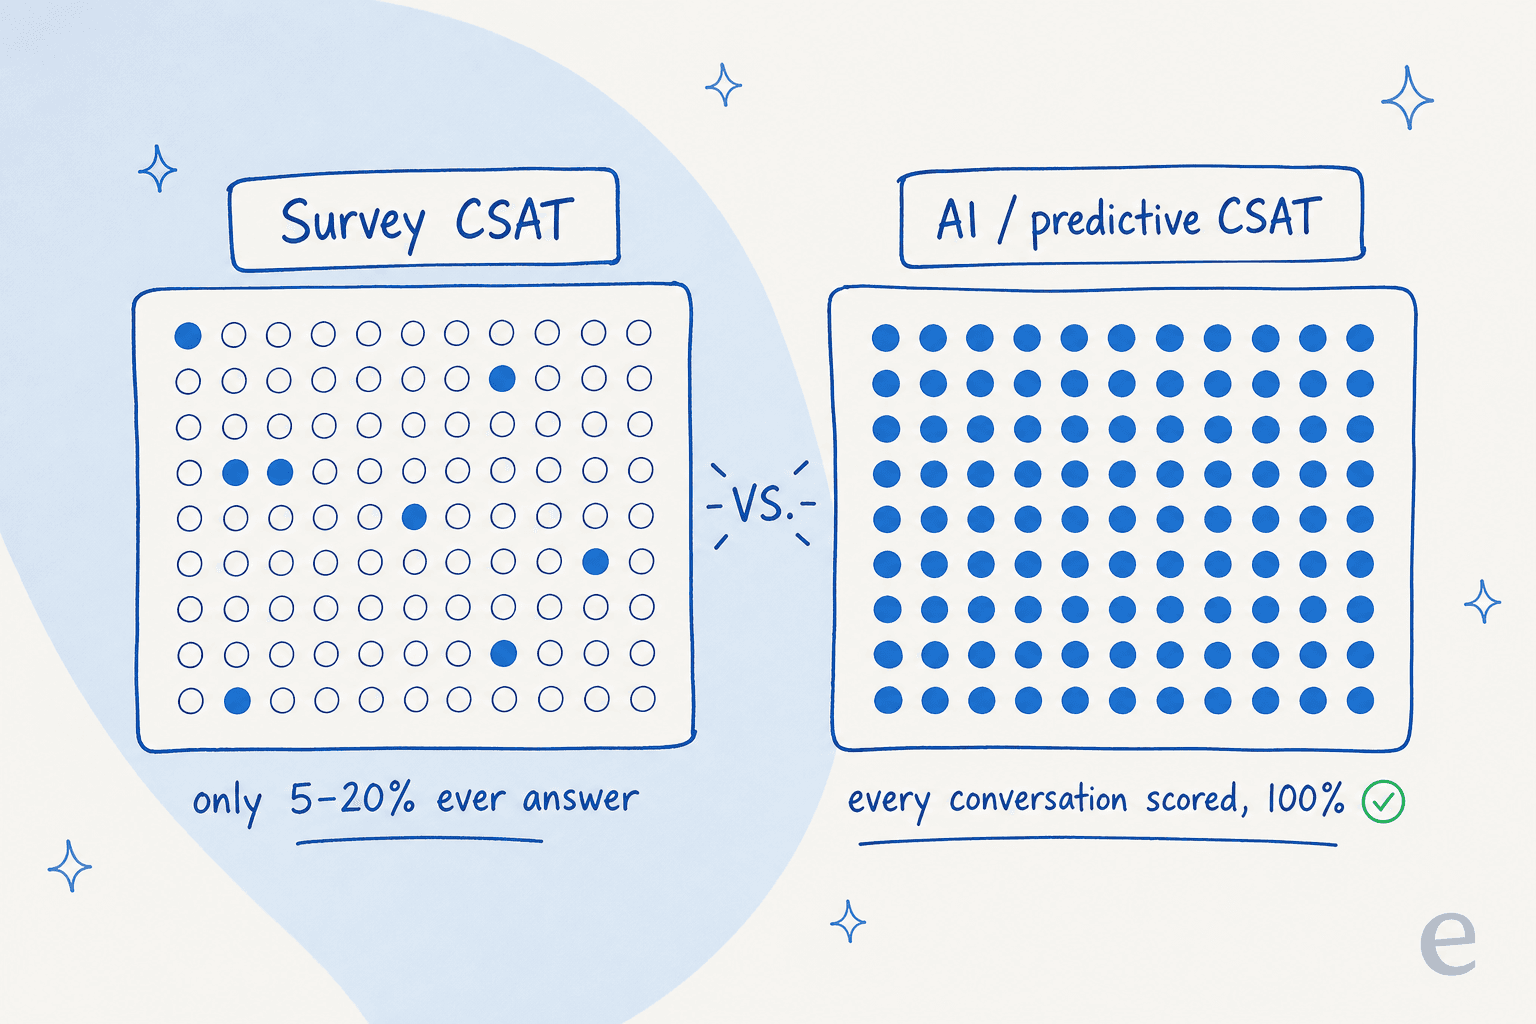
Here's the part that should change how you read your dashboard. Survey response rates are catastrophically low. Contact centers commonly see 2-10% response rates, and even a well-run program tops out around 10-20%. That means 80-98% of your interactions generate zero satisfaction data.
And the customers who do answer aren't a random sample. They cluster at the two poles: the delighted who want to leave praise, and the furious who want to vent. The enormous middle, the people who had a fine-to-mediocre experience, almost never respond. So a tidy 4.2/5 average pulled from a 12% response rate can be hiding a mass of lukewarm customers you'll never hear from until they churn.
It gets worse, because the number is also gameable. Agents learn which interactions to trigger surveys on:
"Agents often trigger surveys at their own discretion, often only after they've gauged that sentiment is positive, ultimately distorting reality."
This is the gap I see most often when teams tell me their CSAT is "healthy." The dashboard says one thing, the Reddit thread about being stuck in a bot loop says another, and both can be true at once because the dashboard is built from a self-selecting 8%.
How AI changes what CSAT can be
The honest fix for a 10% sample isn't a cleverer survey. It's measuring the other 90%. This is where AI shifts CSAT from a lagging report card into a live operational signal, and it does it on both sides of the desk.
AI as the measurement layer
Instead of waiting for a customer to fill out a form, AI models read the conversation itself: sentiment trajectory, frustration markers, whether the question got a real answer, how many times the customer had to repeat themselves. From those signals they predict a satisfaction score for every interaction. This is usually called predictive or inferred CSAT, and modern models reach around 80-90% accuracy against actual survey responses.
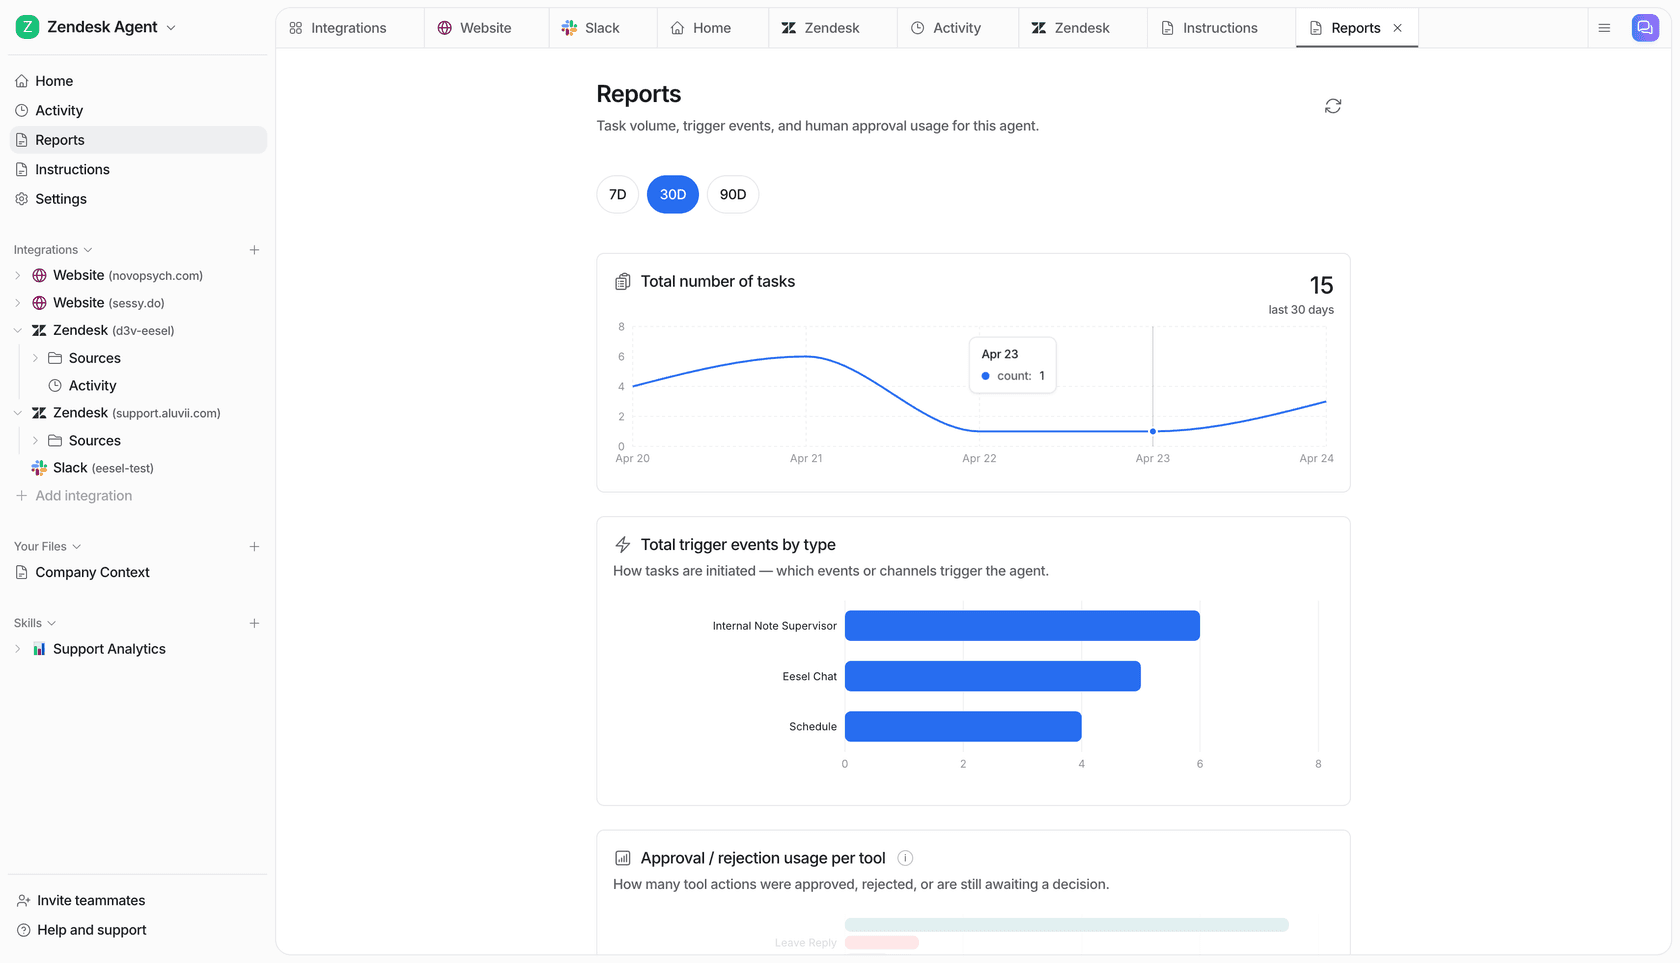
The unlock isn't precision, it's coverage. You go from scoring 10% of conversations to 100%, which means the patterns that were invisible in a survey sample (a confusing policy line, a knowledge gap, one ticket type that quietly tanks satisfaction) finally show up in the aggregate. eesel's reports read this across all of your tickets, not a sample of them.
AI as the support agent
The other half is that AI moves the score by doing the work. Instant first replies, consistent answers pulled from a unified knowledge base, and 24/7 coverage all lift satisfaction on the interactions AI handles, which is a big part of AI support savings. Dialpad reported a 13% CSAT lift on its own support team after deploying AI. The teams I've worked with see similar movement, but only when they're disciplined about one thing: you have to read resolution rate next to CSAT, never on its own.
That pairing is the whole game. A high resolution rate with a low CSAT means your AI is closing tickets without actually helping anyone, the doom-loop where customers give up rather than escalate. One number looks great on the dashboard while the other tells you the truth. As one DTC supplements CX lead we work with put it, the AI will never answer 100% of questions, so it should "only handle the tickets that it's confident to handle, and all the other ones, leave them alone." That's exactly the instinct that protects CSAT. We learned it the hard way: I've watched a confident-sounding bot give a wrong answer to a real customer, which is why every eesel rollout now runs in simulation against your historical tickets first, so you see the coverage and the likely CSAT impact before going live. On Gridwise, that approach resolved 73% of tier-1 requests in the first month.
How to actually improve your CSAT score
Pulling it together, here's what moves the number in practice rather than in theory:
- Survey at the moment of resolution, not the next day. Faster prompts get more (and more representative) responses.
- Get customers on their preferred channel. It's worth several CSAT points before you touch anything else.
- Cut first response time. Speed is the single biggest lever on satisfaction, especially over email and chat.
- Resolve on the first contact. Repeat contacts are a CSAT killer, and first contact resolution tracks almost 1:1 with satisfaction.
- Measure the 90% you're missing. Layer AI-scored CSAT over your survey so you're not steering off a self-selected sample.
- Hand off cleanly. When AI escalates to a human, pass the full context so the customer never repeats themselves. That's the biggest avoidable CSAT drop in any hybrid setup.
None of these require ripping out your helpdesk. If you're on Zendesk or Freshdesk, the survey you already have stays as your ground-truth calibration. The AI layer just covers everything the survey can't reach, and starts fixing the tickets that drag the score down. If you're sizing up AI support automation, this CSAT-plus-resolution pairing is the cleanest read you'll get.
Try eesel for CSAT you can actually trust
If your CSAT number feels both important and slightly fictional, that's the problem eesel AI is built for. It plugs into your existing helpdesk, learns from your past tickets and help docs on day one, and handles the routine tickets that quietly drag satisfaction down, while its reports score sentiment and resolution across every conversation instead of the 10% that answer a survey.
The part I'd actually point you to first is simulation mode: run the AI against thousands of your historical tickets in a sandbox and see the coverage, the gaps, and the likely CSAT impact before a single customer is involved. It works like a new hire who already knows your help center, and it's free to try with no credit card.