Zendesk metrics that matter: A practical guide for 2026
Stevia Putri
Last edited March 3, 2026
If you are running a support team on Zendesk, you are probably drowning in data. The platform tracks dozens of metrics, from first reply time to ticket reopen rates, and everything in between. But here is the uncomfortable truth: most teams track too many metrics and act on too few.
The goal is not to build the perfect dashboard. It is to identify the Zendesk metrics that matter for your specific operation, understand what they are telling you, and take action. This guide cuts through the noise to focus on the KPIs that actually drive results.
We will cover three essential categories: efficiency metrics that measure speed, quality metrics that measure customer experience, and operational metrics that keep your team healthy. Along the way, we will look at how AI teammates can help improve these metrics at the source, not just report on them after the fact.
What are Zendesk metrics and why track them?
Zendesk metrics are the vital signs of your support operation. They are the KPIs that live inside Zendesk Explore, the platform's analytics hub, and they tell you how your team is performing across speed, quality, and capacity.
Think of them like the instruments on a car dashboard. You do not need to watch every gauge constantly, but you do need to know which ones indicate real problems. A rising temperature gauge means pull over. A steady fuel level means keep driving. Support metrics work the same way.
Tracking the right metrics matters because they inform real decisions. Should you hire more agents? Is your training program working? Are customers actually happy, or just not complaining? Without data, these become gut-feel decisions. With the right metrics, you have evidence.
The key is focusing on metrics that lead to action. A number on a dashboard is useless if it does not tell you what to do next.
Essential efficiency metrics
Efficiency metrics measure how quickly your team connects with customers and handles their needs. Speed is not everything, but it is the foundation. Customers who wait too long for a response rarely rate the experience highly, no matter how good the eventual resolution.
First reply time (FRT)
First reply time measures the time between a customer submitting a ticket and an agent sending the first real response. Auto-responses do not count. This is about human acknowledgment.
Why does it matter? Because first impressions are sticky. A quick first reply tells the customer their issue is seen and someone is on it. Even if the full resolution takes hours or days, that initial acknowledgment buys goodwill.
Industry benchmarks vary by channel and industry, but generally: under one hour for email is solid, under 15 minutes for chat is expected. If your FRT is climbing, it usually means you need more coverage, better routing, or both.
To improve FRT, look at your staffing against your ticket volume patterns. Tools like eesel AI can help by drafting replies for agents to review, cutting the time from "ticket assigned" to "response sent." For teams ready for more scale, an AI Agent can provide immediate first responses around the clock.
Average handle time (AHT)
Average handle time tracks how long an agent spends actively working on a ticket, including research, writing the response, and any wrap-up work. It is a productivity measure, but it needs context.
A low AHT is not automatically good. If agents are rushing through tickets to hit targets, quality suffers. The goal is efficient handling, not fast handling. Look at AHT alongside CSAT and reopen rates to understand whether speed is coming at the cost of quality.
If AHT is high because agents spend too much time hunting for information, that is a solvable problem. Better knowledge base organization, integrated tools, and AI-powered information surfacing can all help agents find answers faster without sacrificing thoroughness.
Full resolution time
Full resolution time tracks the entire journey of a ticket from creation to closure. Unlike first reply time, which measures the start of the interaction, this measures the finish.
This metric captures everything: back-and-forth communication, waiting on customers for more information, internal escalations, and actual troubleshooting time. It is the purest measure of how long customers wait for a complete solution.
Long resolution times often indicate process issues rather than agent performance issues. Tickets bouncing between departments, unclear escalation paths, or missing information all extend resolution time. Fixing these usually requires operational changes, not just telling agents to work faster.
Tickets solved
Tickets solved is the simplest productivity metric: how many tickets your team resolves in a given period. It is a useful high-level indicator of team output.
The key is comparing tickets solved to tickets created. If you are solving 100 tickets per day but creating 120, your backlog is growing. If you are solving 100 and creating 80, you are catching up. This ratio tells you whether your team is keeping pace with demand.
Individual agent solve rates can also reveal training needs or workload imbalances. Just remember that not all tickets are equal. An agent handling complex technical issues will solve fewer tickets than one handling password resets. Context matters.
Quality and customer experience metrics
Speed gets you in the game. Quality keeps you there. These metrics measure whether your fast responses are actually solving problems and making customers happy.
Customer satisfaction score (CSAT)
CSAT is the gold standard for measuring customer happiness. After a ticket is resolved, Zendesk can automatically send a survey asking customers to rate their experience, typically on a 1-5 scale.
The calculation is straightforward: the percentage of satisfied responses (usually 4s and 5s) out of total responses. A CSAT of 80% means 80% of respondents rated the interaction positively.
What is a good CSAT? Benchmarks vary by industry, but 75-85% is generally considered solid. Above 90% is excellent. Below 70% suggests serious issues with service quality.
The ACLU provides a real example. After expanding Zendesk use across internal IT and database teams, they saw a 10.5% increase in CSAT by streamlining employee service across departments. The metric improvement reflected real operational changes.
Best practices for CSAT surveys: send them immediately after resolution while the experience is fresh, keep them short (one question is often enough), and close the loop by following up with detractors.
First contact resolution (FCR)
First contact resolution measures the percentage of tickets resolved in a single interaction, with no follow-ups needed. It is efficiency and quality combined.
A high FCR rate means your agents are empowered with the right information and authority to solve problems immediately. It also means customers get faster resolutions with less effort on their part.
Tesco demonstrates what is possible. Using Zendesk to scale internal customer service for 460,000 employees across nine countries, they achieved a 79% one-touch resolution rate. This high FCR reduced the need for reopened tickets and improved internal efficiency significantly.
If your FCR is low, look at three areas: agent training (do they have the knowledge?), agent authority (can they make decisions?), and ticket complexity (are you routing complex issues to the right specialists?).
Ticket reopen rate
Ticket reopen rate tracks how often solved tickets get reopened by the same customer for the same issue. It is a quality indicator: a low reopen rate suggests thorough resolutions, while a high rate suggests customers are being sent away with incomplete solutions.
Some reopens are inevitable. Customers discover new information, or the fix does not work as expected. But if your reopen rate is consistently above 5-10%, you have a problem with resolution quality.
Common causes include agents rushing to hit solve quotas, unclear resolution criteria, or product issues that support cannot actually fix. Addressing reopen rates usually requires coaching agents on thoroughness and setting clearer expectations for what constitutes a resolved ticket.
One-touch tickets
One-touch tickets are a subset of FCR: tickets resolved in a single agent reply. No back-and-forth, no clarification requests, just one comprehensive response that solves the problem.
This metric highlights both agent capability and knowledge base effectiveness. When agents have access to clear, accurate information, they can provide complete answers in one shot. When the knowledge base is incomplete or hard to search, agents need multiple touches to gather information.
High one-touch rates correlate with high CSAT. Customers appreciate getting a complete answer without having to explain their problem multiple times.
Operational health metrics
These metrics keep you out of trouble. They warn you when demand is outpacing capacity, when processes are breaking down, or when service levels are at risk.
Ticket backlog
Your backlog is all tickets currently in New, Open, Pending, or On-hold status. It represents work in the pipeline that has not been completed.
A healthy backlog is normal. Tickets come in, tickets get worked, some wait for customer responses. But a growing backlog is a warning sign. It means demand is exceeding your team's capacity to resolve issues.
Track backlog trends, not just absolute numbers. If your backlog grows 10% month over month for three months, you need more agents, better self-service, or process improvements. If it stays flat, your team is keeping pace.
Ticket volume and trends
Ticket volume measures the total number of support requests over time. It is your demand signal.
Tracking volume helps you spot patterns: seasonal spikes, product launch impacts, or emerging issues causing sudden increases. It also helps with resource planning. If you know January is always your busiest month, you can staff accordingly.
Look for anomalies. A 50% spike in tickets after a product update suggests a problem with the release. A gradual 10% increase quarter over quarter suggests growth that may require scaling your team.
SLA compliance
Service level agreements define expected response and resolution times for different ticket types. SLA compliance measures how often you meet those commitments.
For example, if your SLA says high-priority tickets get a first response within one hour, SLA compliance tracks what percentage actually do. Strong compliance builds trust with customers and internal stakeholders.
The Salvation Army shows the impact. Supporting 5,500 employees across 13 states and 600 locations, their IT team achieved 99% CSAT by using Zendesk to meet SLAs and scale internal support consistently.
If compliance is slipping, you either need more resources or better prioritization. Not all tickets need the same SLA, and misaligned priorities often cause important tickets to wait while trivial ones get fast responses.
How to prioritize which Zendesk metrics to improve first
You cannot optimize everything at once. Here is a practical framework for deciding where to focus.
Start with efficiency metrics. If customers are waiting hours for first replies, fixing quality metrics is premature. Speed is table stakes. Get your first reply time and resolution time to acceptable levels before worrying about fine-tuning CSAT.
Next, focus on quality. Once you are responding quickly, make sure those responses are actually solving problems. CSAT, FCR, and reopen rates tell you whether your speed is coming at the cost of quality.
Finally, optimize operational metrics. Backlog, volume trends, and SLA compliance help you scale sustainably. These become critical as you grow.
Watch for warning signs that indicate which category needs attention:
- High volume + slow FRT = efficiency problem
- Fast responses + low CSAT = quality problem
- Growing backlog + flat team size = operational problem
Moving from tracking to improving your metrics
Here is the limitation of dashboards: they show you problems, but they do not solve them. A chart showing rising first reply time is useful information, but it does not tell you how to fix it.
This is where AI teammates change the equation. Instead of just monitoring metrics after the fact, AI can improve them at the source.
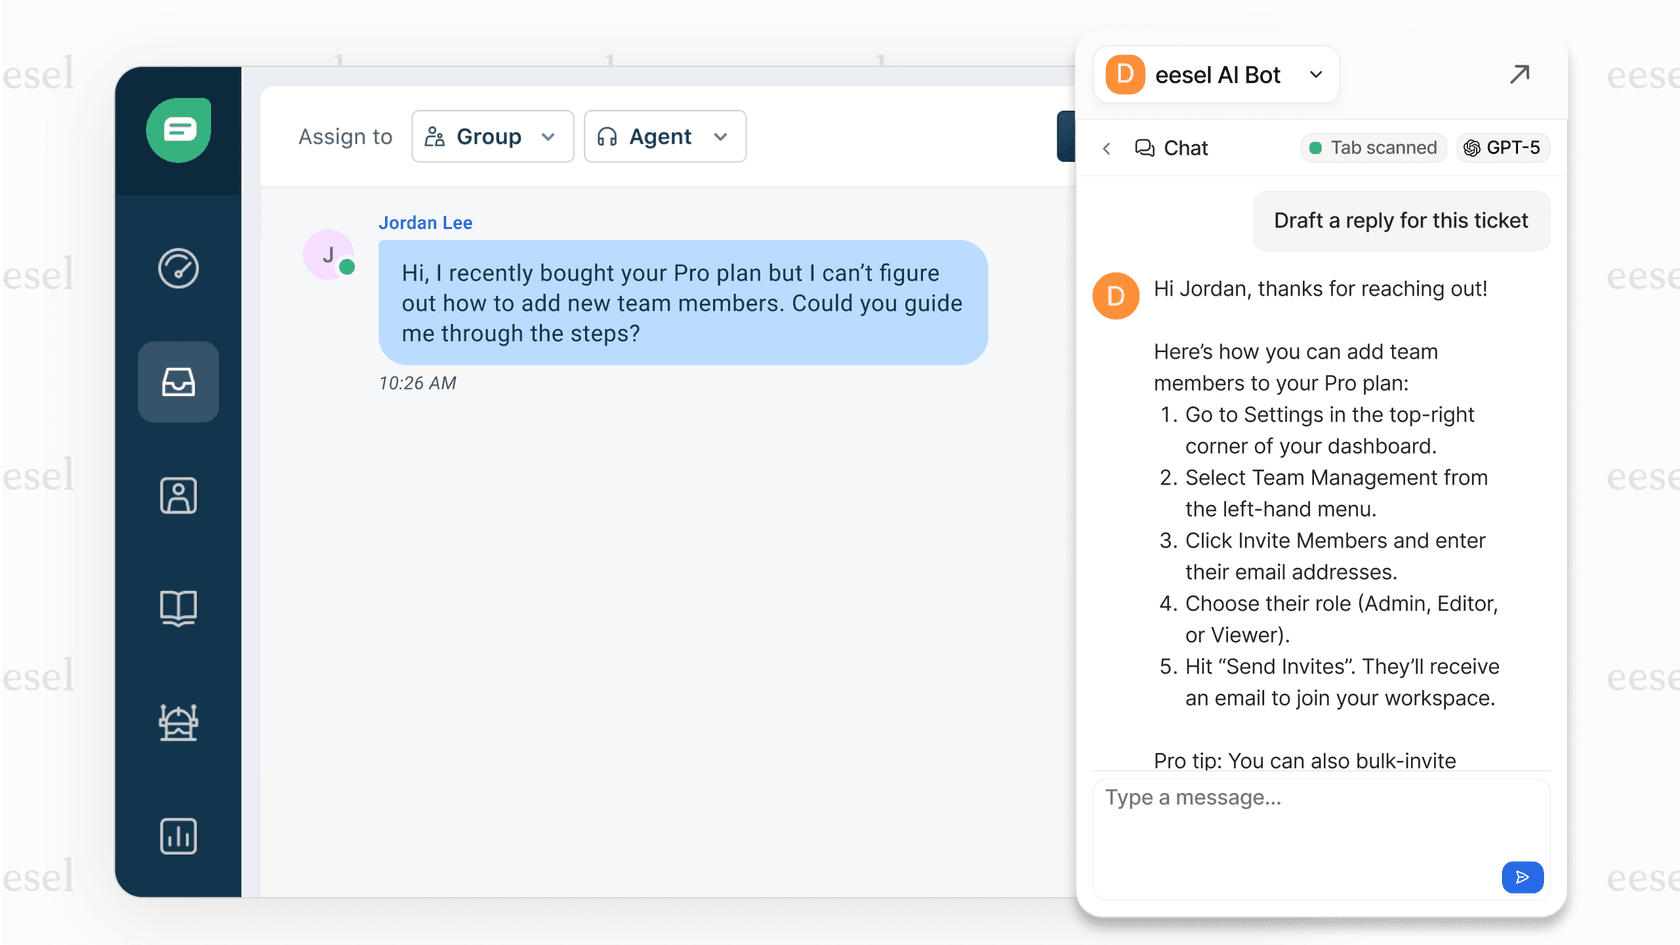
Take first reply time. An AI Copilot can draft replies for agents to review and send, cutting the time from assignment to response. An AI Agent can handle simple tickets autonomously, providing immediate responses around the clock.
For handle time, AI can surface relevant knowledge base articles and past ticket resolutions right in the agent interface. Agents spend less time searching and more time solving.
For quality metrics, AI trained on your best past resolutions can help ensure consistent, thorough responses that reduce reopen rates and improve CSAT.
The difference is moving from passive monitoring to active improvement. Instead of looking at a dashboard and saying "we need to respond faster," you have a teammate that actually helps you do it.
Start improving your Zendesk metrics today
The essential framework is simple: track efficiency to ensure speed, quality to ensure satisfaction, and operational health to ensure sustainability. Start with the metrics that indicate immediate problems, then work toward optimization.
Remember that metrics are only valuable when they drive action. A number on a dashboard is meaningless if it does not change behavior. The goal is insight that leads to improvement.
If you are ready to move beyond tracking metrics to actually improving them, invite eesel to your team. Our AI integrates directly with Zendesk to draft replies, automate responses, and surface the knowledge your agents need to perform at their best. See eesel in action or try it free and start moving your metrics in the right direction.
Frequently Asked Questions
Share this article

Article by
Stevia Putri
Stevia Putri is a marketing generalist at eesel AI, where she helps turn powerful AI tools into stories that resonate. She’s driven by curiosity, clarity, and the human side of technology.